Blog
Latest news and updates from our team
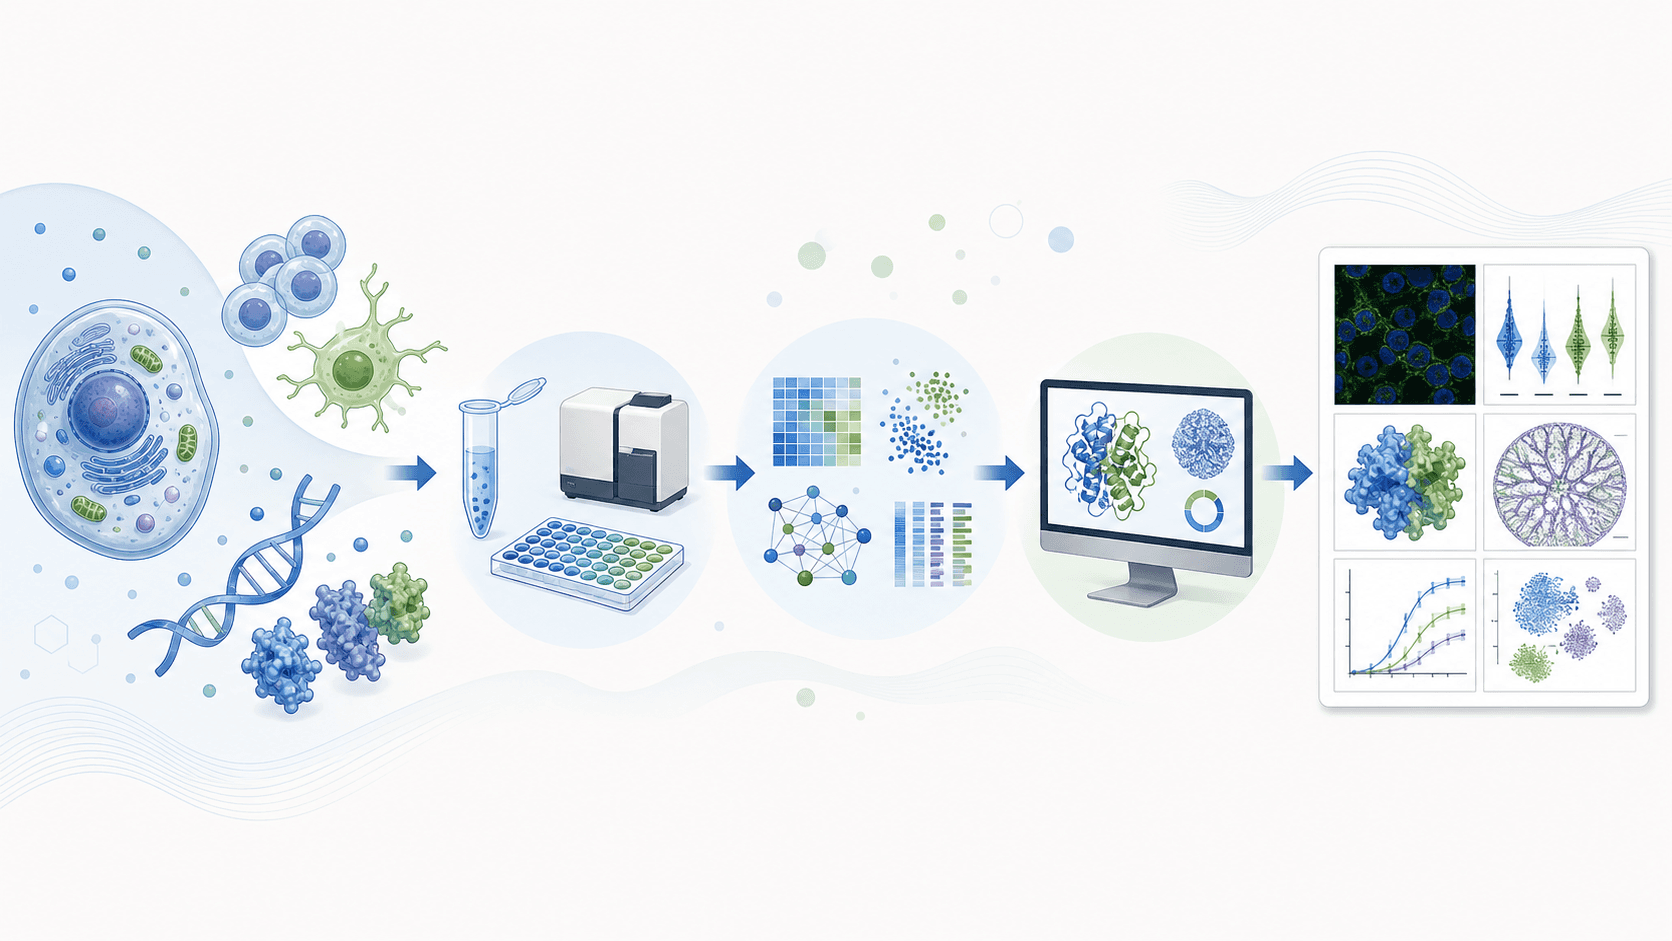
How to Draw Biomedical Paper Figures with AI: A Unified Workflow for Cell, Pathway, and Workflow Diagrams
How to keep cell diagrams, signaling pathway figures, and experimental workflows visually consistent across one biomedical paper — split figures into a background layer, mechanism layer, and experiment layer, then generate editable drafts with structured prompts. Includes prompt templates.

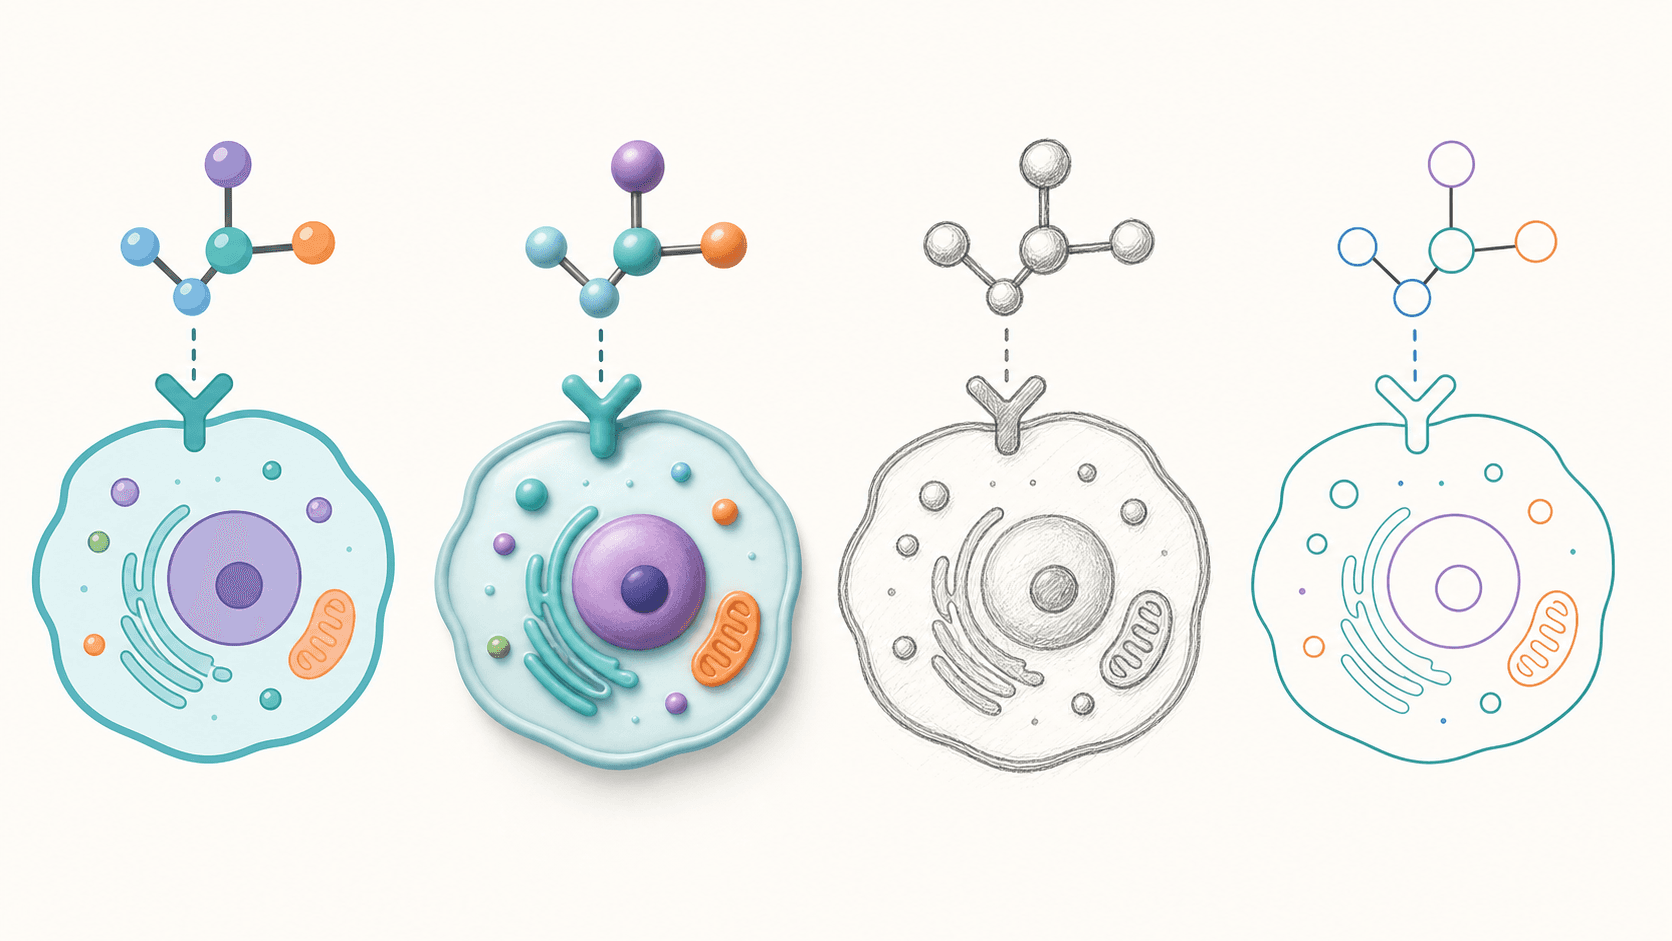
How to Change the Style of a Figure with AI: Flat Vector, 3D, Hand-Drawn & Journal Style (2026)
Restyle a diagram with AI without redrawing it — switch a figure between flat vector, 3D render, hand-drawn sketch, and clean journal style just by describing the look you want. Copy-paste prompts, a reusable style template, and an AI figure editor that does the work.
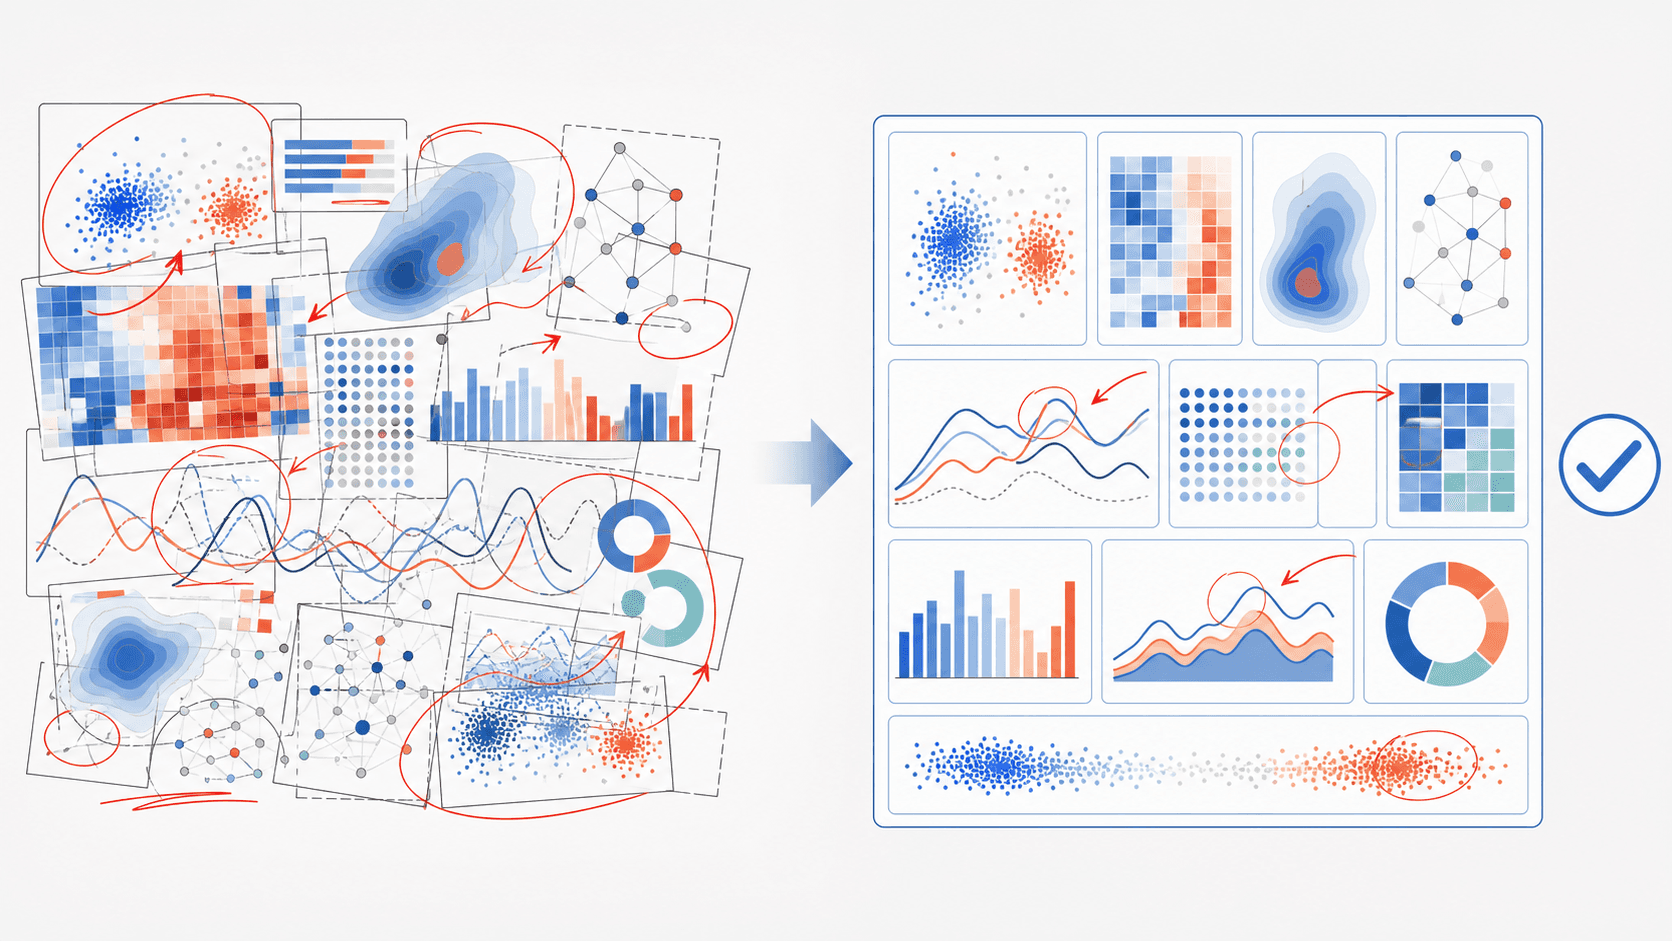
"Figure Is Unclear": 6 Checkpoints to Revise a Paper Figure with AI After Peer Review
When a reviewer says "Figure is unclear," don't rush to draw a more complex one. Use 6 checkpoints to pinpoint problems in hierarchy, reading order, arrows, labels, and panel logic, then rebuild a clearer version with AI. Includes revision prompts and a pre-submission checklist.
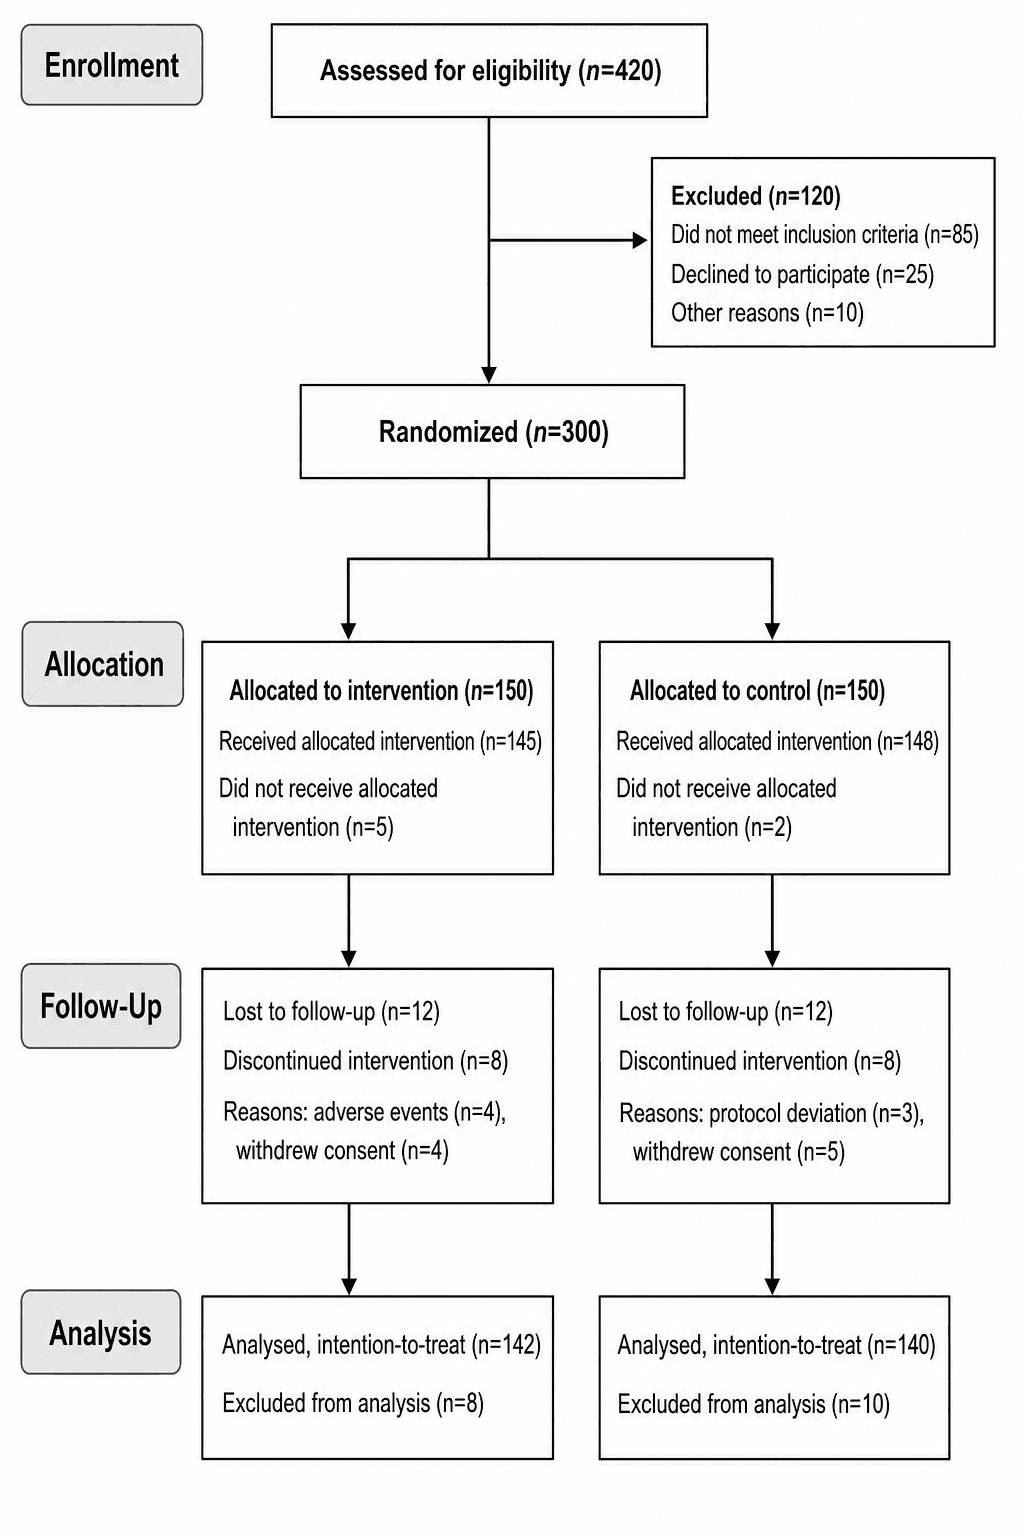
How to Make a CONSORT Diagram for a Randomized Trial (2026)
Make a publication-ready CONSORT flow diagram for an RCT without drawing boxes by hand. Show enrollment, allocation, follow-up, and analysis with exclusion reasons and counts — all by describing it to an AI.
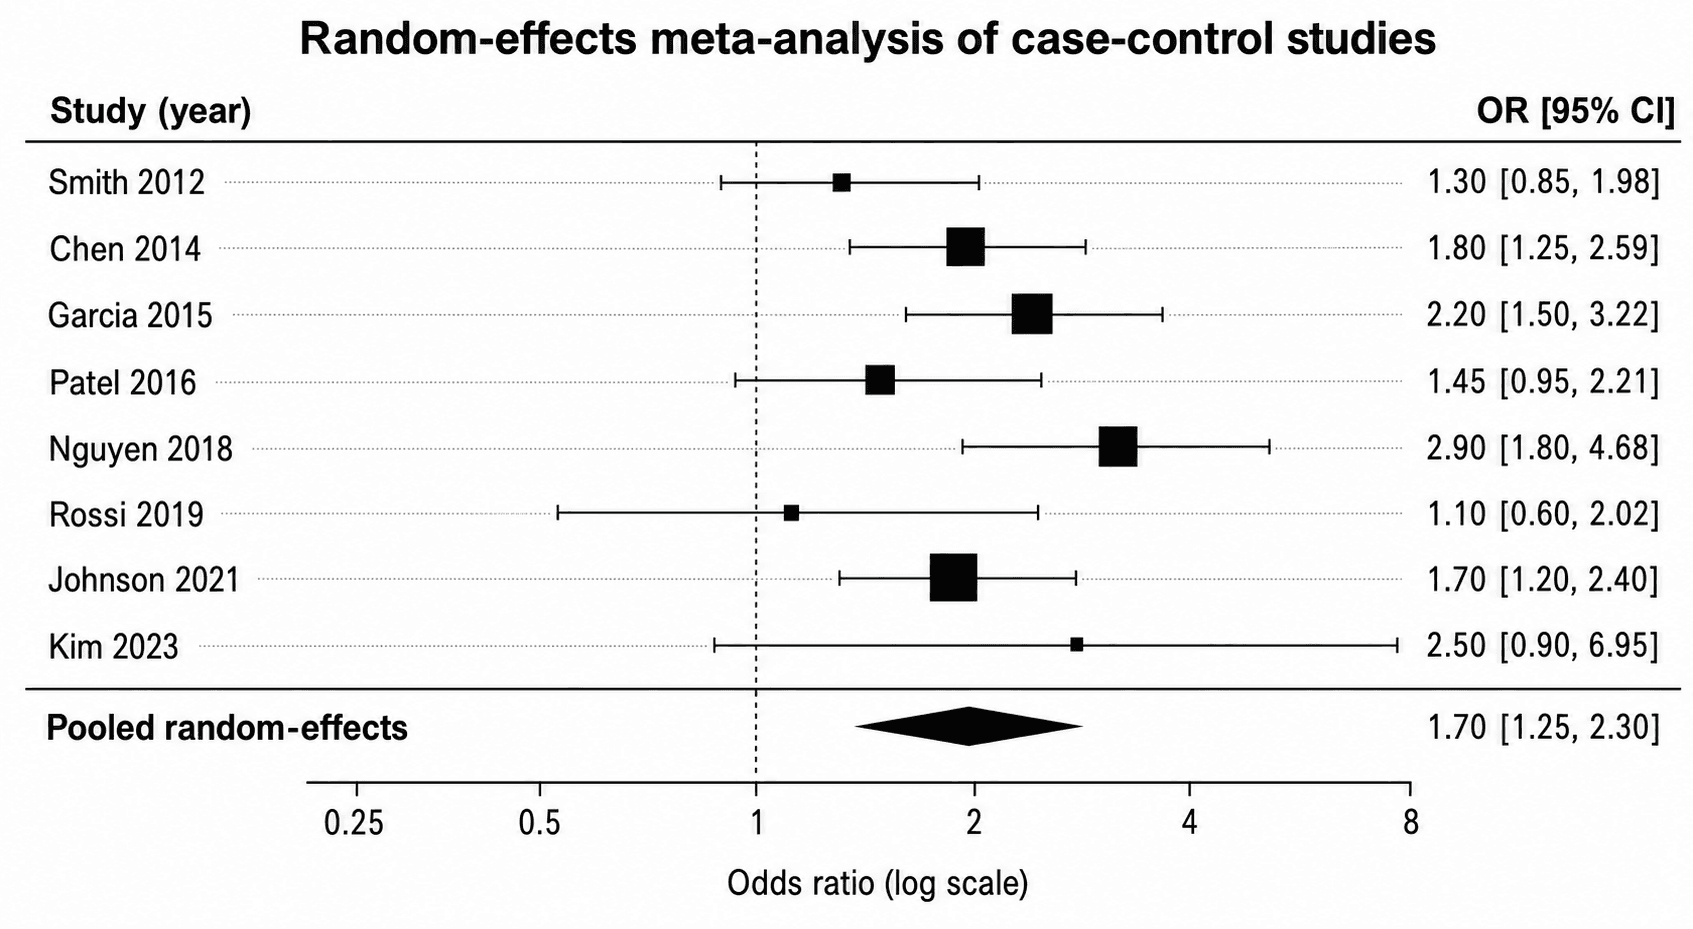
How to Make a Forest Plot from Meta-Analysis Data (2026)
Create a forest plot from CSV or Excel data without coding. Map effects, confidence intervals, weights, and subgroups, then refine the pooled figure in SciVis.
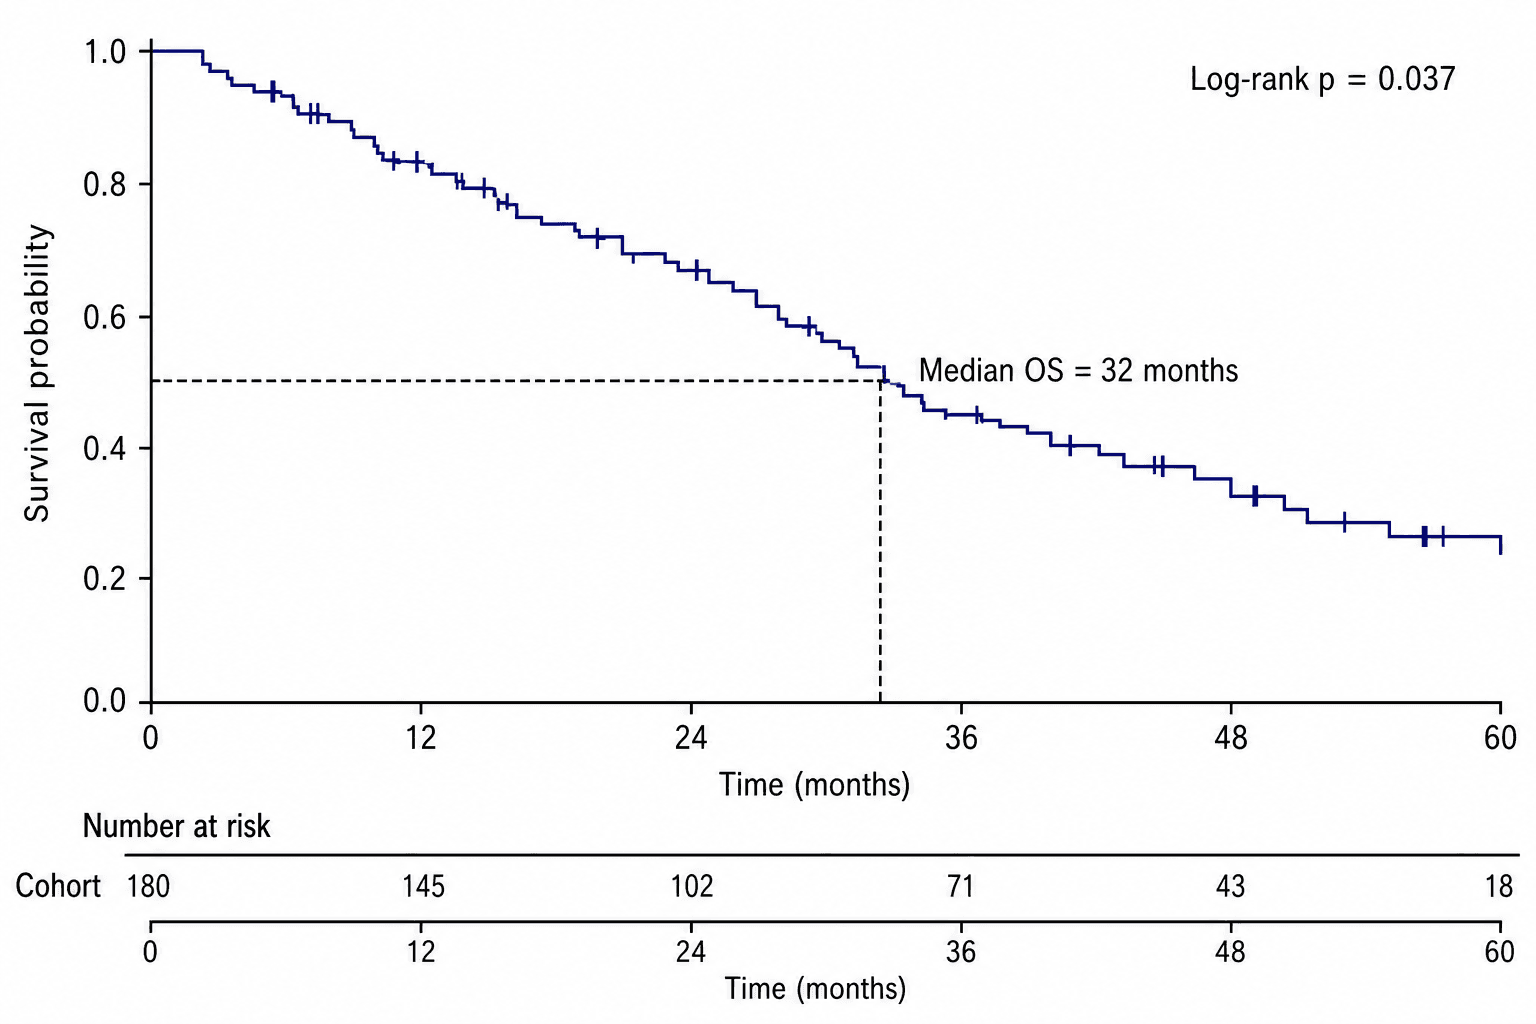
How to Make a Kaplan-Meier Plot from Survival Data (2026)
Create a Kaplan-Meier survival plot from CSV or Excel data without coding. Map time, event, and group columns, show censoring and risk tables, then edit the result in SciVis.