Blog
Latest news and updates from our team

Definition of Terms in Research: Examples & Template
Write a clear definition of terms in research with original examples, conceptual vs operational definitions, a reusable table, and consistent figure labels.

Scientific Data Visualization: 46 CSV & Excel Chart Tools
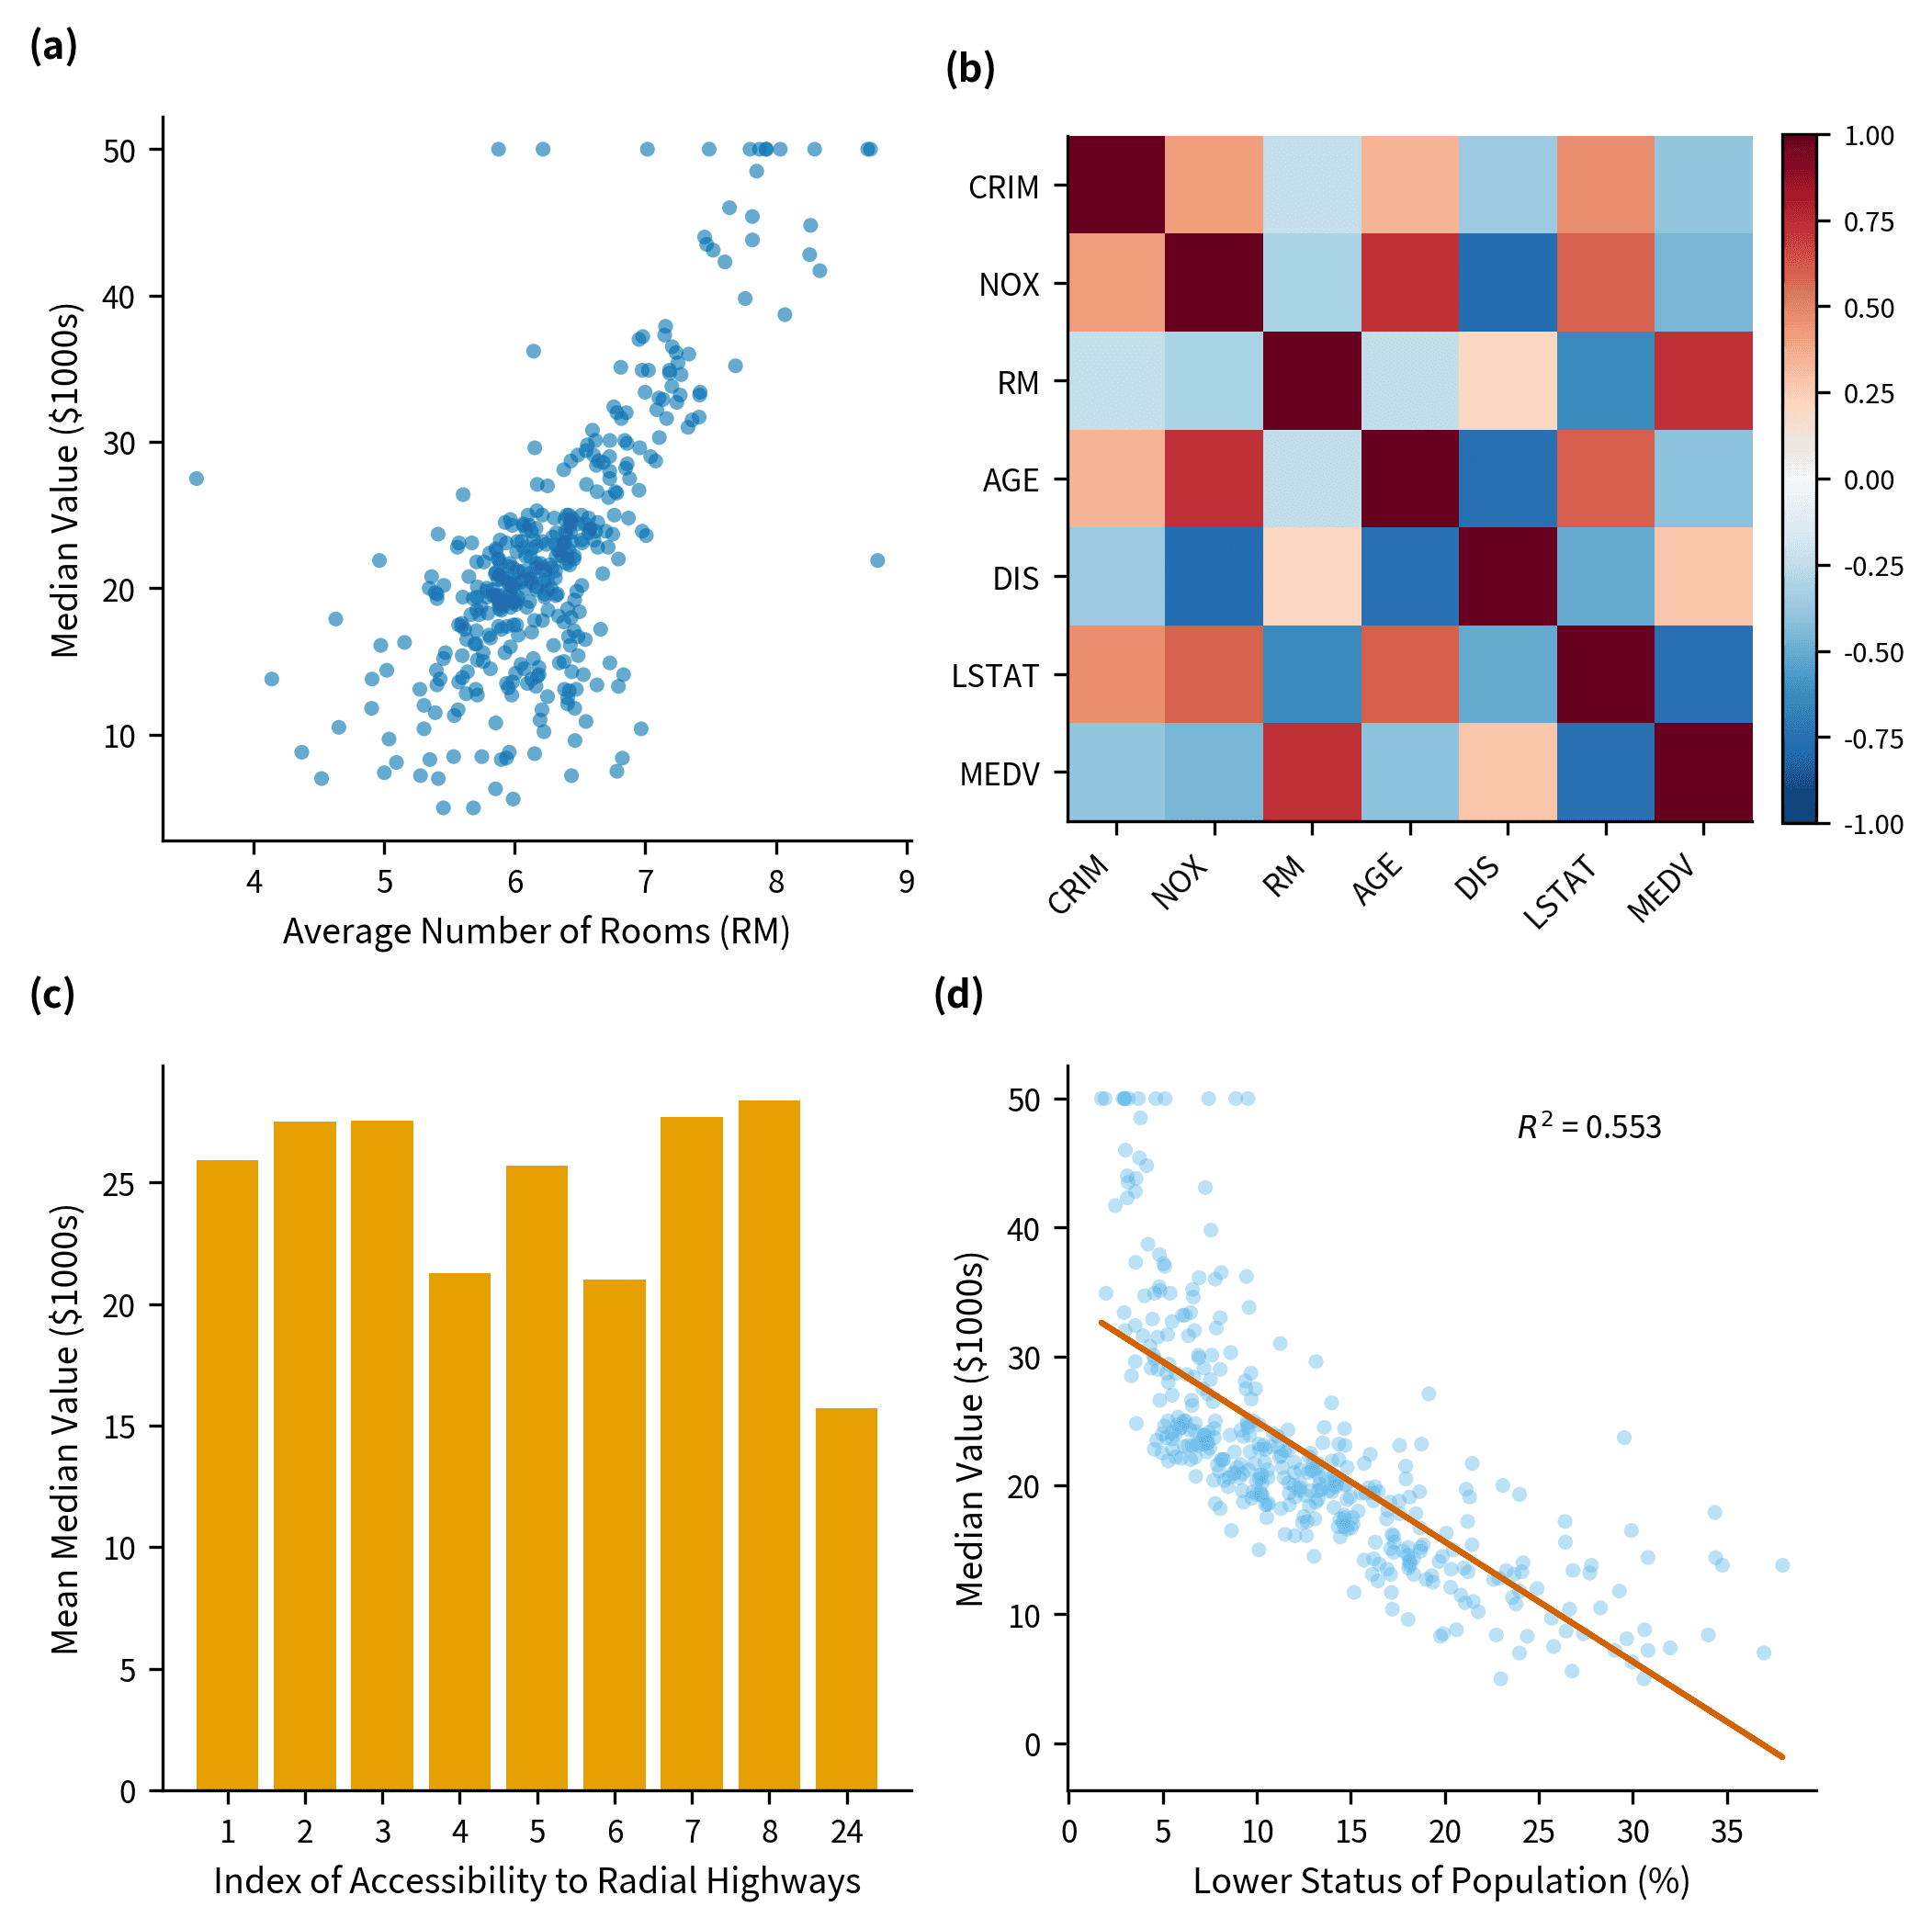
Choose the right scientific chart, review its required data columns, and create 46 publication-ready plots from CSV or Excel with SciDraw SciVis.
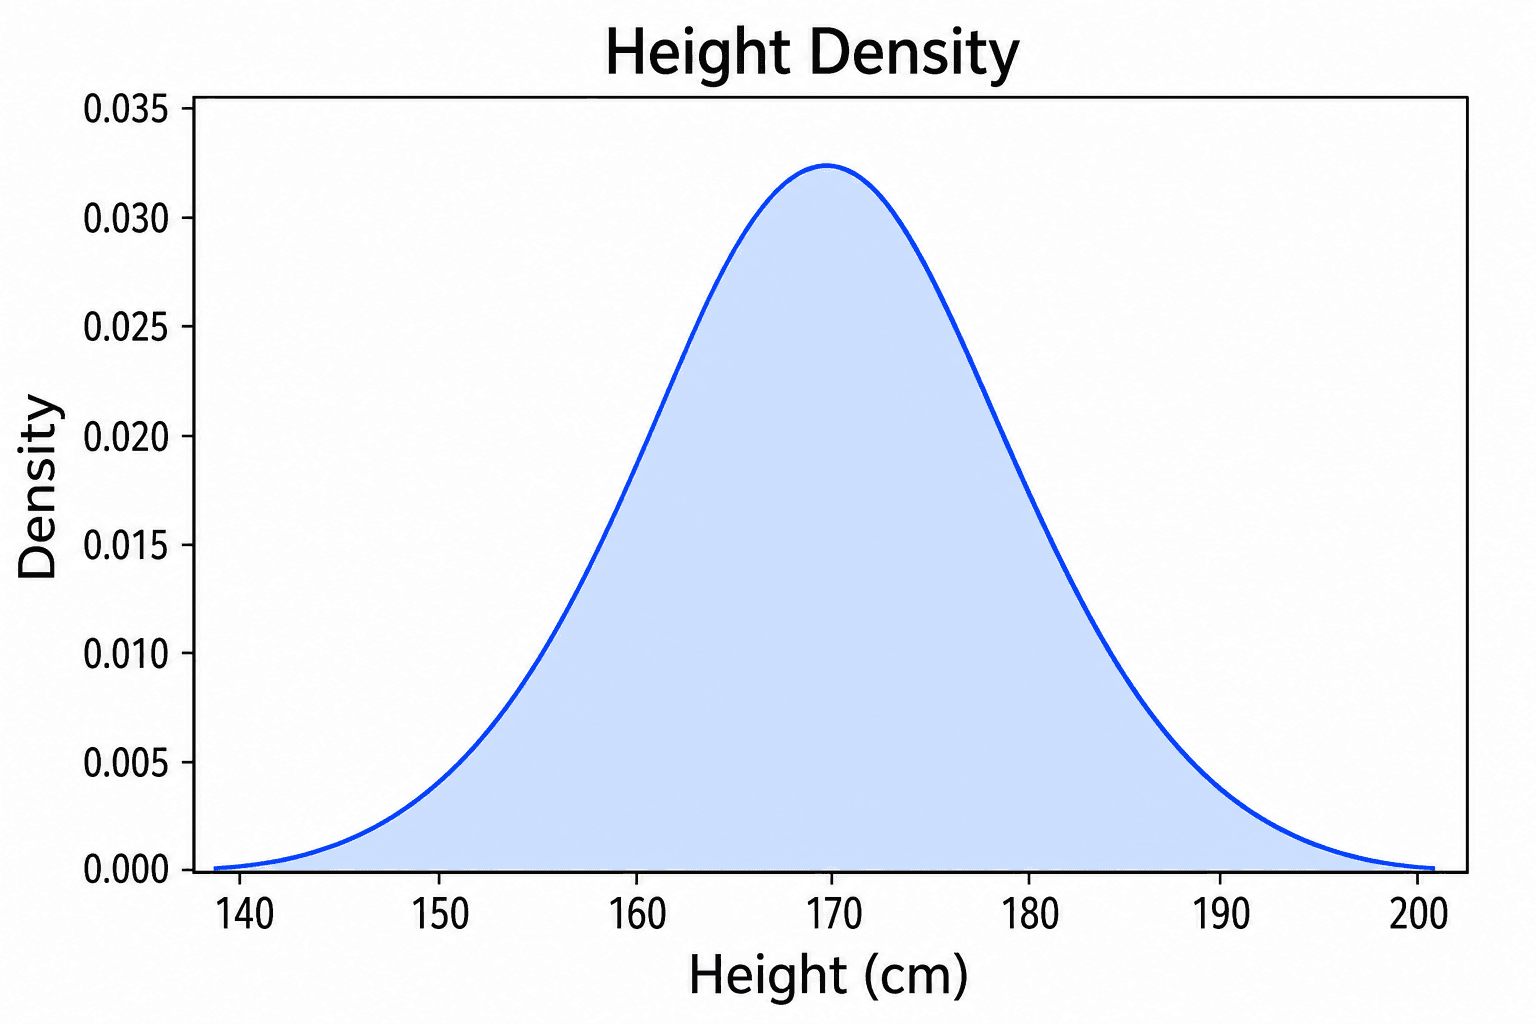
How to Make a Density Plot from CSV or Excel Data
Create a density plot from CSV or Excel without coding. Prepare group and value columns, choose smoothing, compare distributions, and edit in SciVis.
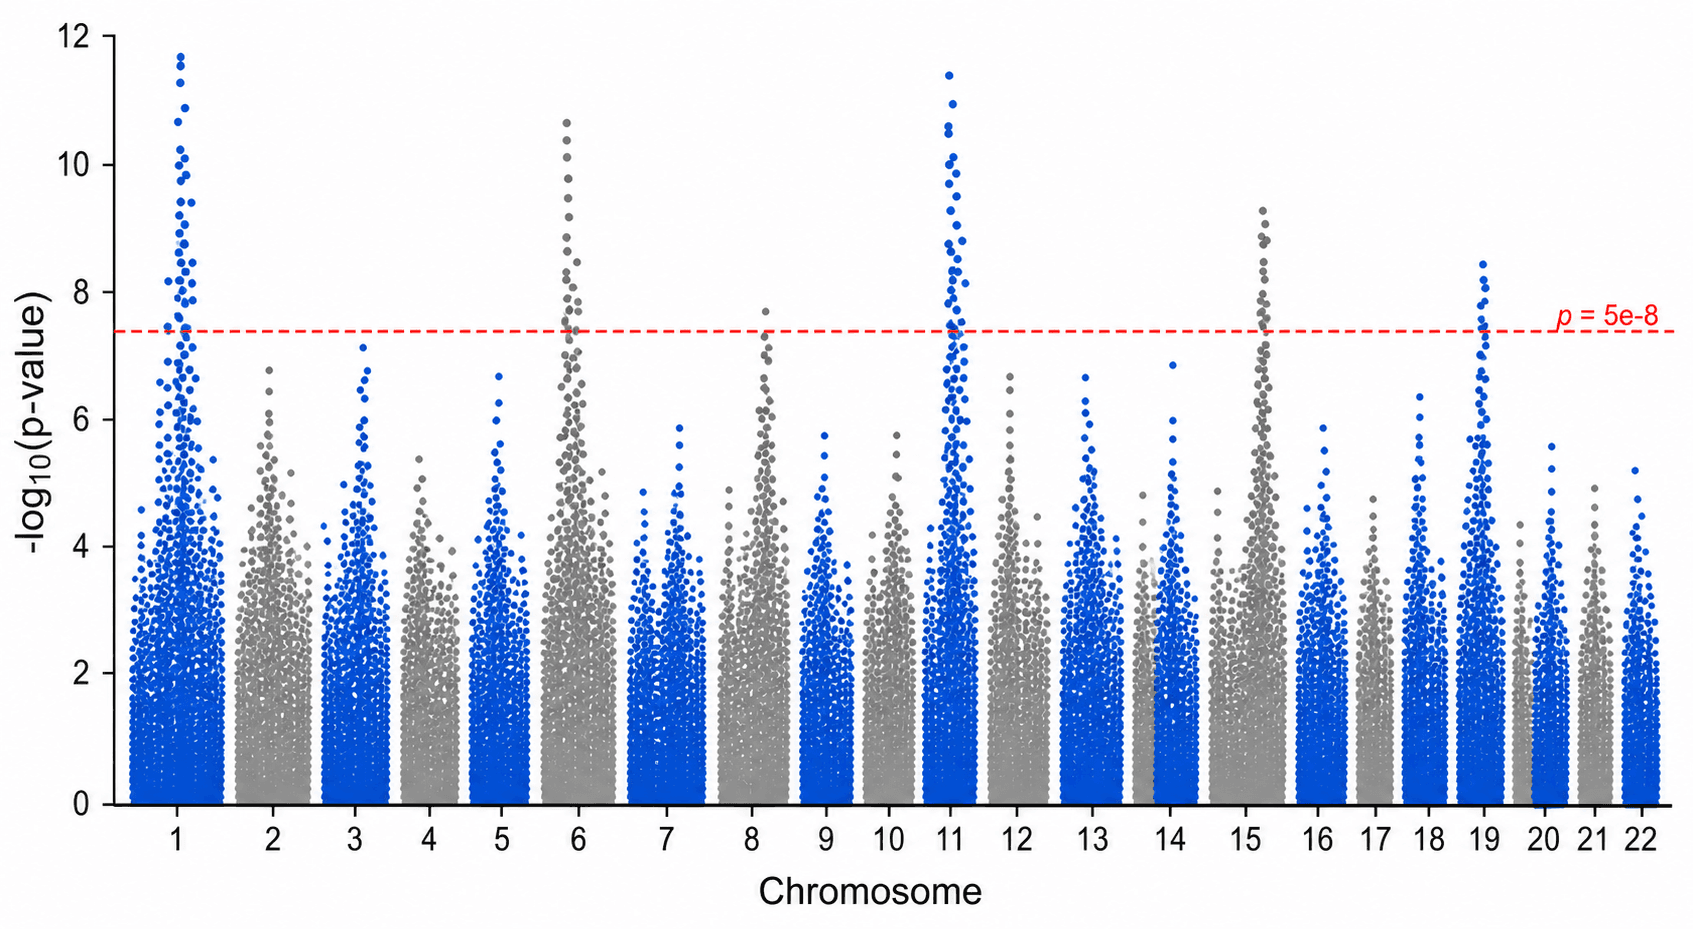
How to Make a Manhattan Plot for GWAS Data (CSV/Excel)
Create a Manhattan plot from GWAS CSV or Excel data. Map chromosome, position, and p-values, annotate loci, verify thresholds, and edit in SciVis.
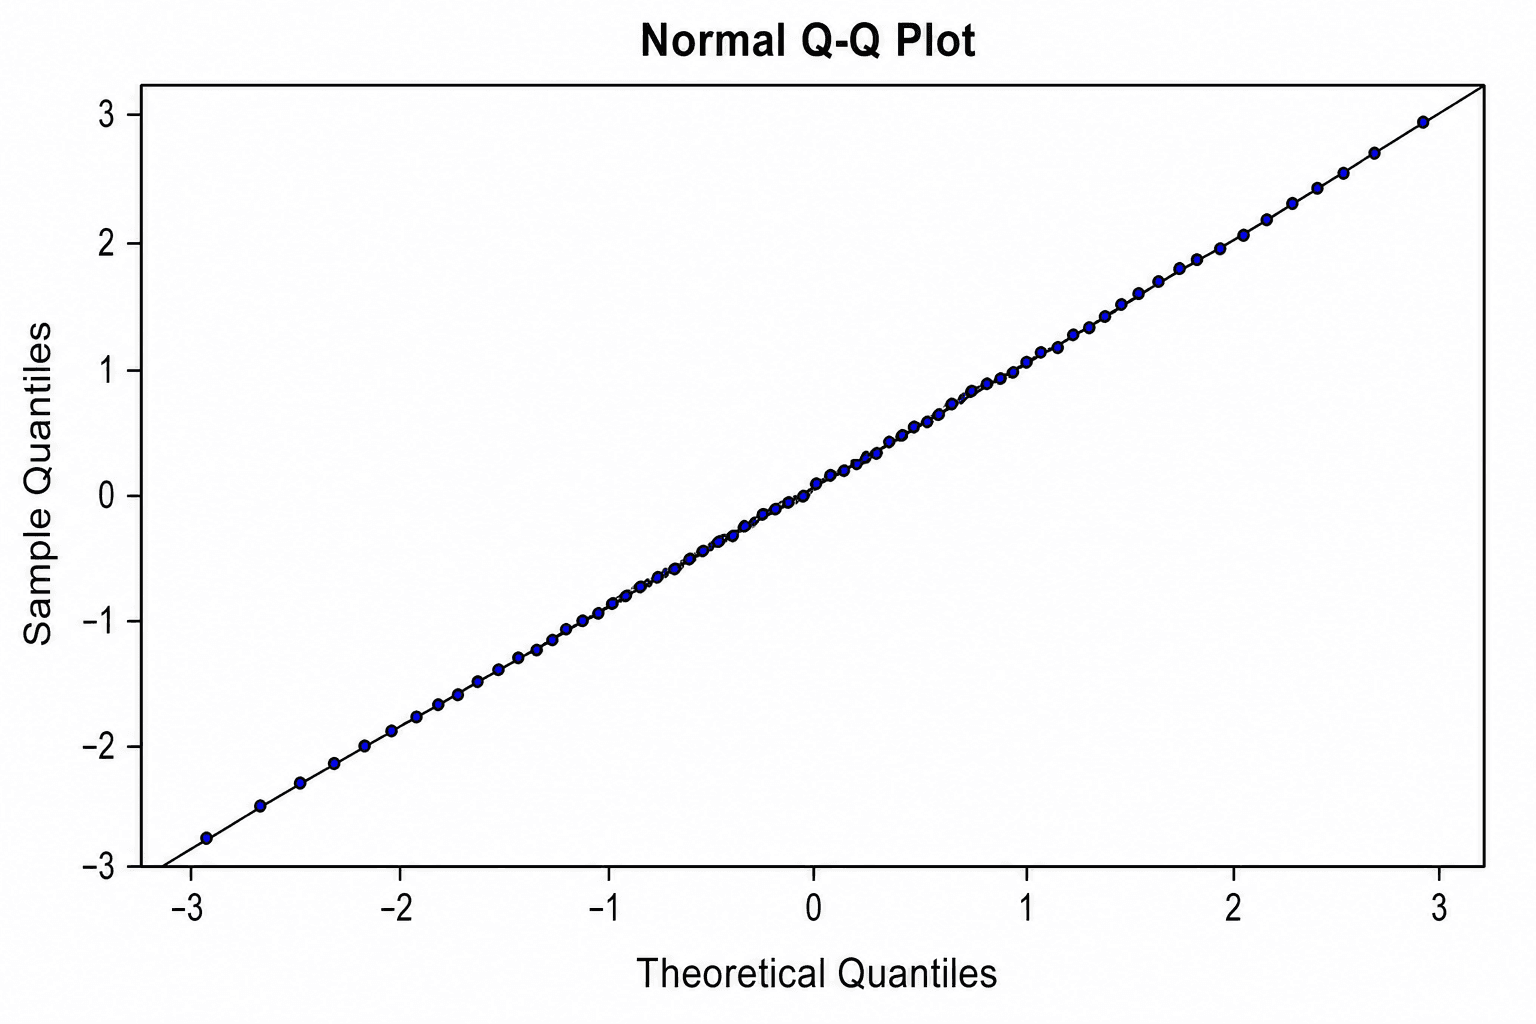
How to Make and Interpret a Q-Q Plot from CSV or Excel Data
Create a Q-Q plot from CSV or Excel without coding. Prepare observed and theoretical quantiles, inspect tails and confidence bands, and edit in SciVis.
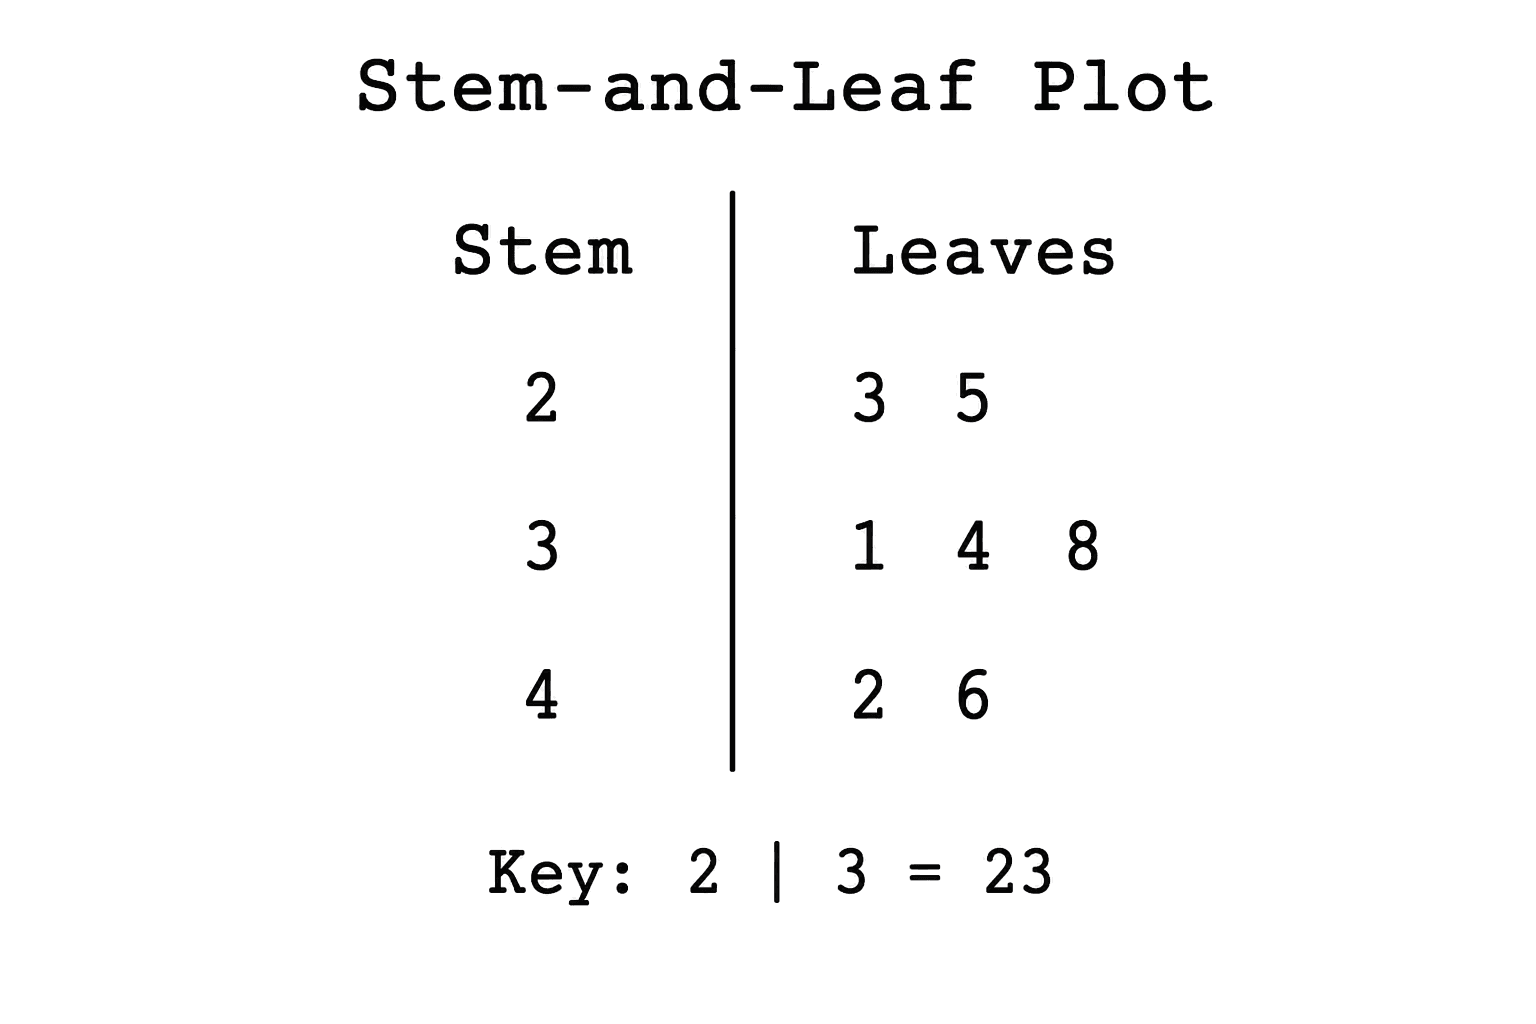
How to Make a Stem-and-Leaf Plot from CSV or Excel Data
Create a stem-and-leaf plot from CSV or Excel without coding. Choose a stem unit, keep a readable key, compare groups, and edit the figure in SciVis.