Blog
Latest news and updates from our team
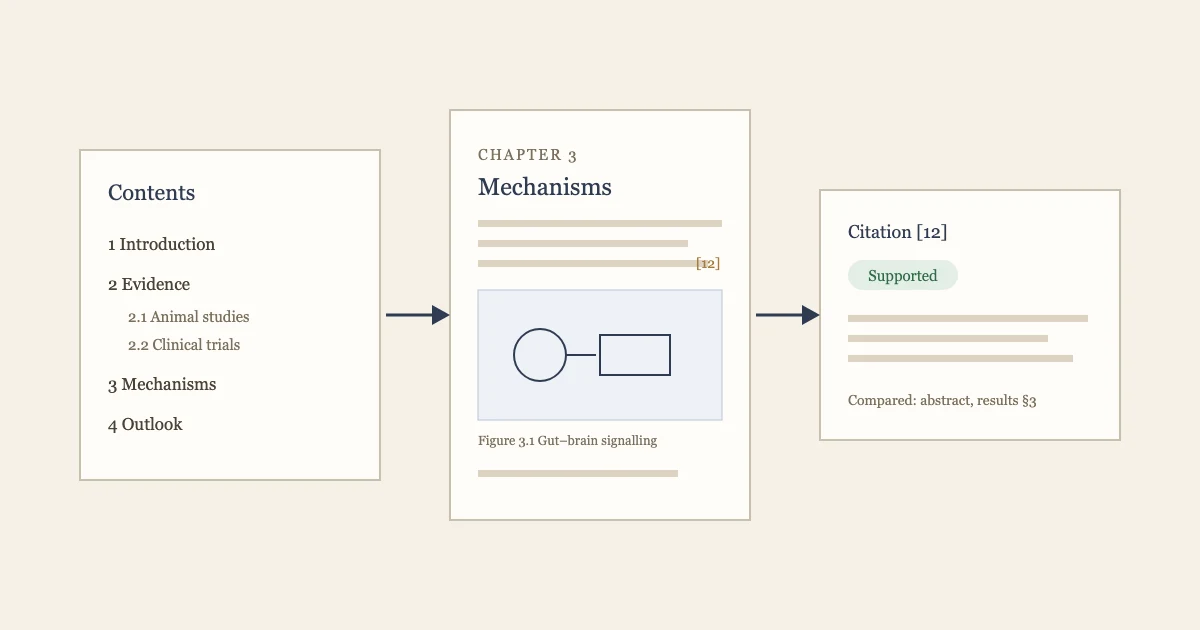
Built on the SciDraw AI API: How SciVolume Illustrates Whole Academic Books
SciVolume, an AI book writer for monographs and textbooks, generates every scientific figure in its books through our API. Here is how they use it, and how you can build the same kind of integration.

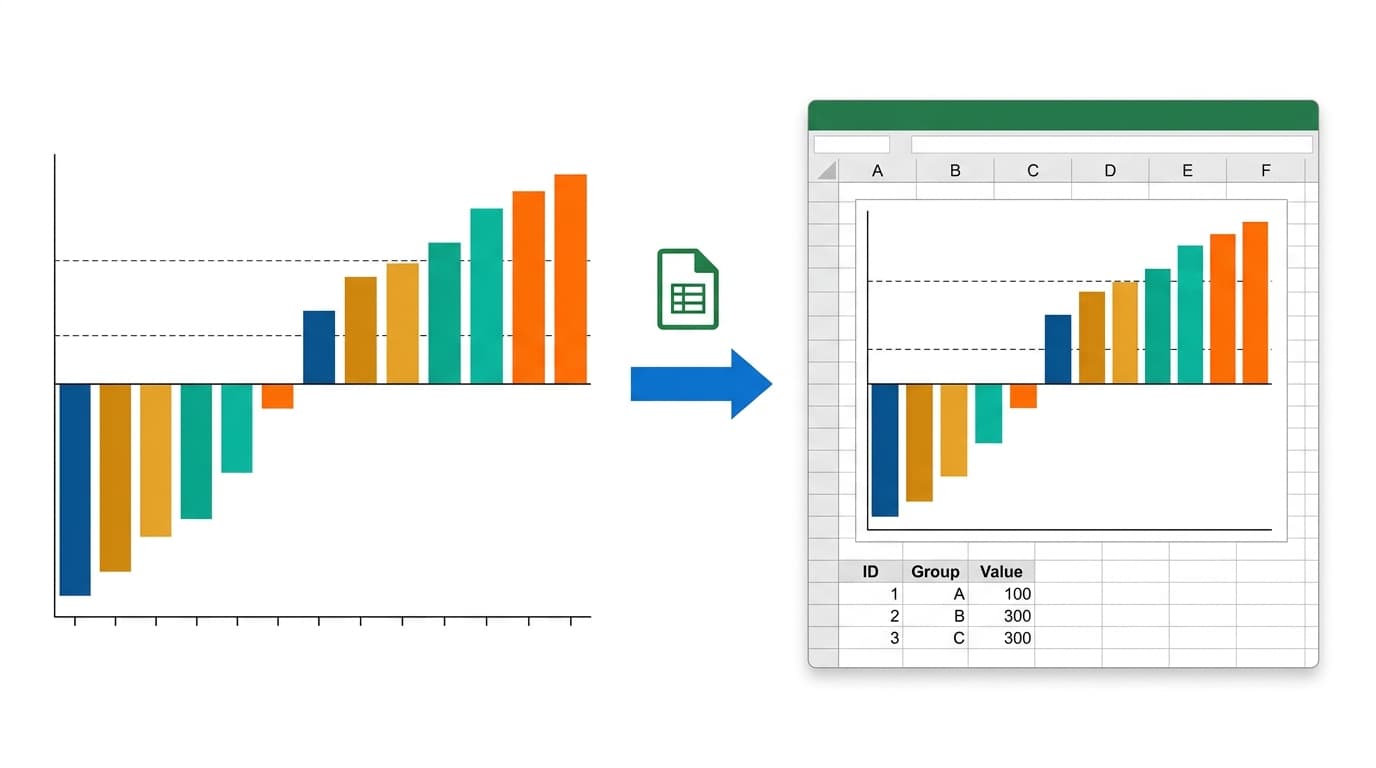
Export Any Scientific Chart to an Editable Excel File (.xlsx)
Turn AI-generated charts into native, editable Excel workbooks — chart, plotted data, and full source data in one .xlsx. Waterfall plots, volcano plots, ROC curves and 25+ more types.
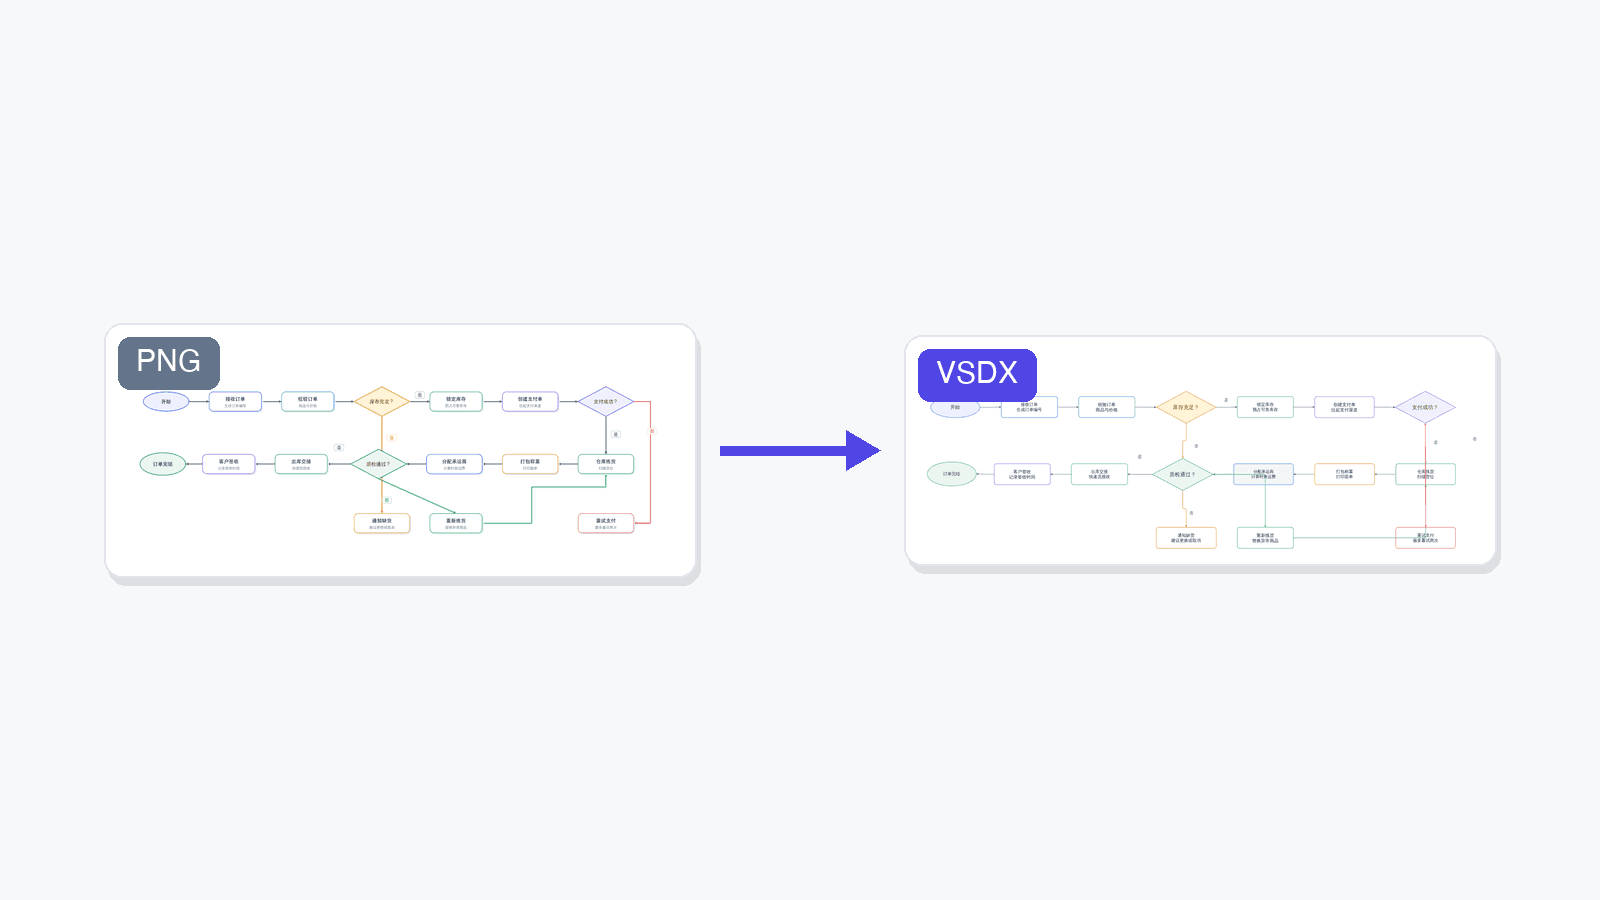
New: Convert Diagram Images to Editable Visio (VSDX) Files
SciDraw AI can now rebuild flowcharts and architecture diagrams as fully editable Microsoft Visio files — every shape, connector, and label becomes a native object you can move and edit. Powered by LayerBack.
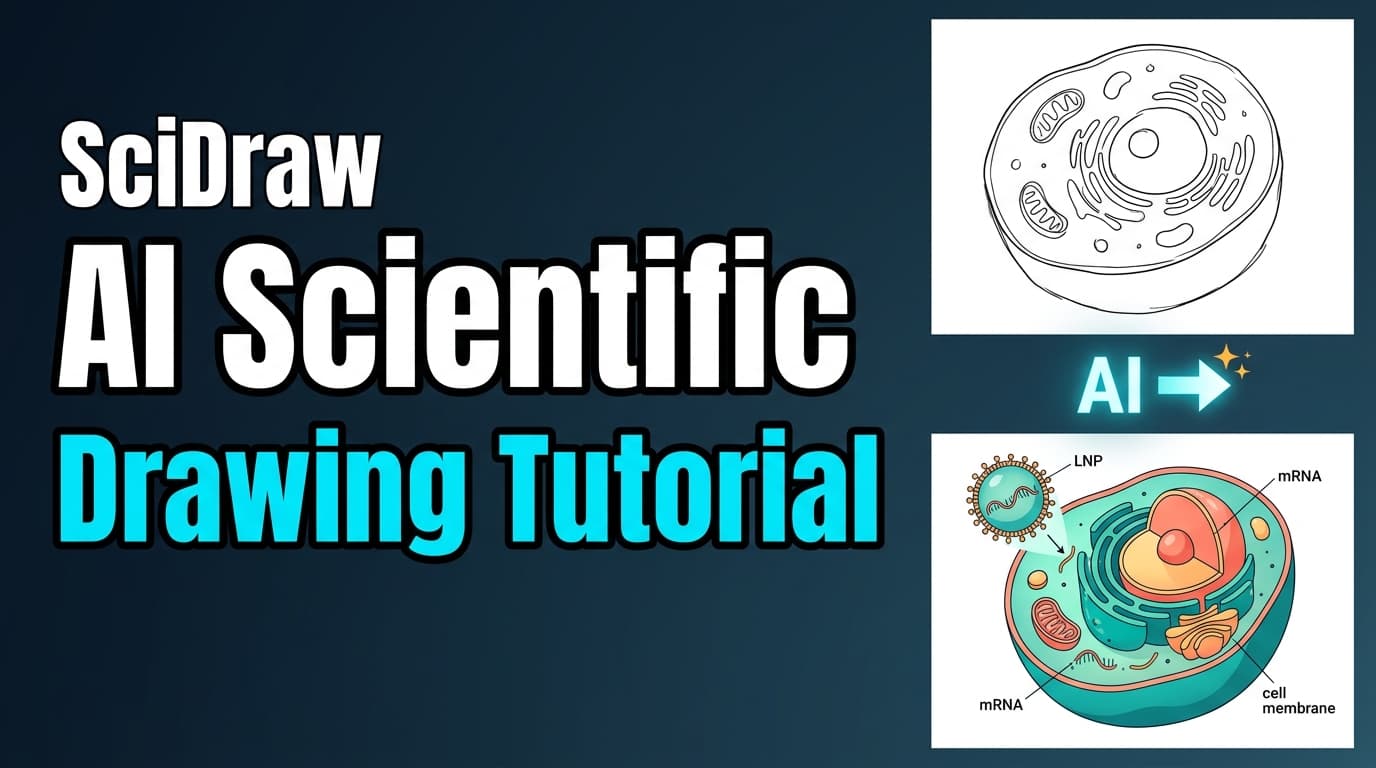
Tutorial 01: AI Drawing Video Tutorial - Create Scientific Illustrations in Minutes
Watch our 2-minute video tutorial to learn how SciDraw AI's AI Drawing feature works across 3 modes: Prompt, Sketch, and Replicate. Generate professional scientific figures with ease.
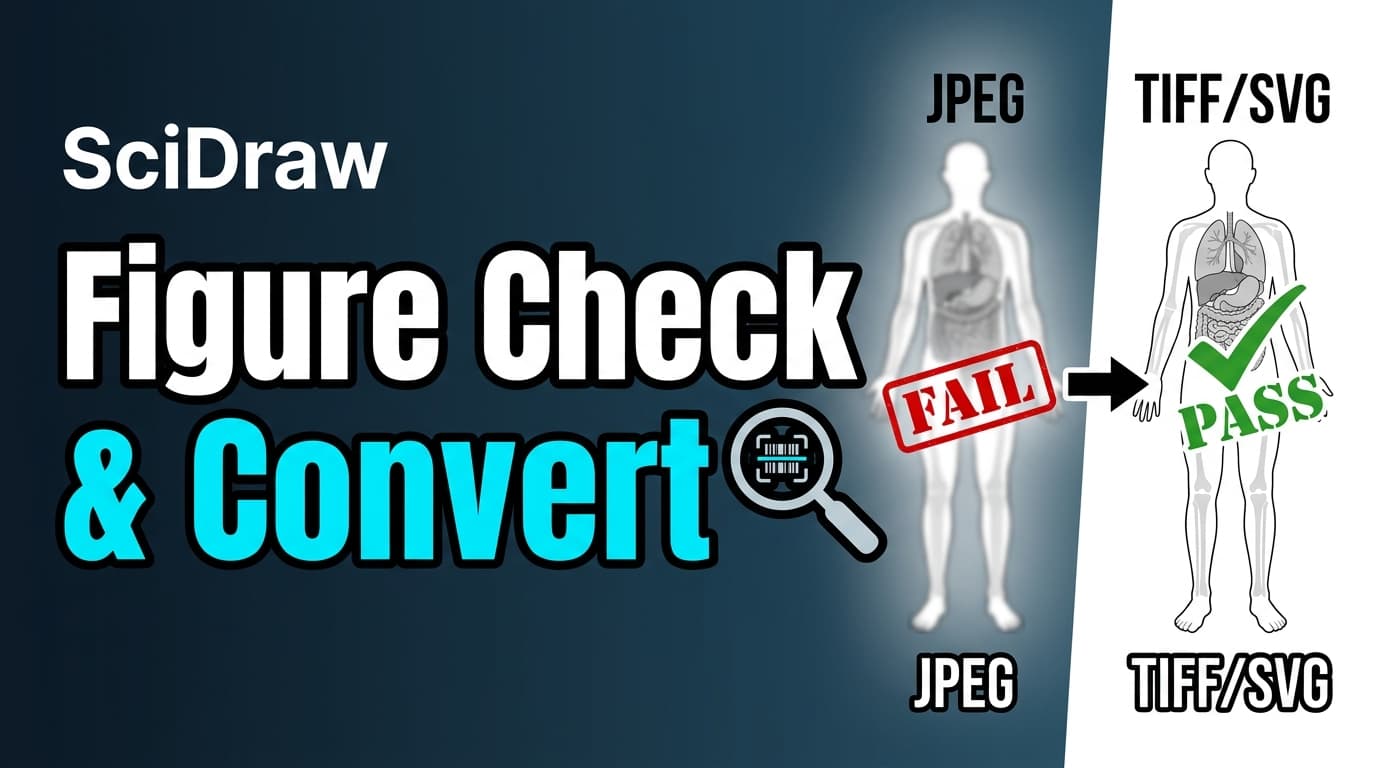
Tutorial: Figure Checker & Image Converter in 2 Minutes
Watch how to validate research figures for journal compliance and convert image formats with SciDraw AI's Figure Checker and Image Format Converter. Check DPI, format, grayscale, and colorblind safety in one click.
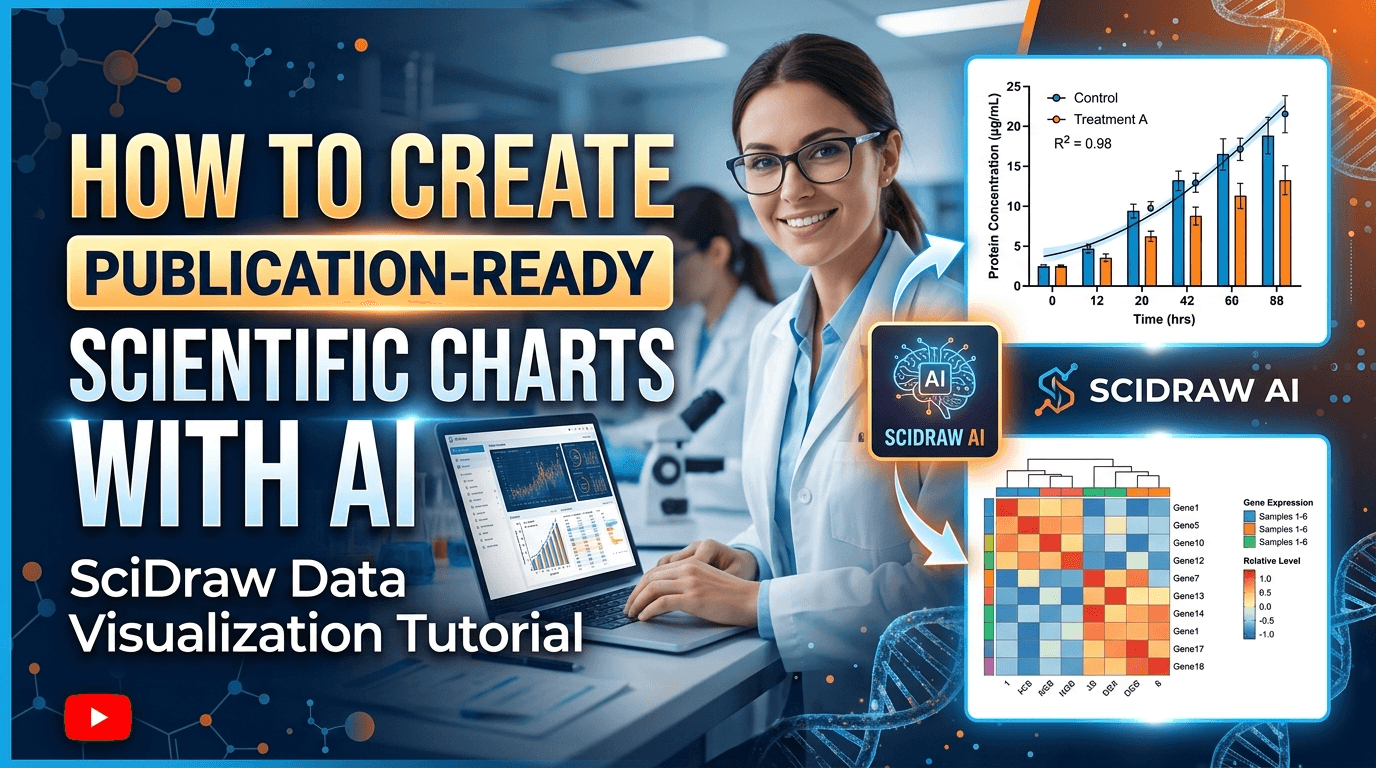
Tutorial 02: Scientific Visualization Video Tutorial - From CSV to Publication-Ready Charts
Watch this 2-minute video tutorial to learn how SciDraw AI's Scientific Visualization tool transforms your CSV data into journal-quality charts with AI-powered Python code generation, multi-format export, and iterative editing.