AI Research Flowchart & Workflow Diagram Generator
From experimental protocol to publication-ready flowchart
SciDraw AI turns your research methodology into clear, professional workflow diagrams — experimental pipelines, study designs, and technical roadmaps that reviewers and readers understand at a glance.
Workflow Diagram Examples
Browse examples from different research and lab workflows, or generate your own above.
What can this AI workflow diagram generator do?
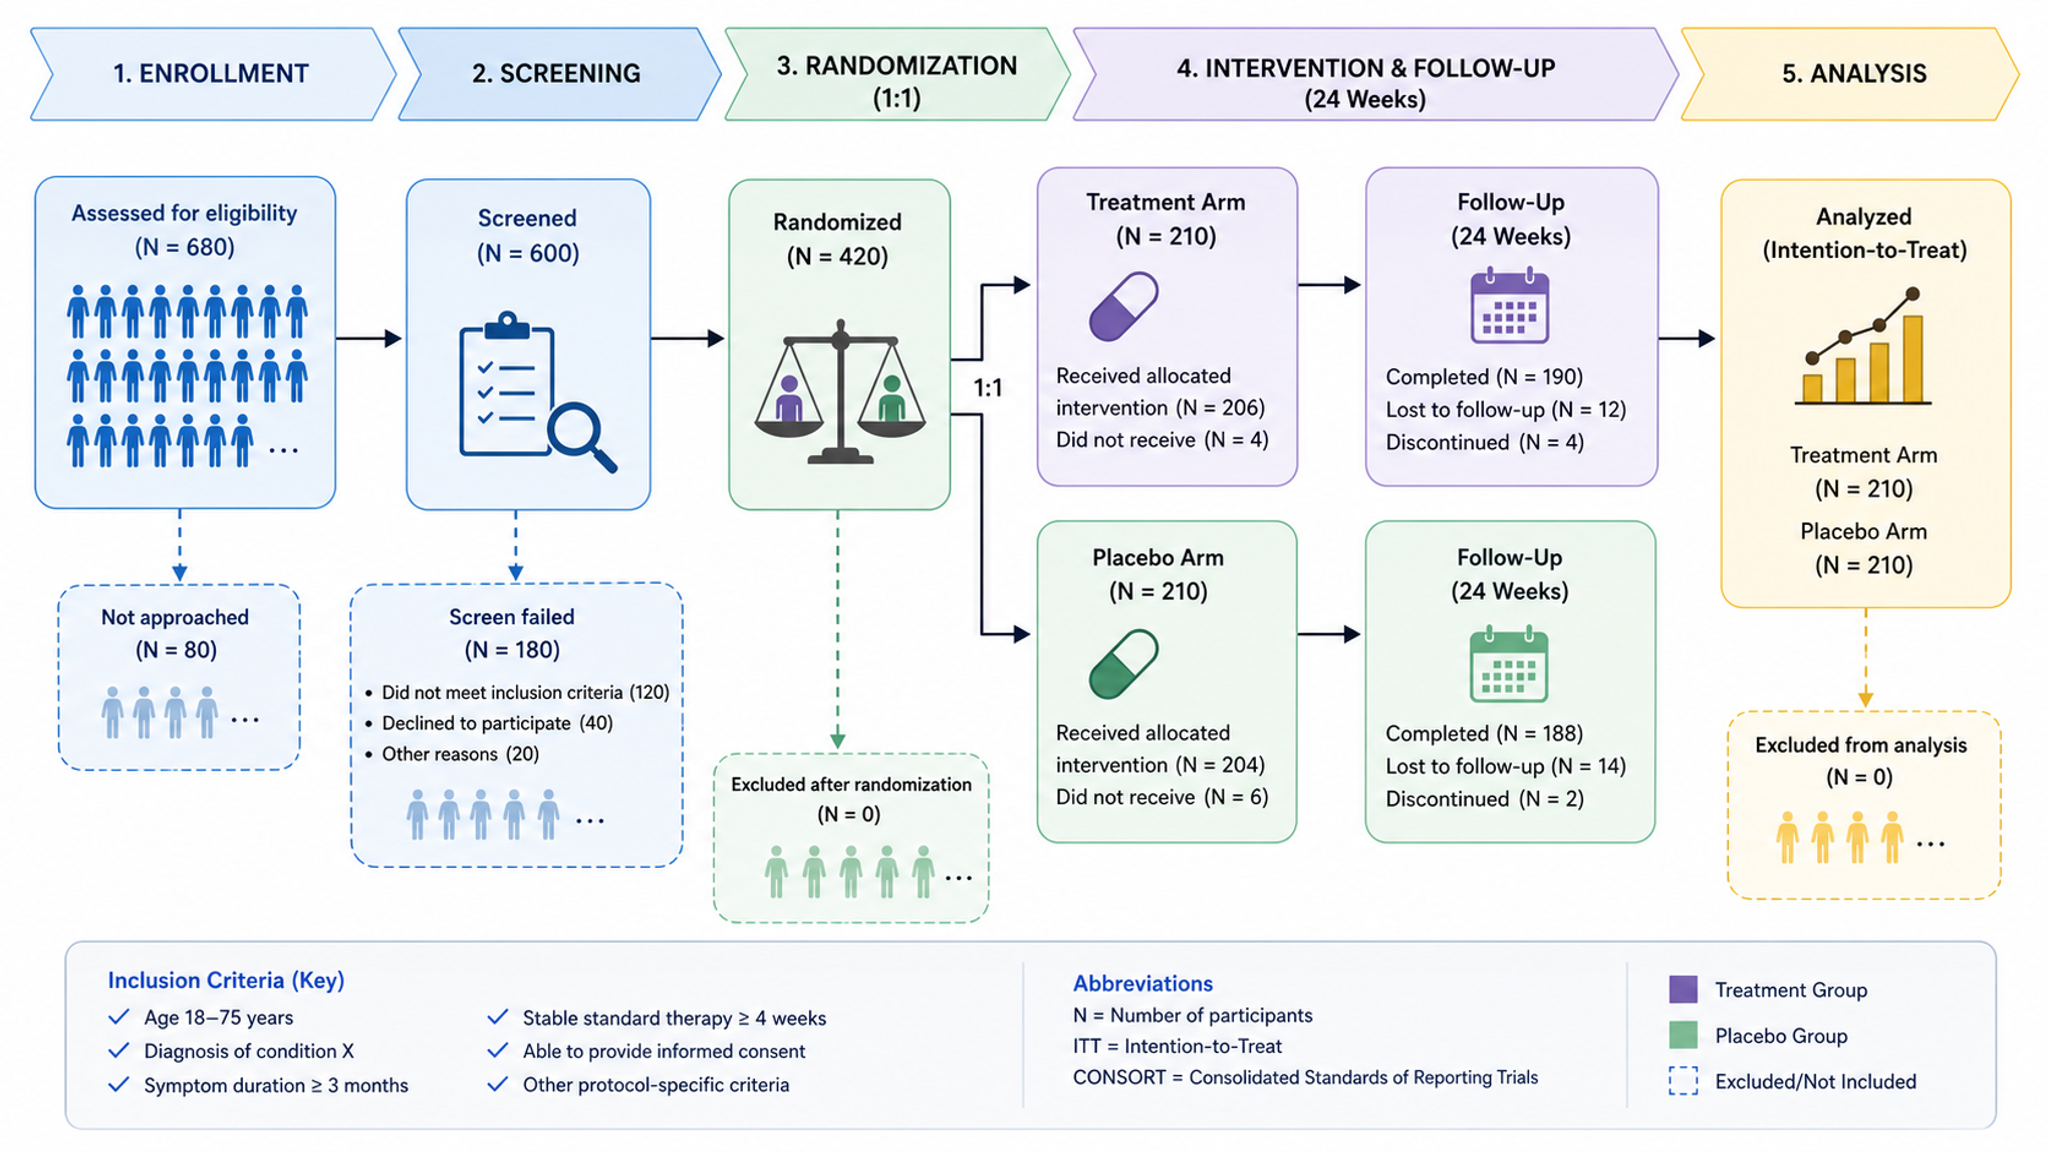
This AI workflow diagram generator — which doubles as an AI flowchart generator for research — turns an experimental protocol, methods section, or plain-text description into a clear, publication-ready flowchart. It identifies sequential stages, parallel tracks, decision branches, and feedback loops, then arranges them into a professional figure for methods sections, supplementary materials, grant proposals, and technical roadmaps. SciDraw AI understands research terminology across disciplines, from CONSORT trial design to RNA-seq pipelines and CRISPR protocols.
Why researchers need workflow diagrams
- Document experimental procedures so other labs can reproduce your methods
- Help reviewers and readers grasp complex protocols at a glance
- Satisfy reporting standards like CONSORT and PRISMA for trials and reviews
- Communicate study design and decision logic in grant proposals and roadmaps
- Replace cluttered text descriptions with a single, scannable visual
How to create an effective workflow diagram
An effective workflow diagram (or flowchart) follows a logical direction, keeps each step concise, and uses arrows to show order, branches, and feedback. Group related steps, mark decision points clearly, and label inputs and outputs so the flow reads without ambiguity. Describe your protocol in natural language and SciDraw AI generates a structured, journal-ready workflow diagram or flowchart that follows these conventions automatically — call it whichever your field prefers.
Common elements in workflow diagrams
- Process boxes representing each step or stage
- Directional arrows showing sequence and flow
- Decision nodes for conditional or branching logic
- Parallel tracks for simultaneous procedures
- Feedback loops connecting later stages back to earlier ones
- Clear labels for inputs, outputs, and sample counts
Frequently Asked Questions
What types of workflow diagrams can I create?
You can create experimental pipeline flowcharts, research methodology diagrams, clinical trial CONSORT flow diagrams, PRISMA review flowcharts, computational pipeline visualizations, lab protocol step-by-step figures, and multi-stage study design diagrams. Both linear and branching layouts are supported.
Can I use these workflow diagrams in journal papers?
Yes. All exports are 300+ DPI and meet the figure quality standards of major publishers including Elsevier, Springer Nature, Wiley, and MDPI. SVG and PDF formats ensure lossless scaling for any journal requirement.
Does SciDraw AI understand scientific methodology terminology?
Yes. SciDraw AI recognizes terms like sample preparation, centrifugation, PCR amplification, data normalization, statistical analysis, randomization, blinding, and hundreds of discipline-specific workflow steps. Simply describe your protocol in natural language.
Can I show parallel processes and decision branches?
Absolutely. The generator supports parallel tracks, conditional branches, merge points, feedback loops, and decision nodes. You can visualize complex experimental designs with multiple simultaneous procedures.
How do I customize colors and styling?
Choose from preset color schemes or customize individual step colors, connector styles, fonts, and background. You can match your institution branding or journal figure style guidelines.
Can I generate a workflow diagram from my methods section text?
Yes. Paste your methods section or protocol description, and SciDraw AI will extract the key steps, decision points, and flow logic to automatically generate a structured workflow diagram. You can then refine the layout and labels.
Can I use this as an AI flowchart generator?
Yes — a workflow diagram is a type of flowchart, so this works as an AI flowchart generator for research and lab processes. Describe your steps, decisions, and branches in plain language (or paste your methods section) and the AI draws a clean flowchart with process boxes, decision nodes, and directional arrows. It's the same tool used for experimental flowcharts, protocol flowcharts, and study-design flowcharts, exported as editable SVG, PNG, or PDF.
What is the difference between a flowchart and a workflow diagram?
A flowchart is a general diagram of any sequence of steps and decisions, while a workflow diagram is a flowchart focused specifically on how work moves through a process — who or what acts at each stage, the inputs and outputs, and parallel or feedback paths. In research, the terms overlap heavily: an experimental flowchart and an experimental workflow diagram usually mean the same figure. SciDraw AI generates both from a plain-text description, so you can call it whichever your field prefers.
Is there a free AI tool to generate experimental flowcharts?
Yes. SciDraw AI gives new users 10 credits on signup plus 5 free credits every day, with no watermark and SVG export included. For higher volume, paid plans start at $20/month and Lifetime is a one-time $1,999.
Can I edit the figure or export it as SVG or PowerPoint?
Yes. Download the result as a high-resolution PNG, or click Open in editor to keep refining it. From the editor you can convert it to an SVG vector file (10–15 credits), a PowerPoint PPTX file (10 credits) or a Visio file (20 credits).
How accurate are the generated figures?
The AI draws and labels what you describe, but it does not check the science for you. Review every label, arrow and value before you use the figure, then fix anything that is off by refining your description and regenerating, or by adjusting it in the editor.
Explore More Tools
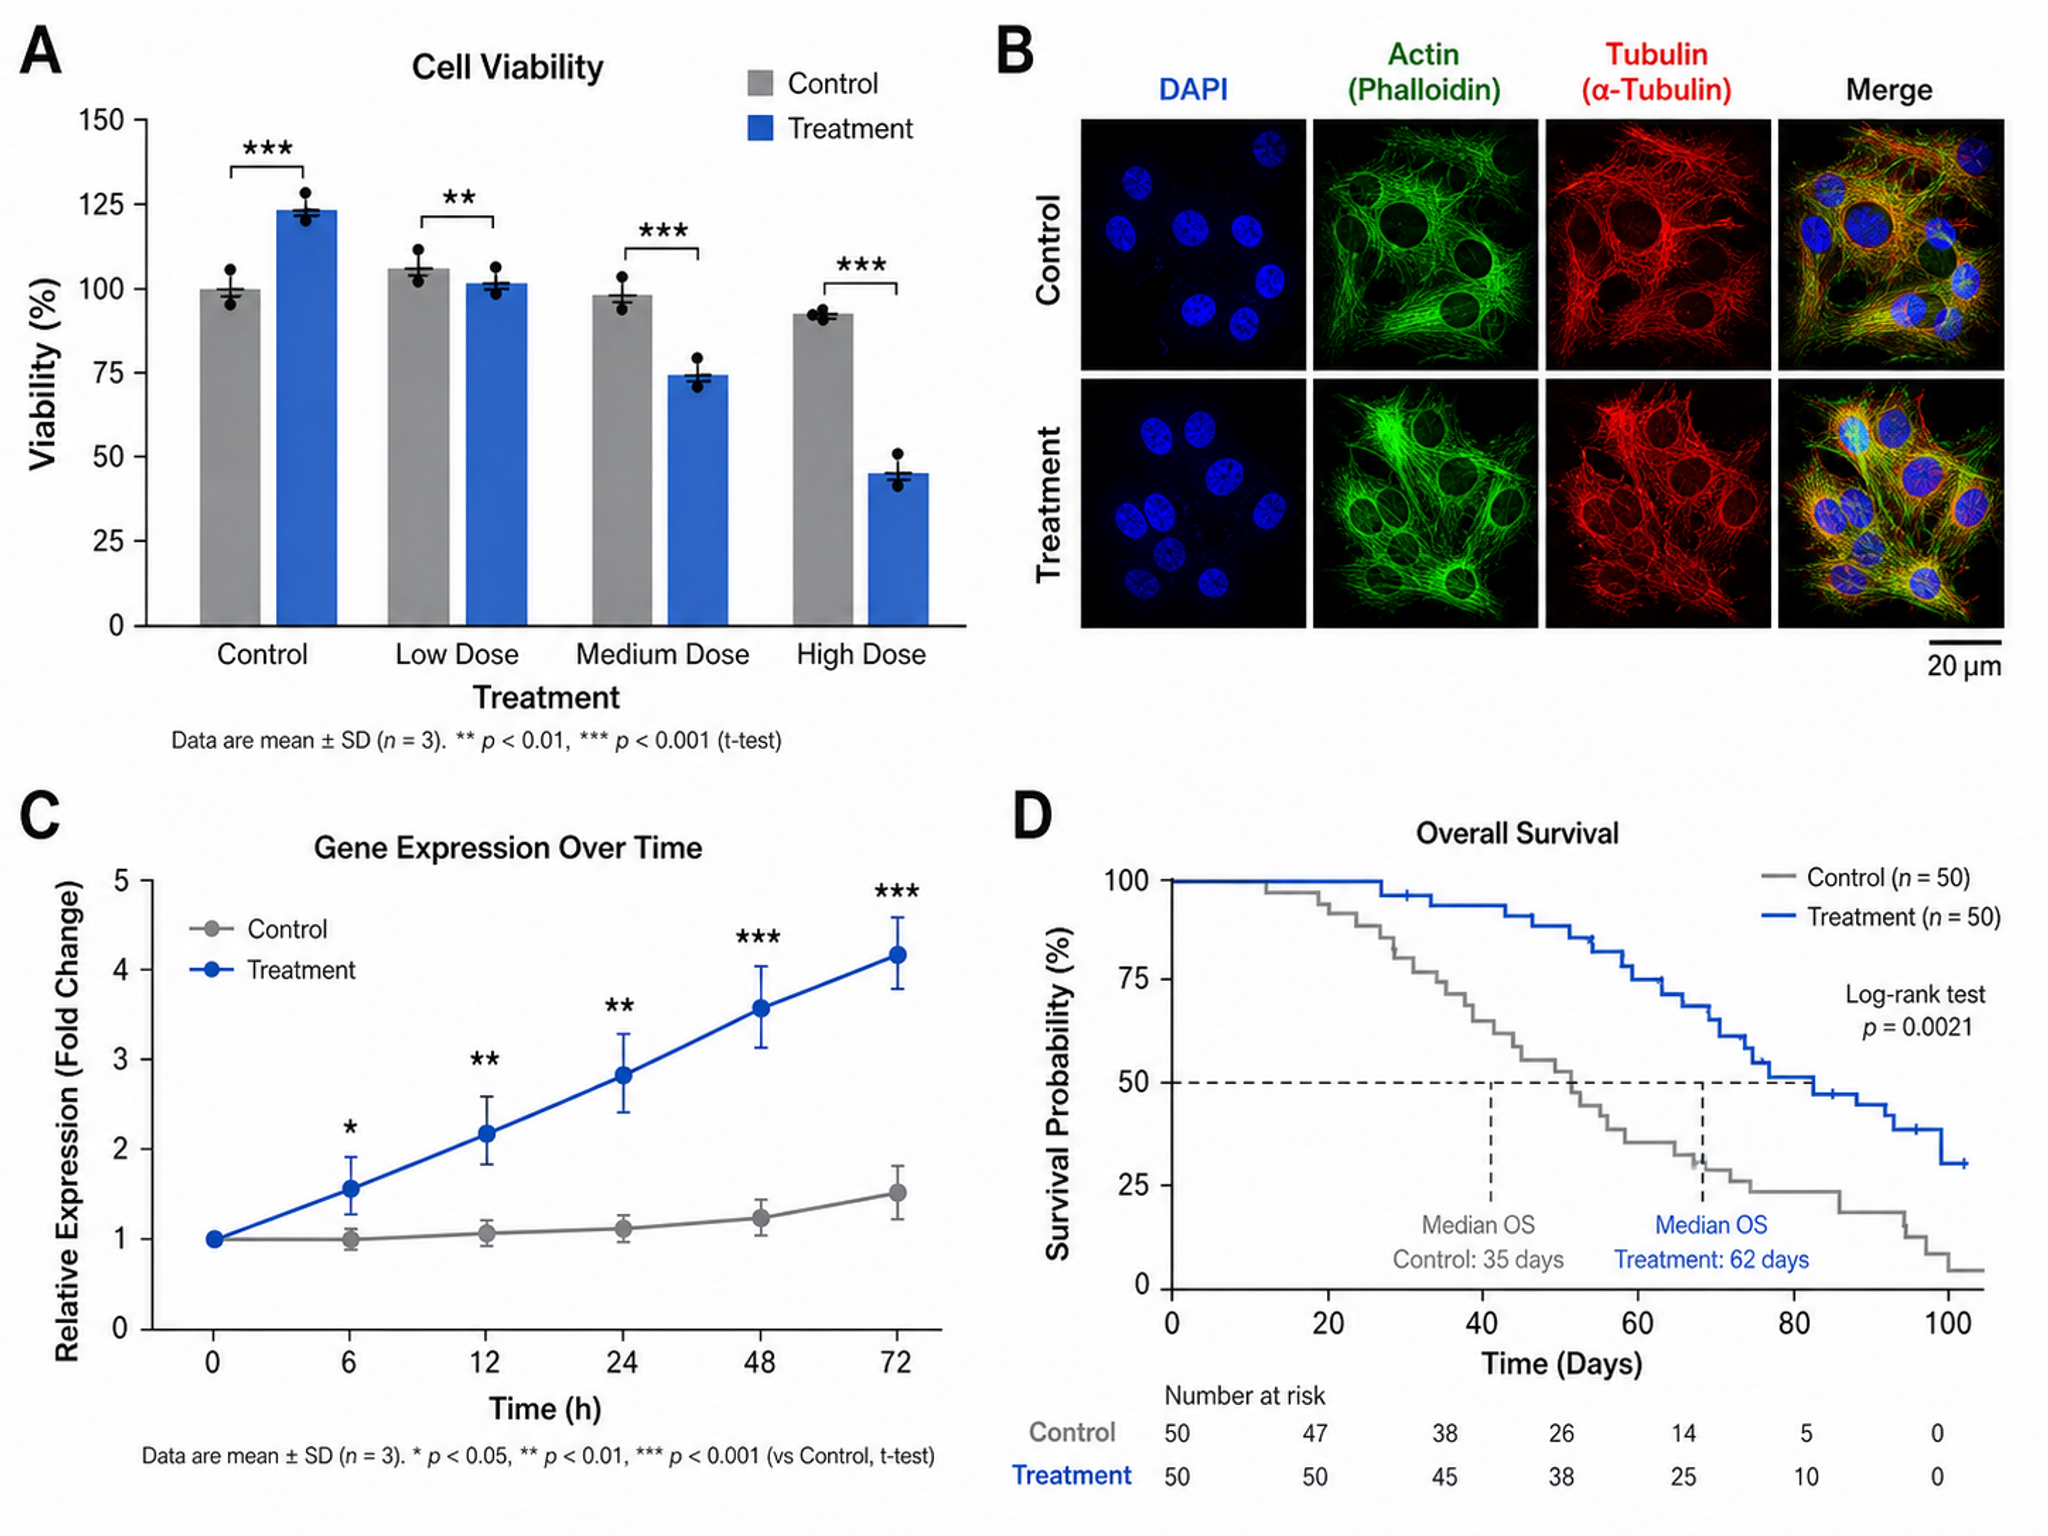
Scientific Figure Maker
Create publication-ready figures for research papers
Try it free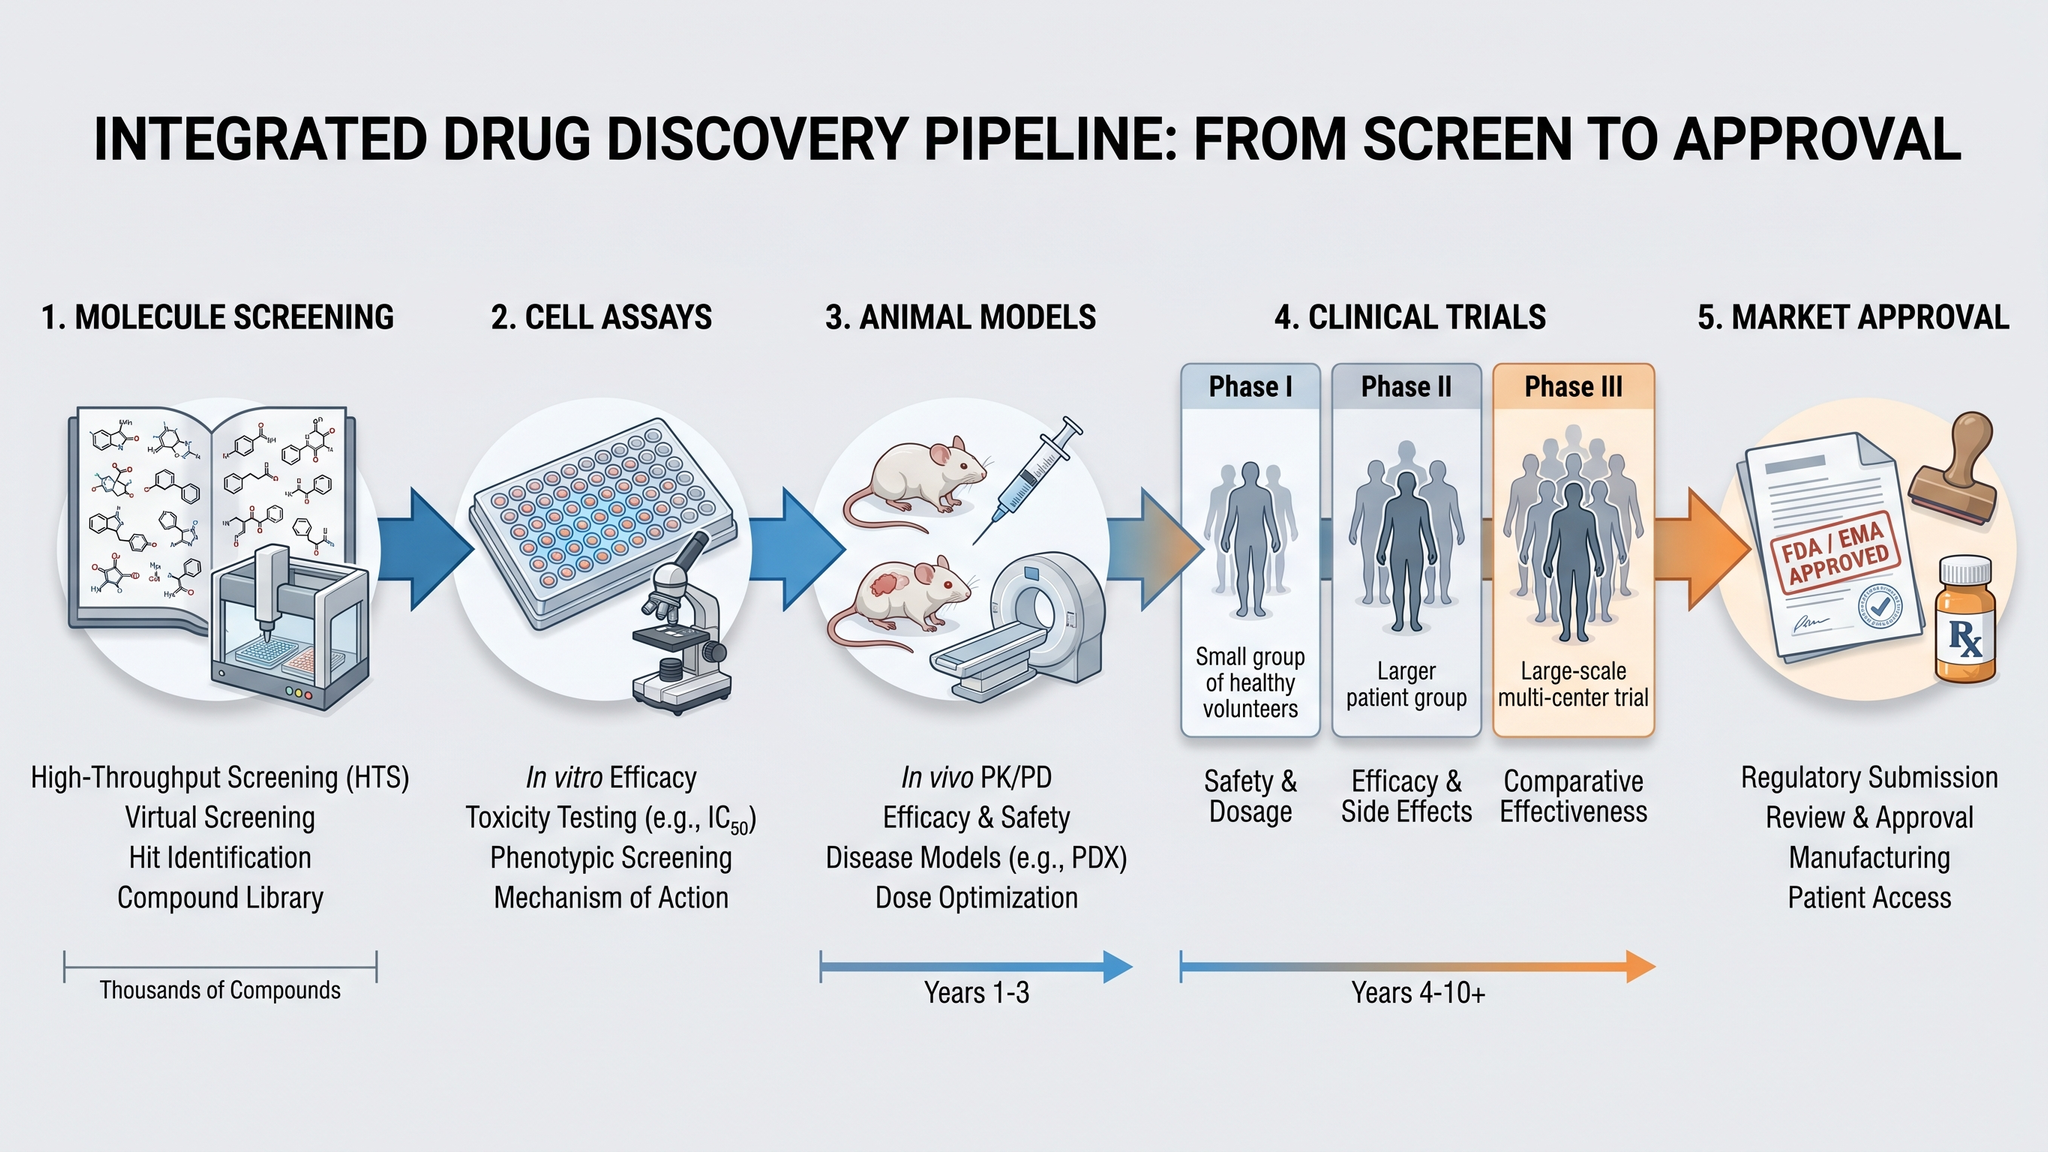
Graphical Abstract Maker
Create stunning graphical abstracts for journal submissions
Try it free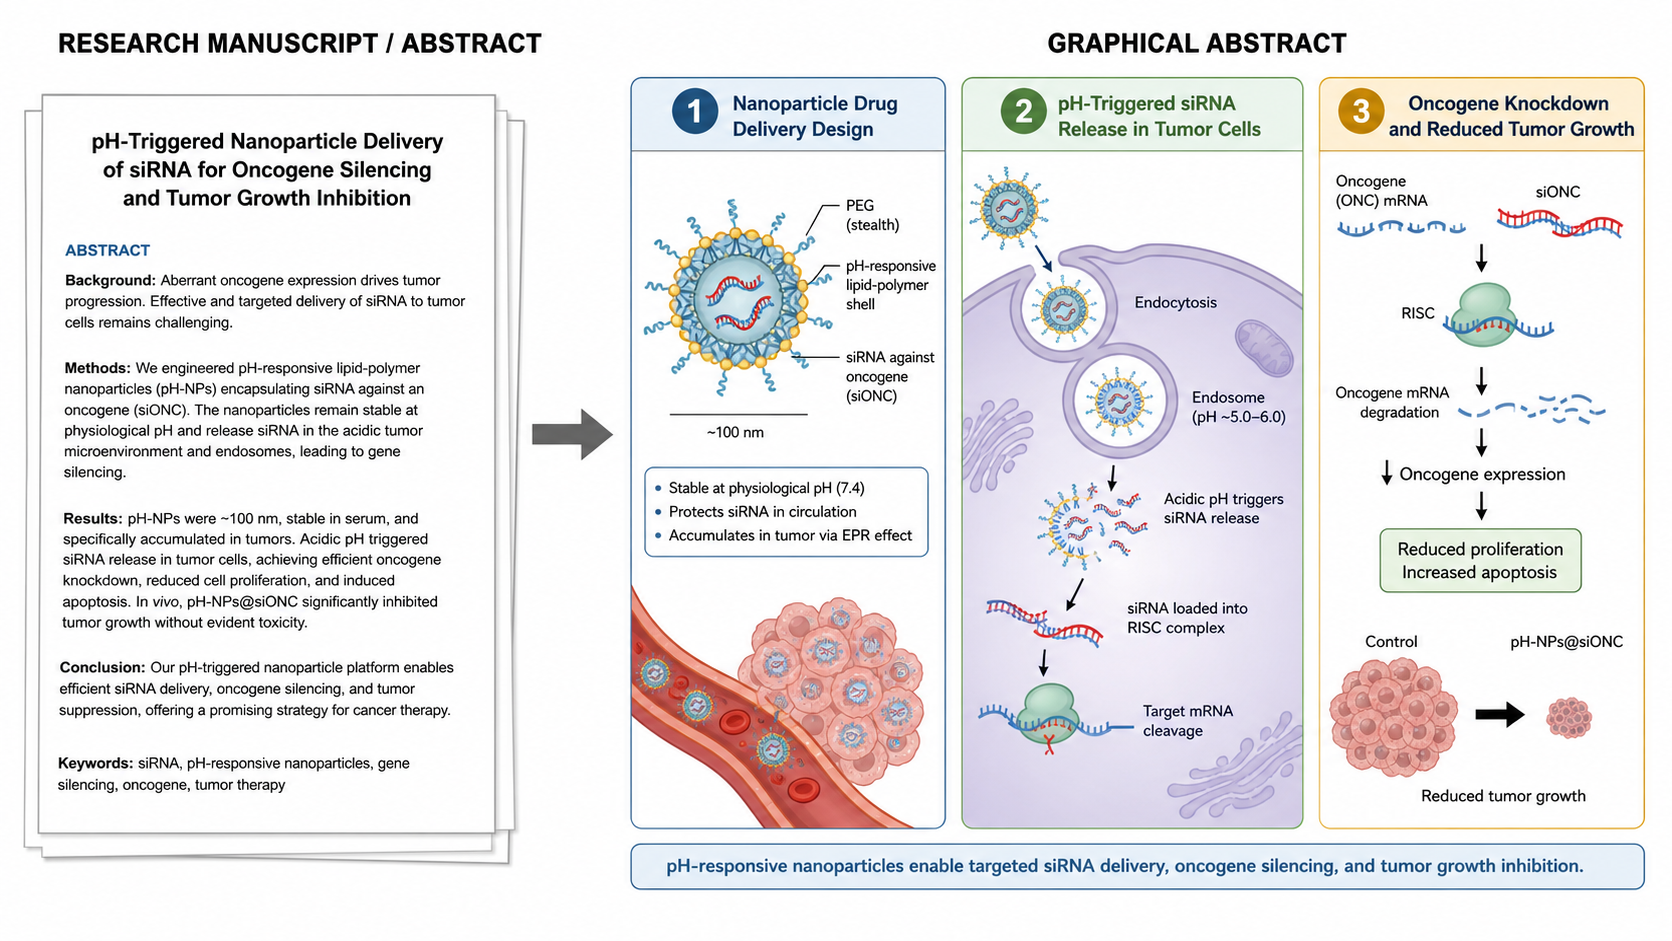
Manuscript to Figure Generator
Create manuscript to figure visuals for abstracts, methods, results, study workflows, graphical abstracts, and multi-panel paper figures.
Try it freeCreate your workflow diagram now
Join thousands of researchers who use SciDraw AI to visualize their experimental methods and research workflows.