Free AI Biological Pathway Generator
Signaling cascades and metabolic pathways for papers and teaching
SciDraw AI turns pathway descriptions into clean, readable biological pathway diagrams - receptors, kinases, transcription factors, metabolites, gene regulation, immune signaling, and cellular outcomes in one publication-ready figure.
Biological Pathway Examples
Browse pathway diagrams across signaling and metabolism, or generate your own above.
What is a biological pathway diagram?
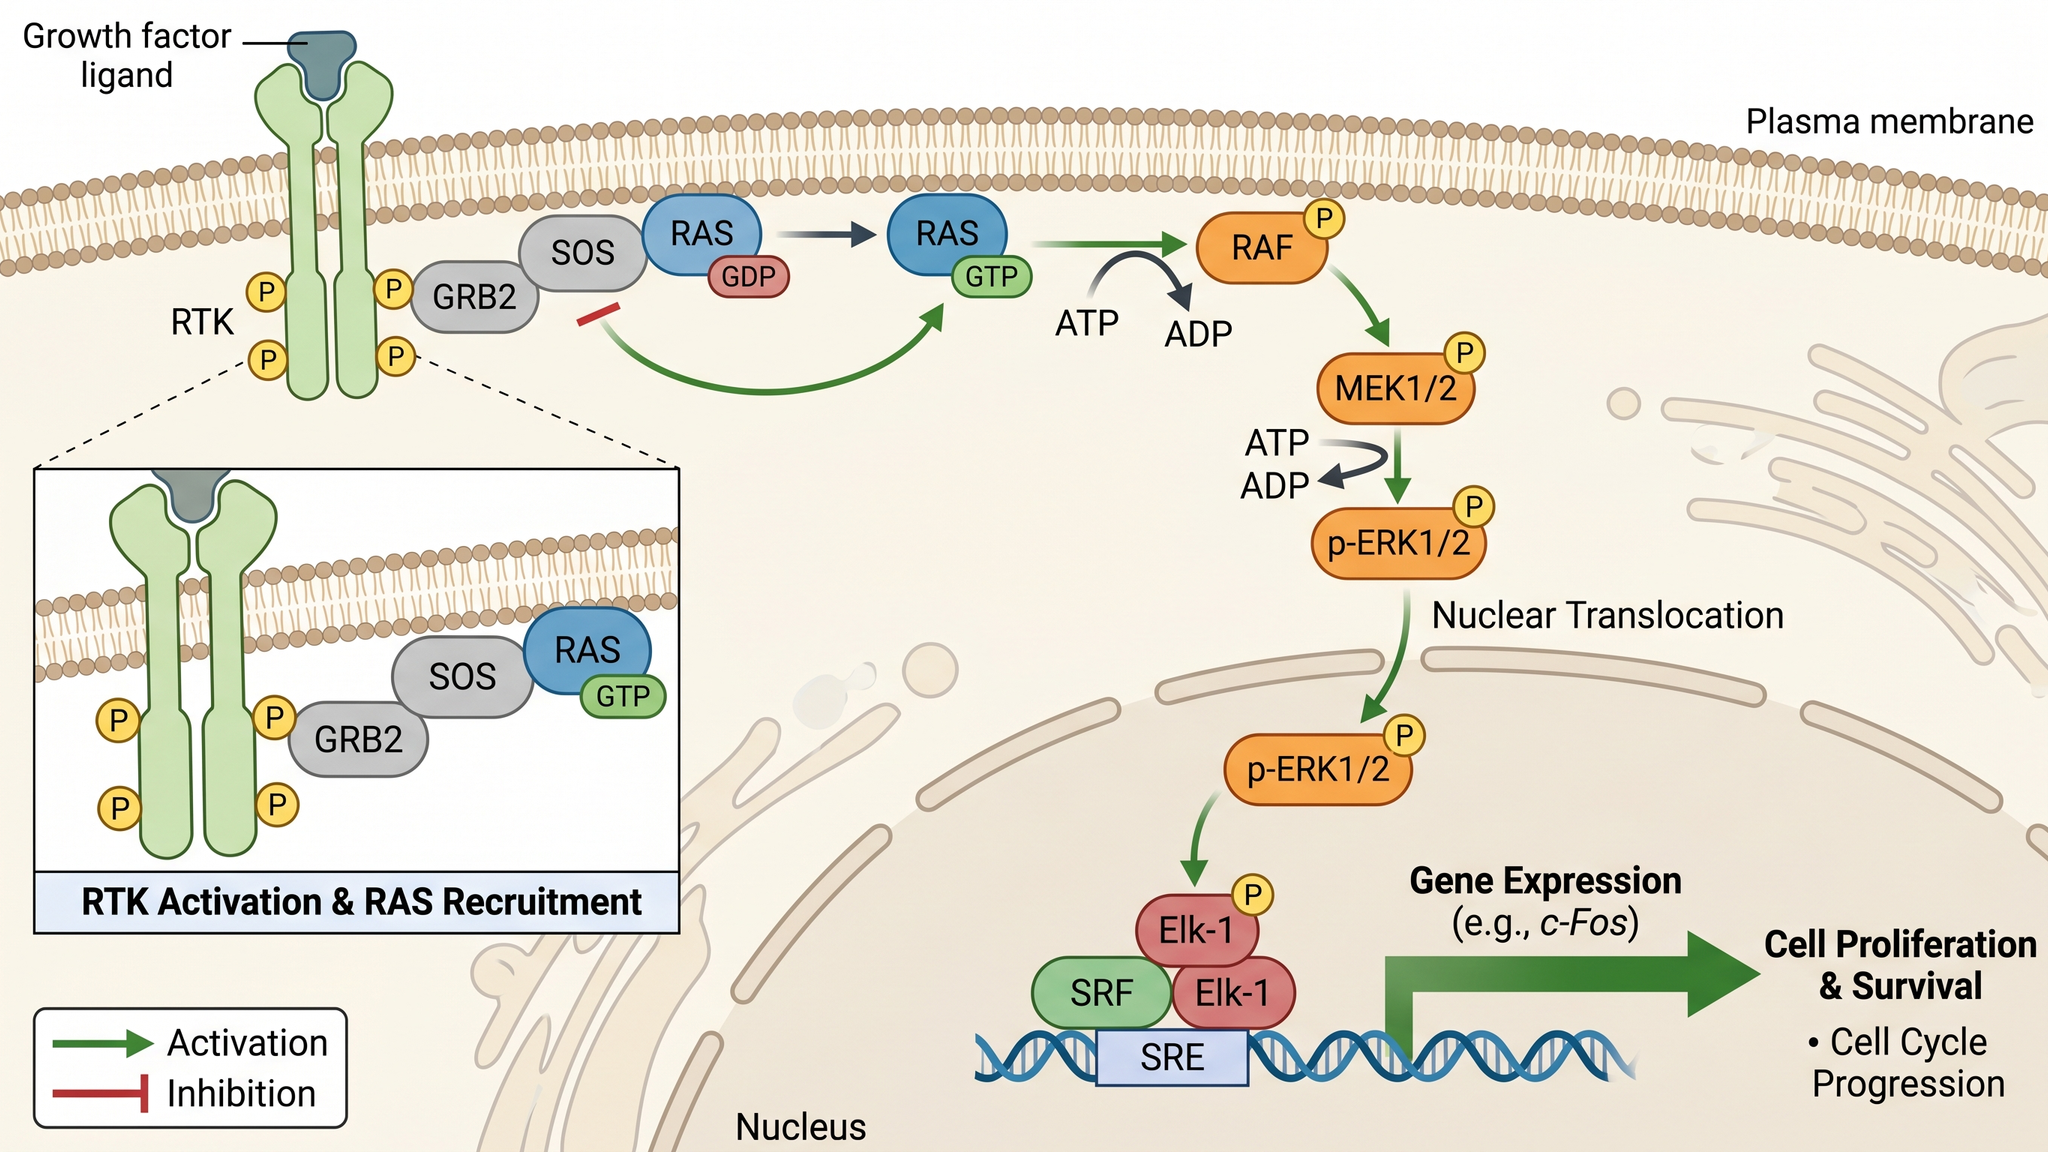
A biological pathway diagram is a node-and-arrow figure that shows how molecules interact inside a cell. A signaling pathway diagram (also called a cell signaling diagram or signal transduction diagram) follows a signal from a receptor through kinases to a transcription factor and an outcome. A metabolic pathway diagram, or biochemical pathway diagram, traces how substrates are converted into products by enzymes. This tool draws and labels both types from the description you provide, laying out nodes, activation arrows, and inhibition bars into one clean pathway figure for papers and slides.
Why researchers use pathway diagrams
- Communicate a complex molecular mechanism at a glance
- Show activation, inhibition, and feedback relationships clearly
- Link signaling events to genes, drugs, metabolites, and cellular outcomes
- Support manuscripts, review articles, grant applications, and posters
- Make signaling and metabolic pathway logic accessible to students
How to draw a pathway diagram
To draw a signaling pathway, list the components in order, from the input receptor or ligand through the intermediates to the final phenotype or gene target. Mark which steps activate, inhibit, phosphorylate, translocate, or feed back, and group nodes into compartments such as membrane, cytoplasm, mitochondria, and nucleus. For a metabolic pathway map, name each substrate, enzyme, and product along the chain. Paste this description into SciDraw AI and it lays out the nodes, activation arrows, and inhibition bars and labels them, then exports an editable pathway figure you can refine before submission.
Parts of a pathway diagram
- Molecules, proteins, genes, and metabolites drawn as nodes
- Activation arrows showing the direction of signaling
- Inhibition bars (blunt-end lines) marking suppression
- Cellular compartments and the membrane, receptors, and ligands
- Labels and annotations for each node and relationship
- A legend explaining arrow types, colors, and abbreviations
Frequently Asked Questions
What is a biological pathway diagram?
A biological pathway diagram is a visual map of how molecular components interact in a cell, such as a signaling cascade or a metabolic pathway. It shows the order of events, activation and inhibition relationships, cellular compartments, and the final outcome, so readers grasp a mechanism at a glance.
How do I make a signaling pathway diagram online?
Describe the pathway in plain text: name the receptor, ligands, kinases, transcription factors, and outcome, and say which steps activate or inhibit. SciDraw AI then draws and labels the nodes, activation arrows, and inhibition bars into a complete signaling pathway diagram online, with no drawing software to install.
What is the difference between a signaling and a metabolic pathway diagram?
A signaling pathway diagram (or signal transduction diagram) traces information flow, how a receptor relays a signal through proteins to change gene expression or behavior. A metabolic pathway diagram, or biochemical pathway diagram, traces matter, how substrates are converted into products by enzymes. SciDraw AI can draw either from your description.
Are the pathway figures publication-ready for papers?
Yes. SciDraw AI lays out clean nodes, arrows, and inhibition bars and exports high-resolution figures suitable for manuscripts, reviews, grants, and posters. You provide the pathway content, so always verify the protein and gene names, arrows, and biological relationships before submission.
Is the pathway diagram generator free?
Yes. New accounts get 10 credits on signup and 5 more free credits each day, and a standard 2K diagram costs 5 credits — enough to draw a pathway diagram every day without paying. Paid plans add a monthly credit allowance when you need to produce many figures at once.
Can I edit and customize the pathway after it is drawn?
Yes. SciDraw AI generates an editable pathway diagram, and you can export SVG and high-resolution PNG or PDF. Adjust node labels, colors, arrow types, and layout in tools like Adobe Illustrator or Inkscape before final submission.
Explore More Tools
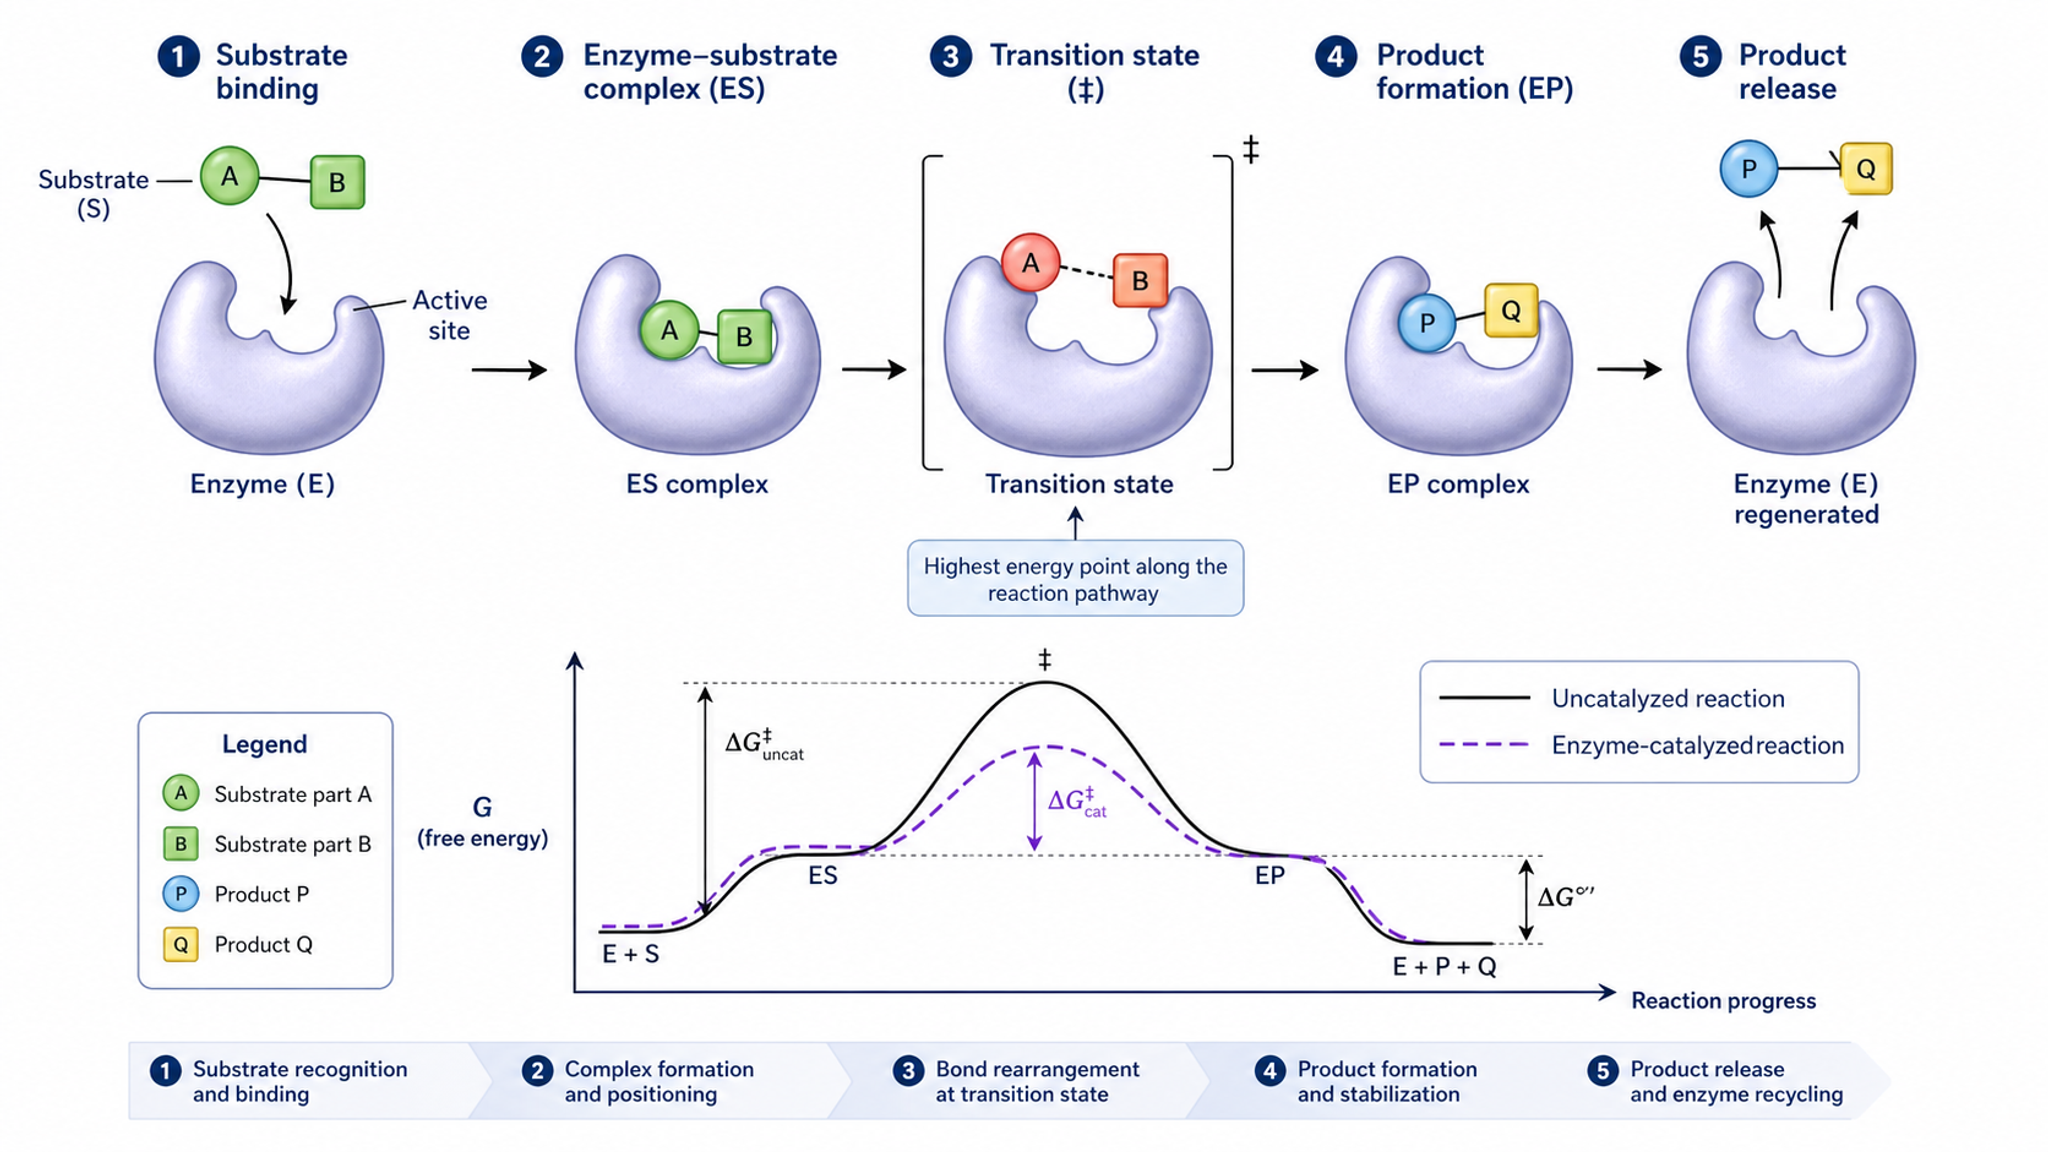
Mechanism Figure Generator
Create signaling pathway and molecular mechanism illustrations
Try it free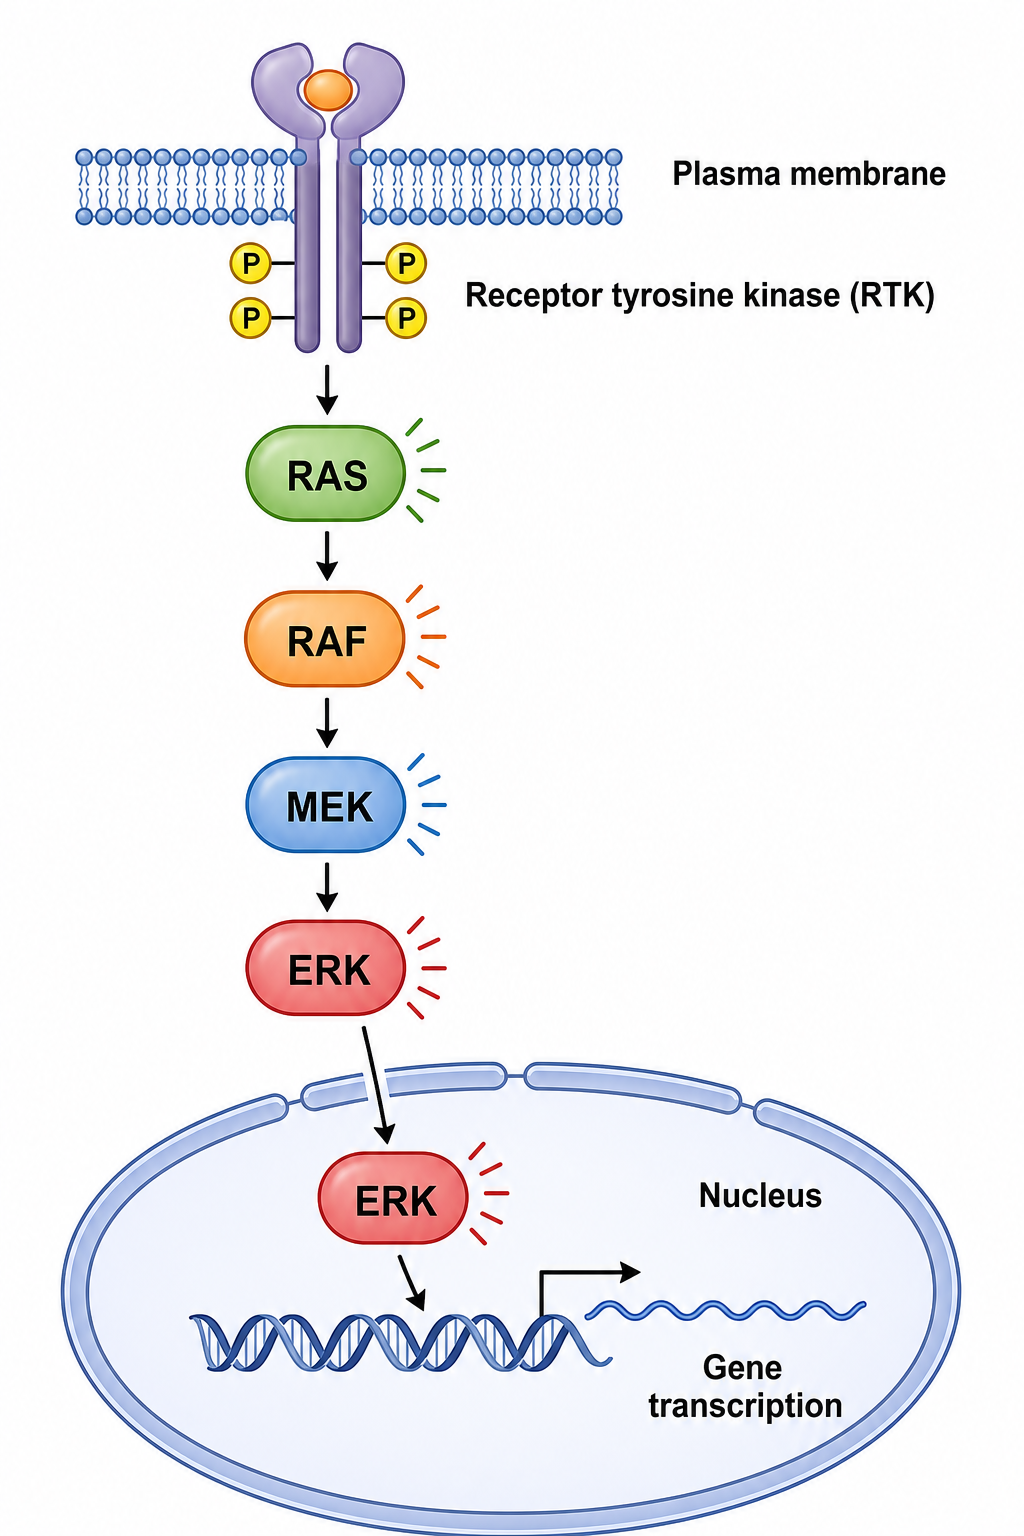
Signaling Pathway Diagram Generator
Draw labeled signaling cascades — MAPK, PI3K-AKT, Wnt, NF-κB, JAK-STAT, and TGF-β.
Try it free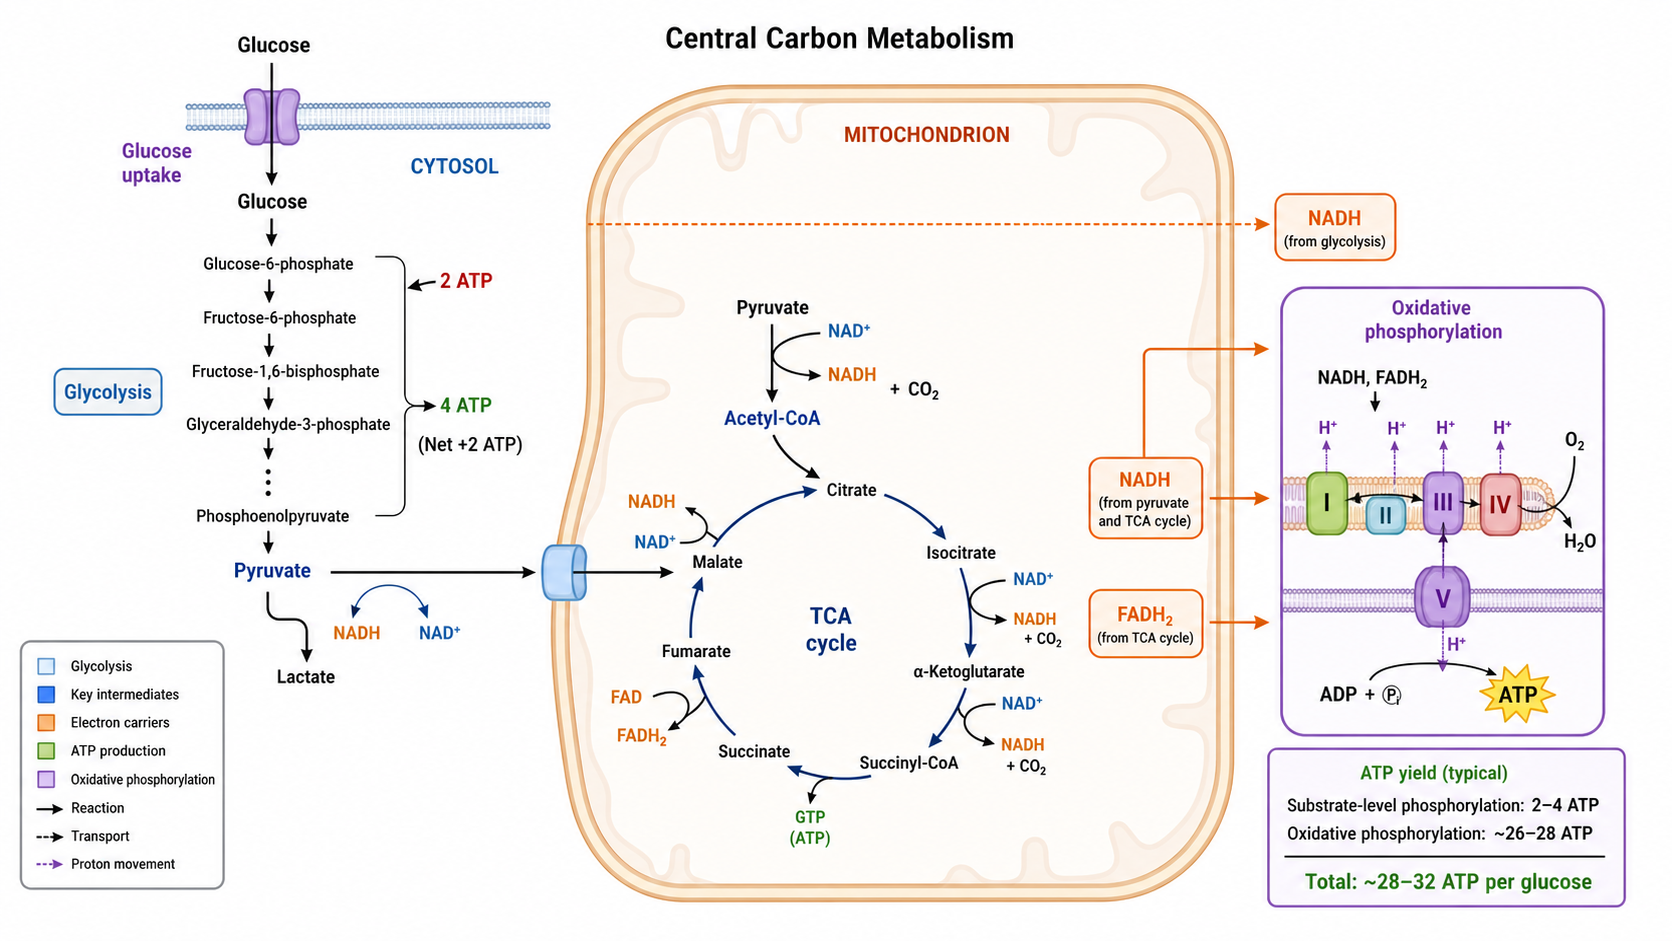
Metabolic Pathway Diagram Generator
Create metabolic pathway diagram visuals for central carbon metabolism, glycolysis, TCA links, flux arrows, compartments, and energy outputs.
Try it freeReady to Create Your Biological Pathway Diagram?
Describe your pathway components and signal flow, then export a publication-ready figure in minutes with SciDraw AI.