Blog
Ultime notizie e aggiornamenti dal nostro team
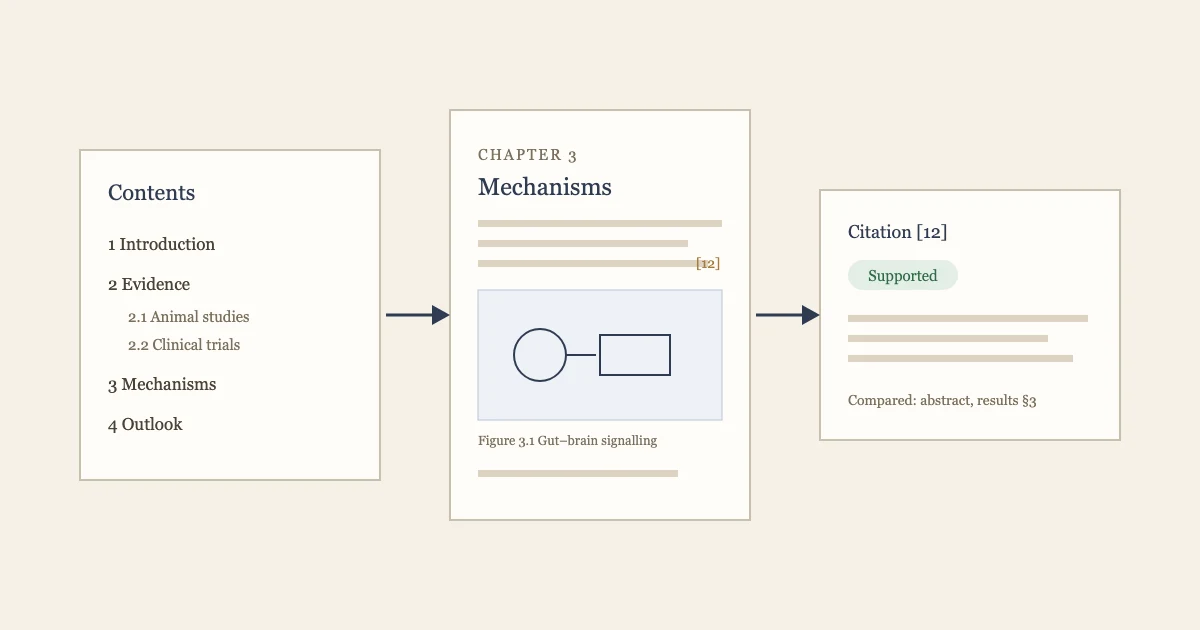
Built on the SciDraw AI API: How SciVolume Illustrates Whole Academic Books
SciVolume, an AI book writer for monographs and textbooks, generates every scientific figure in its books through our API. Here is how they use it, and how you can build the same kind of integration.

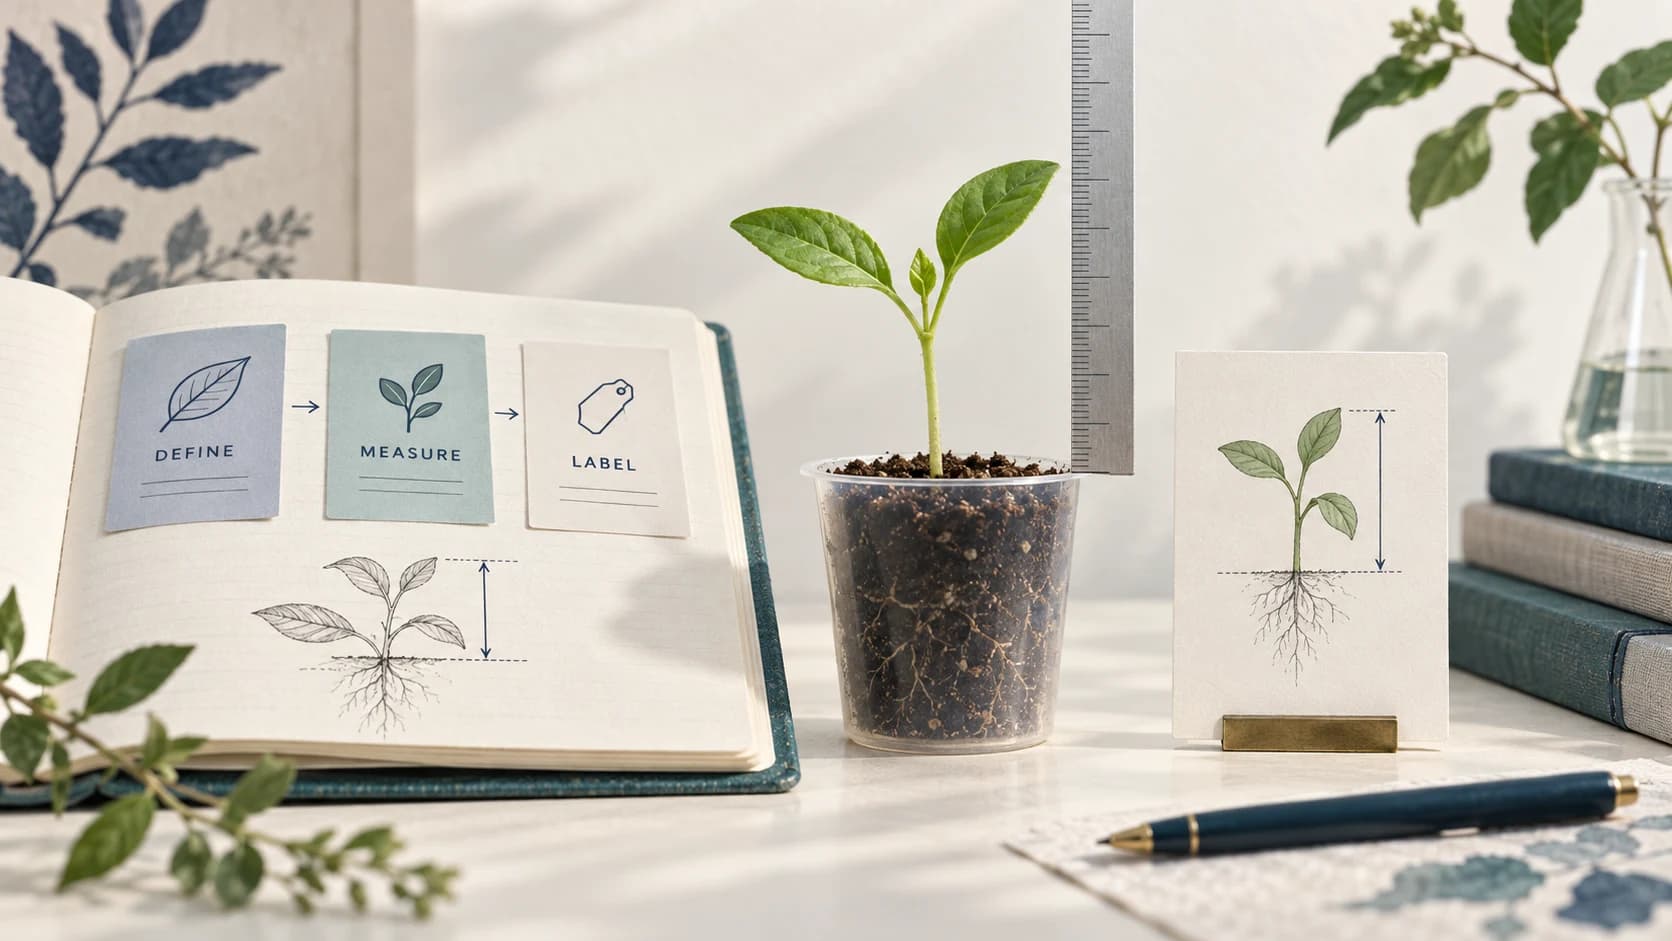
Definizione operativa: esempi e tabella per la tesi
Dal concetto all’indicatore: come scrivere una definizione operativa nella tesi, con esempi, una tabella riutilizzabile e indicazioni per figure coerenti.
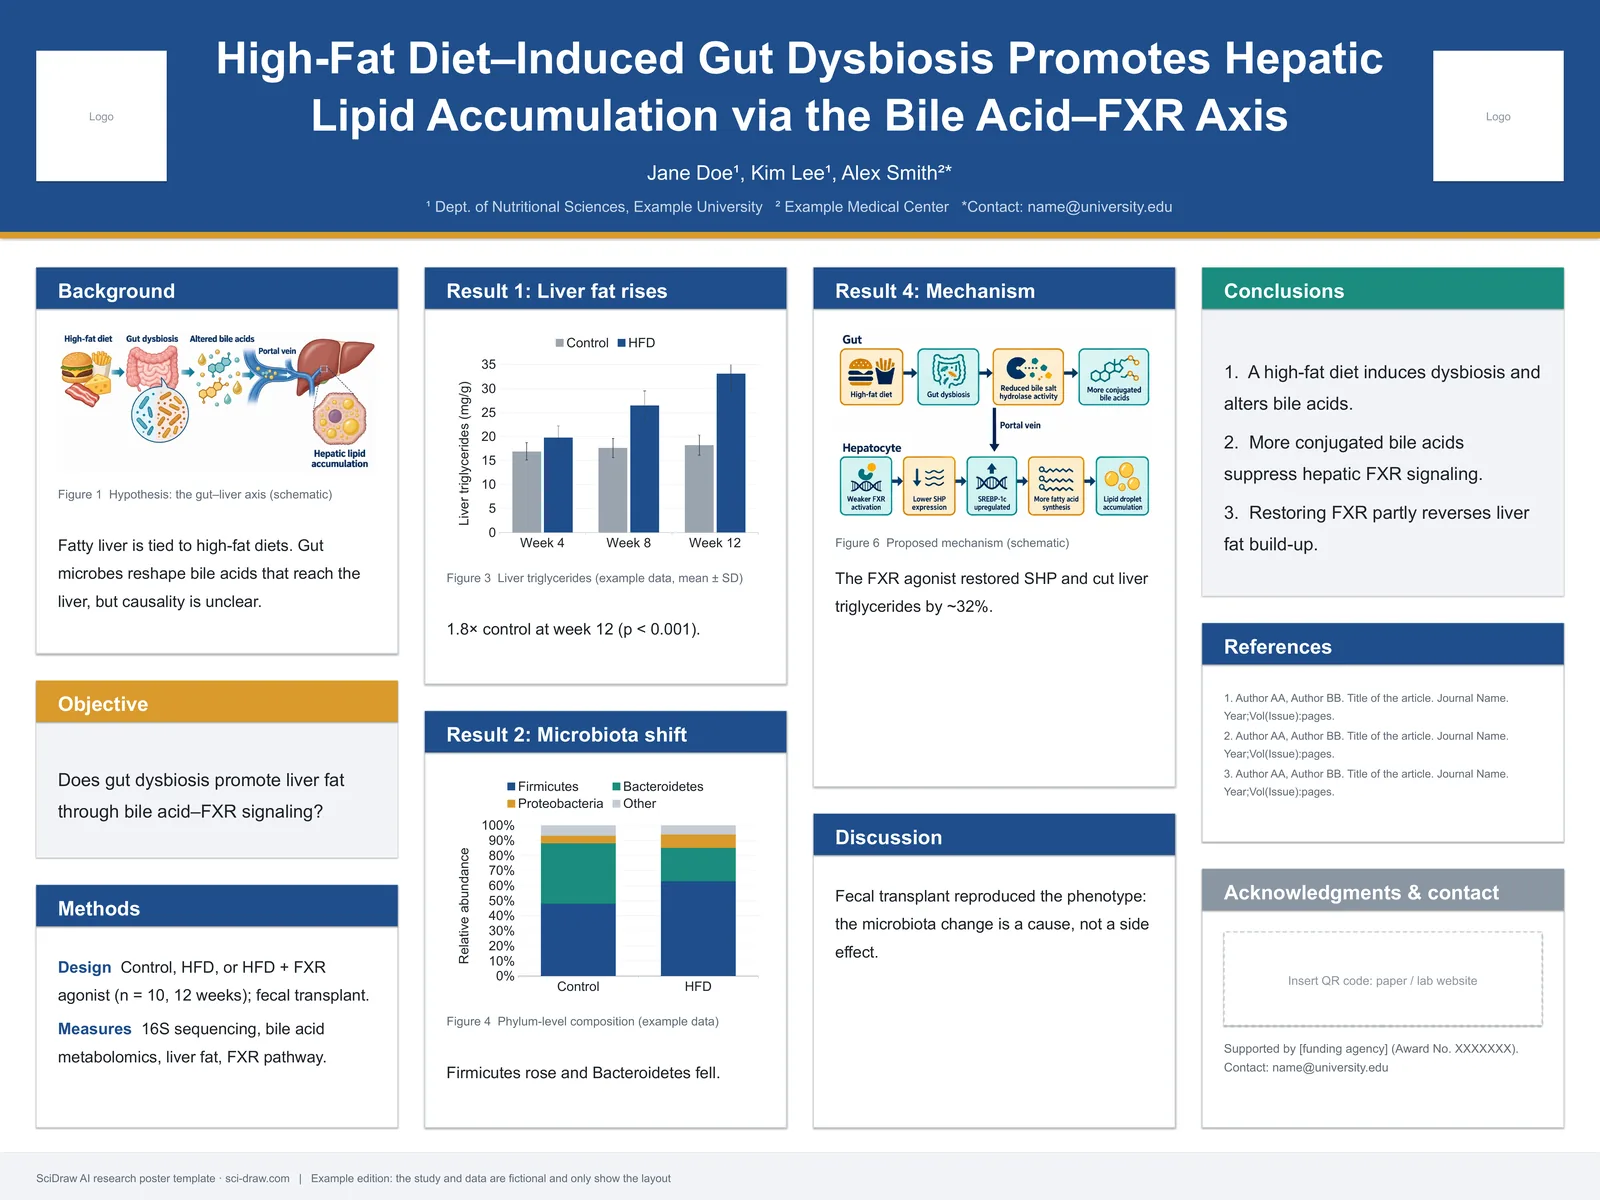
Dimensioni del poster scientifico (2026): A0, 36 × 48 pollici e requisiti dei congressi
I formati più usati per i poster scientifici in centimetri e pollici, come leggere le misure del pannello di un congresso e le regole ufficiali 2026 di SfN, NeurIPS, ICML, ICLR, CVPR, EGU, AACR, ACS, ASCO e ATS, più il Congresso SCI e il congresso SINS.
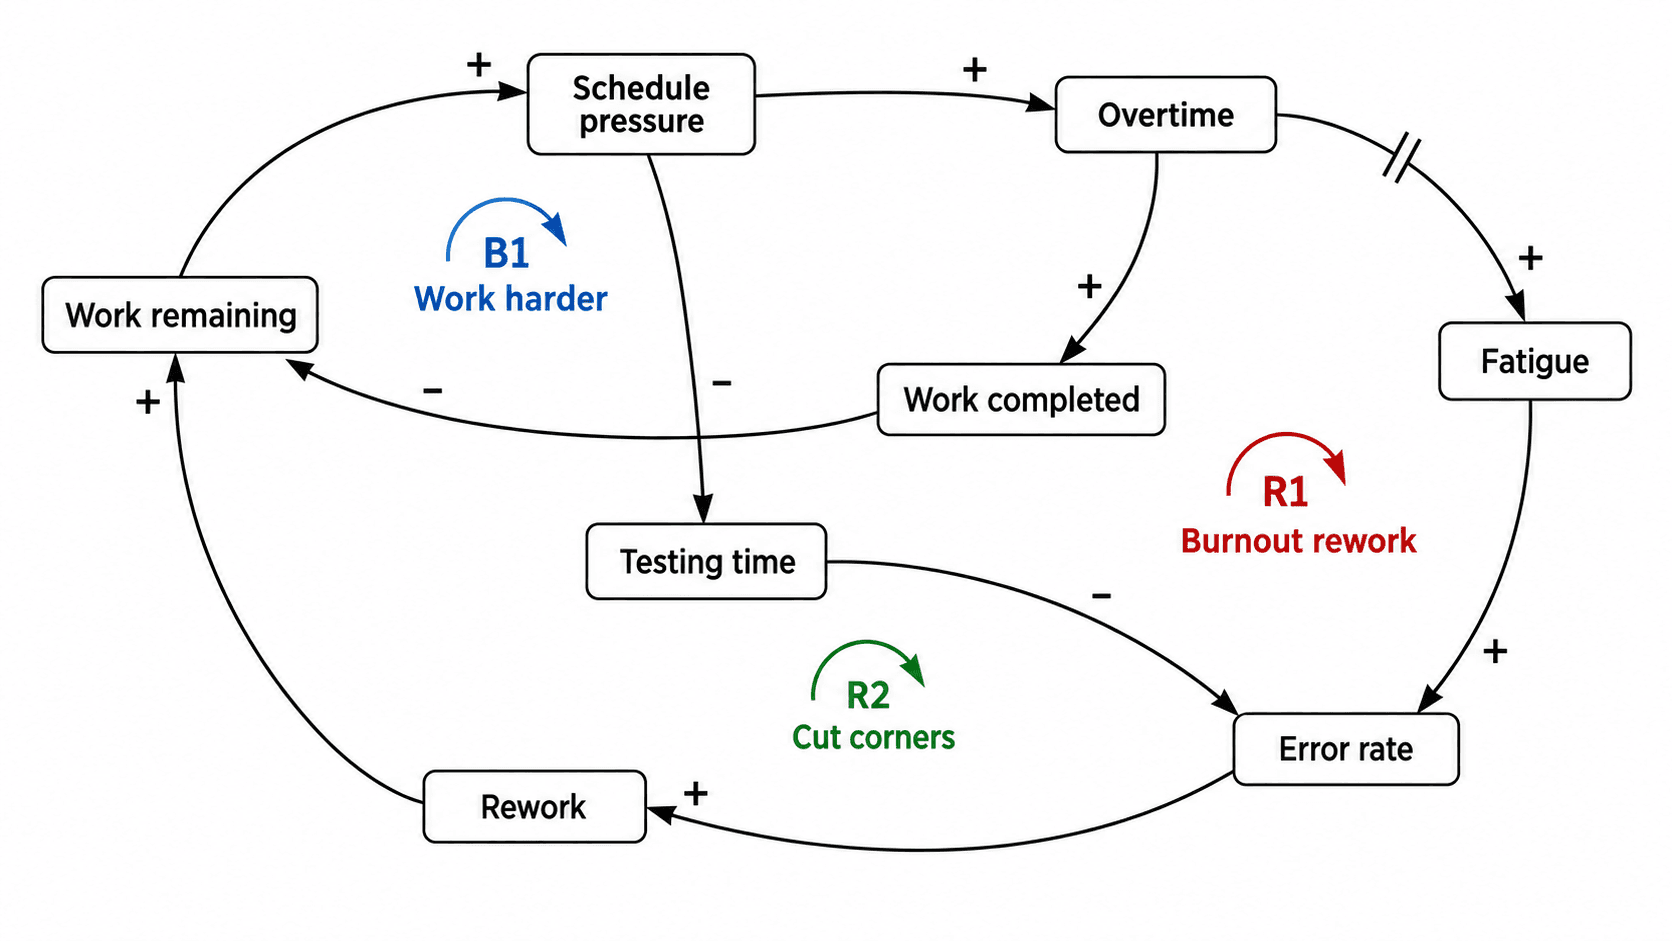
How to Draw a Causal Loop Diagram: Polarity, Reinforcing and Balancing Loops (2026)
A practical guide to causal loop diagrams for system dynamics: choosing variables, assigning + and − polarity, telling reinforcing from balancing loops, marking delays, and writing the loops up in a thesis.
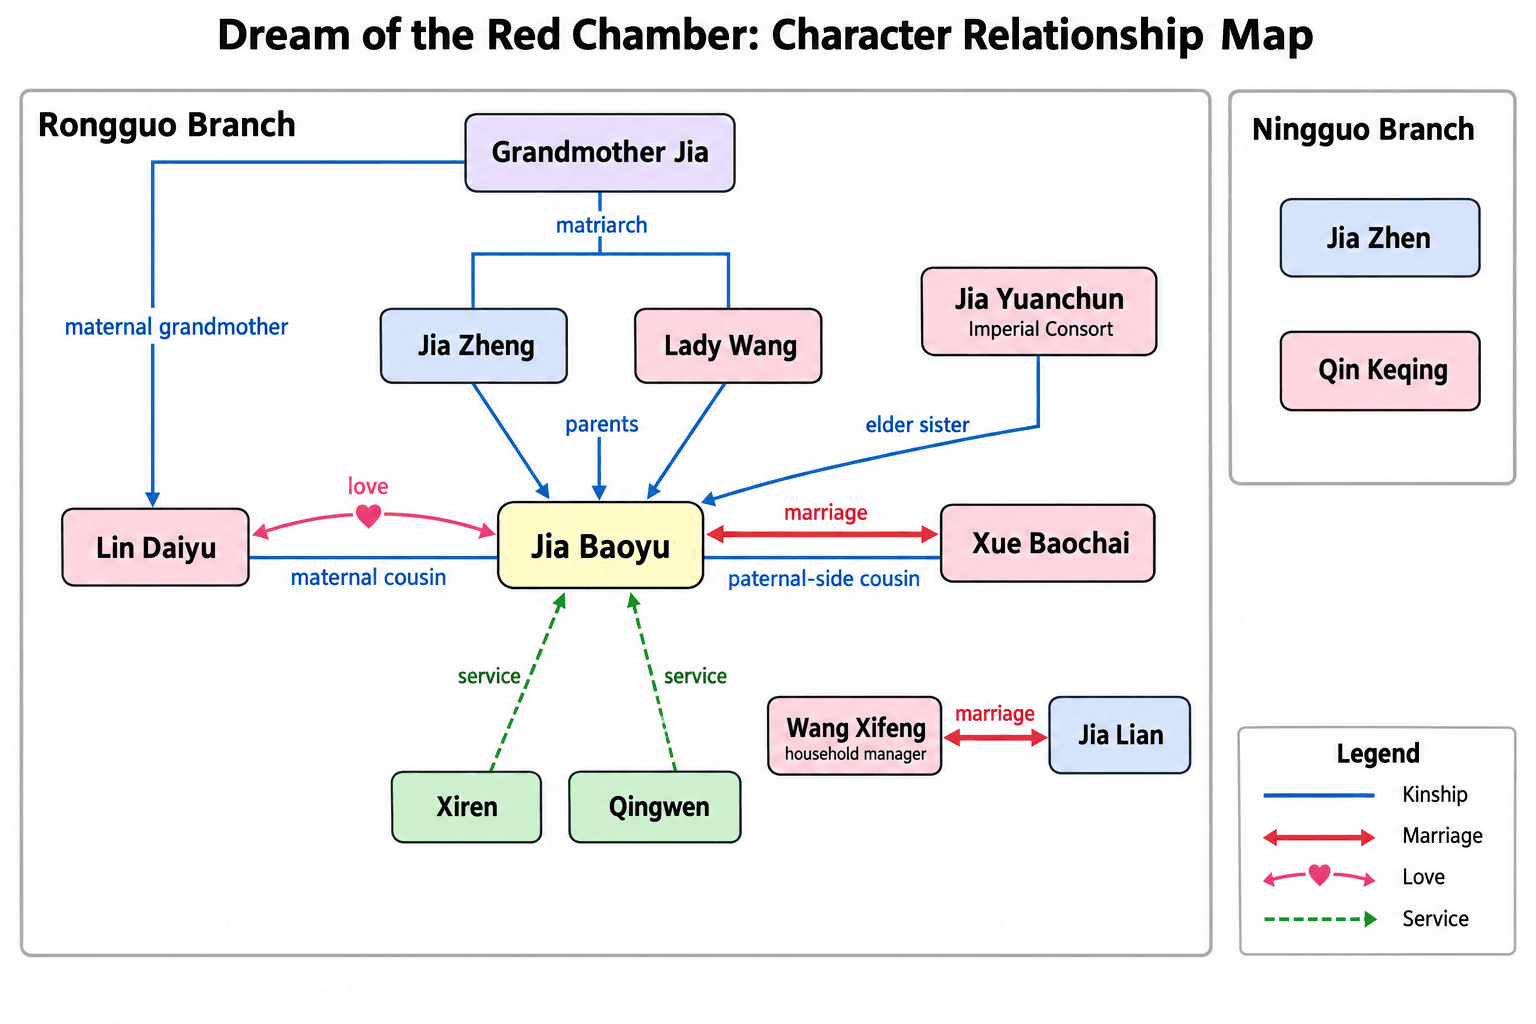
How to Make a Character Relationship Map for a Literature or History Thesis (2026)
How to make a character relationship map for a novel, play, history or film thesis: required elements, a cited relationship table, Pride and Prejudice and Hamlet examples, common mistakes, captions, and AI drafts.
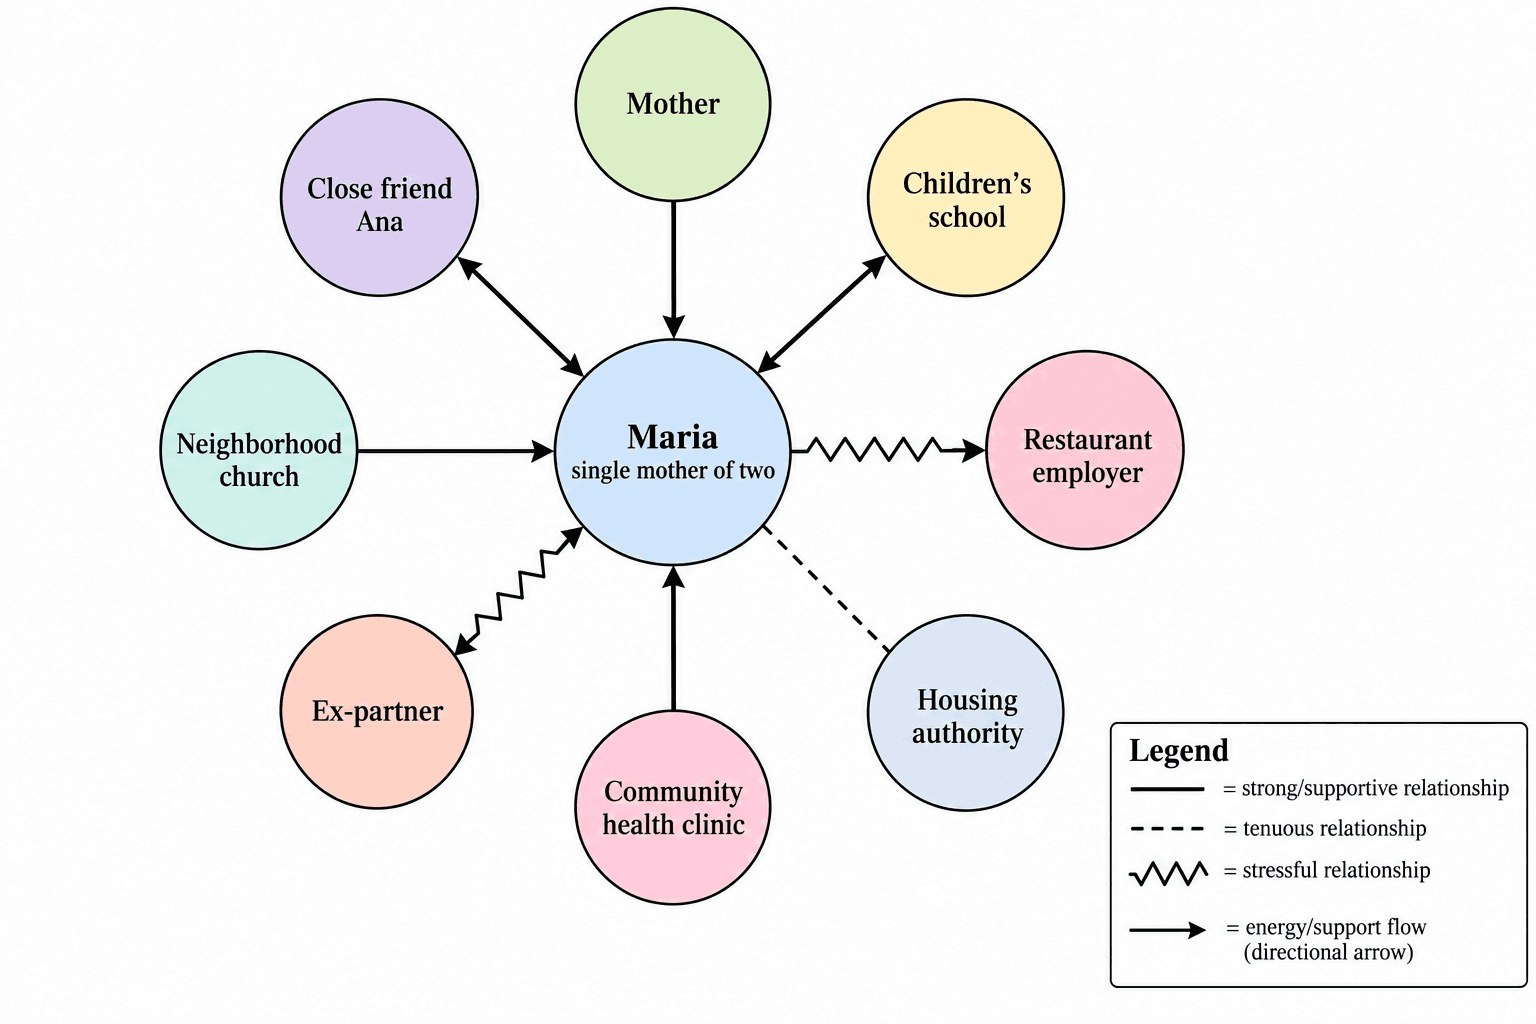
How to Make an Ecomap: Social Work and Nursing Case Assessment (2026)
How to make an ecomap for social work and nursing assessment: line conventions, the legend, ecomap vs genogram, anonymization, and two worked examples.