If you are writing a thesis in literature, history or film studies, at some point your advisor will say: "Draw me the character map first." The figure is not decoration. It is the skeleton of your argument — who is connected to whom, what kind of tie it is, and at which point in the story or the timeline that tie holds. A clear map makes the later chapters easier to follow; a muddled one makes a reader doubt how well you know the text.
This guide is for undergraduate and graduate students in literature, history and film. It covers what a thesis-grade character relationship map must contain, how to build the list of relationships from the source before you draw anything, how the three disciplines differ, and how to describe and caption the figure in the thesis itself. Pride and Prejudice and Hamlet serve as short worked examples.
What you'll learn:
- The six elements every character relationship map needs
- How to build a two-column character–relationship table with a citation for each tie
- What changes between novel, history and film maps
- Common mistakes, and how to write the paragraph and caption that go with the figure
- How to turn the table into an editable draft with AI
What a thesis-grade character map must contain
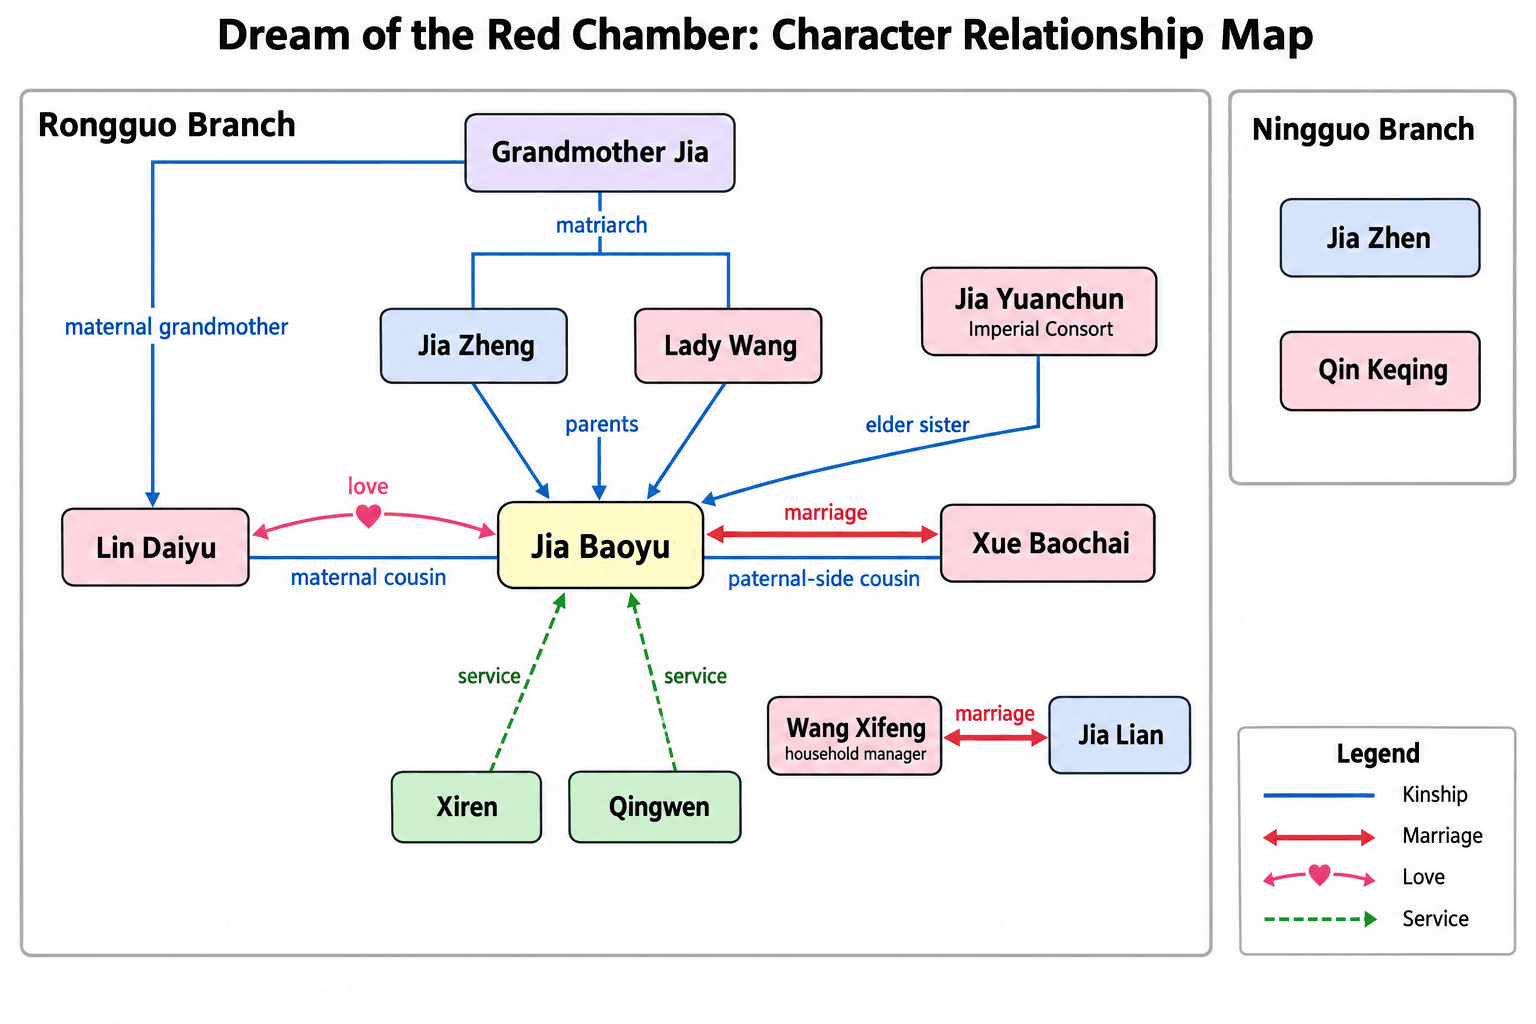
A character relationship map (also called a character chart or character network) looks simple, but a committee judges it on one question: can every line be checked against the source? At minimum, it needs six elements:
- Characters with their roles — each node carries a name and a role in the work or the record: "Elizabeth Bennet, second daughter", "Claudius, King of Denmark (uncle)".
- Relationship types — kinship, marriage, courtship, friendship, service, rivalry, political dependence. Distinguish them by line style or color, and use the same style for the same type throughout.
- Direction — one-way ties (unrequited love, surveillance, patronage, command) get an arrowhead; mutual ties (siblings, spouses, allies) get a plain line. Do not draw everything as a double-headed arrow.
- Stage or time — the chapter, act, episode or year in which a tie is formed or broken. Literature maps cite chapters and acts; history maps cite dates.
- Households, factions or families — group characters with a tinted box or a dashed outline so the reader sees the structure before reading a single label.
- A legend — the meaning of every line style, color and box, in the figure or in the caption. Without a legend the committee is guessing.
Test: cover the labels and look only at boxes, lines and colors. A reader should still be able to tell how many factions there are and who sits at the center of the conflict.
Before you draw: build the relationship table
The most common way this figure goes wrong is opening a drawing tool and starting to drag boxes. The order that works is read, list, then draw. The list needs only two columns — characters and relationship — and every row carries a citation, so that every line on the finished map traces back to the text.
Here is a partial table for Pride and Prejudice, Volume I only (main ties, for illustration):
| Characters | Relationship (source) |
|---|---|
| Mr and Mrs Bennet | Married; parents of five daughters at Longbourn (Vol. I, ch. 1) |
| Jane Bennet — Charles Bingley | Courtship begins at the Meryton assembly (Vol. I, ch. 3) |
| Elizabeth Bennet — Fitzwilliam Darcy | Mutual dislike after Darcy's slight at the assembly (Vol. I, ch. 3) |
| Mr Collins — Mr Bennet | Cousin and heir to the entailed Longbourn estate (Vol. I, ch. 13) |
| Mr Collins — Lady Catherine de Bourgh | Clergyman and patroness (Vol. I, ch. 13–14) |
| George Wickham — Darcy | Grew up together at Pemberley; Wickham's grievance told to Elizabeth (Vol. I, ch. 16) |
| Mr Collins — Charlotte Lucas | Engaged after Elizabeth refuses him (Vol. I, ch. 22) |
Once the table exists, several things become obvious: which ties have a clear citation and which you merely assumed; which ties change over the course of the book (Elizabeth and Darcy, most obviously); and that the full cast is larger than one figure can hold. Settle all of that before drawing.
Rules for the table:
- One tie per row. Do not compress "A is friends with B, C and D" into a single cell.
- Cite to the chapter, act, scene or page; for historical sources, to the document and the year.
- Flag uncertain ties ("implied", "according to X") so you can draw them dashed later.
- Give a changing tie two rows, noting where the change happens.
Novel, history, film: what changes
All three disciplines call the figure a character map, but they weight it differently.
Novels and plays
The emphasis is on the kind of tie and how it changes. Novels are divided by volume or chapter, plays by act. Group characters by household or family, distinguish kinship, marriage and affection by line style, and label each tie with the chapter or act where it is established. For a long novel, draw one map per volume or per turning point.
History
The emphasis is on verifiable ties with dates. Kinship, marriage alliances, treaties, lordship and service, patronage, teacher and pupil — each needs a documentary source and a year. Lines on a history map usually carry a date ("allied 1536", "broke 1540"), and the boxes correspond to dynasties, houses or parties. If a person changed sides, draw two dated lines rather than merging them into one.
Film and television
The emphasis is on narrative structure and point of view. Film maps are usually divided by act or episode, note the scene or episode in which a character first appears, and often separate what the audience knows from what the characters know — a distinction many analyses of mystery and ensemble drama depend on. For a series, draw one map per season.
Two short examples
Pride and Prejudice: group by household
A character map for a novel like this, covering Volume I, can be organised around four boxes: the Bennets at Longbourn, the Bingley party at Netherfield (Bingley, his sisters, and Darcy as their guest), the Lucases, and the Hunsford–Rosings pair of Mr Collins and Lady Catherine. Solid lines for kinship, double lines for marriage, a distinct color for courtship with the chapter beside it; Wickham sits outside the boxes with a one-way line of grievance pointing at Darcy. Volumes II and III each get their own map, so Darcy's first proposal and Lydia's elopement appear as changes between figures rather than as clutter inside one.
Hamlet: divide by act
The Act I map has three layers: the royal household (Claudius, Gertrude, Hamlet, and old Hamlet as a ghost), Polonius's family (Polonius, Laertes, Ophelia), and Hamlet's friends (Horatio, plus Rosencrantz and Guildenstern, who arrive in Act II). Claudius is both uncle and stepfather, so his line to Hamlet carries a double label; the ghost's revelation to Hamlet (Act I, scene 5) is a one-way arrow. After Hamlet kills Polonius (Act III, scene 4), Laertes turns from peer to avenger — that belongs on a second map, not as an edit to the first.
Common mistakes
- Inventing ties. If the text does not state or clearly show a relationship, it does not go on the map. Every line must trace to a row in your table.
- Mixing stages in one figure. An ally from Act I and an enemy from Act V on the same line leaves the reader unsure which stage you are analysing. Split by volume, act or year.
- Too many characters. Past about twenty nodes a map stops being readable. Keep the characters your argument actually uses; fold the rest into "other members of the household" or move them to an appendix.
- No legend. If the reader cannot decode the line styles, the figure cannot be checked.
- One line style for two meanings, or arrows pointing at random. One style, one relationship type.
- A figure the text never discusses. Characters analysed in the chapter should be on the map, and characters prominent on the map should appear in the chapter.
Describing the map in the thesis, and captioning it
A character map cannot simply be pasted in. The body text needs at least one paragraph stating what the figure covers (which chapters, acts or years), what sources the ties are drawn from, what the line styles mean, and the one or two structural features you want the reader to notice. For example:
"Figure 2.1 maps the principal kinship and courtship ties in Volume I of Pride and Prejudice. Solid lines mark kinship, double lines marriage, and colored lines courtship, with the chapter of first establishment beside each. The figure shows Elizabeth at the intersection of the Longbourn household and two lines of external attention — Darcy's and Collins's — which is the position the following section builds on."
The caption should be short and readable on its own, naming the work, the scope and the legend: "Figure 2.1. Principal character relationships in Pride and Prejudice, Volume I. Solid: kinship; double: marriage; colored: courtship; tinted boxes: household. Chapter numbers follow the three-volume division of the first edition." State the edition, because chapter numbering differs between editions.
Drafting the map with SciDraw AI
Once the table is done, the layout work can go to a tool. The SciDraw AI character map generator does not read the novel or infer relationships for you — it takes the characters, ties and groupings you have already listed and lays them out as a clean, consistent figure.
The steps:
- Turn the table into a description: characters with roles, each tie with its type and direction, the household or faction each character belongs to, and the chapter or year labels you want shown.
- Pick the mode: the novel character relationship map suits works grouped by household and divided by volume or act; the historical figure relationship map keeps dated kinship, marriage and alliance labels; the film and TV character map arranges characters by act or episode.
- Check it against the table, row by row, for extra lines or missing labels.
- Export and add the legend: if the figure will be edited later, export an editable format and finish the legend and edition note in PowerPoint or Illustrator.
If your thesis also needs a map of the theoretical framework or the literature review, the literature review concept map follows the same table-first workflow. For other literature thesis figures and figure types in other fields, start from thesis figures by field. The generator is free to try — draft one act or one volume first, then decide how to split the rest.
FAQ
Can the tool read the novel and find the relationships for me? No. The relationships have to come from your own reading of the text or the sources, each with a citation. The tool lays out the ties you list. That is also what makes the figure defensible: every line corresponds to a row in your table.
Is there a copyright issue in mapping characters from a novel or a series? Character names and the relationships between them are your analysis and description of the work, and using them in study and academic writing is generally fine. Do not paste the book's illustrations, film stills or long quotations into the figure. For publication, follow your journal's or department's guidance.
How many characters should one figure hold? As many as remain readable — usually 8 to 15 nodes. Past about 20, split the map by volume, act, year or faction and add one overview figure showing how the parts relate.
How do I show a tie that is uncertain or disputed? Draw it as a dashed line with a question mark or a short note, and say in the caption that dashed lines mark ties not stated in the text and inferred from a named source. Explain the disagreement in the body text. Do not promote an uncertain tie to a solid line to make the figure look tidier.