Pyroptosis
NLRP3 inflammasome → caspase-1 → GSDMD pore formation → IL-1β/IL-18 release and lytic cell death.
From molecular pathways to publication-ready illustrations
SciDraw AI generates professional mechanism figures — biological pathway diagrams, signaling pathways, molecular interactions, drug mechanisms of action, and biological process visuals — designed for high-impact journal submissions.
Browse mechanism figures across disciplines, or generate your own above.
Pick your field and load a detailed, field-specific prompt into the generator above. Edit any molecule or step before you generate, and check every relationship against your own data.
NLRP3 inflammasome → caspase-1 → GSDMD pore formation → IL-1β/IL-18 release and lytic cell death.
Nutrient stress: AMPK ↑ / mTORC1 ↓ → ULK1 complex → Beclin-1–VPS34 → LC3-II phagophore → autolysosome degradation.
Endosome → MVB with ESCRT-formed ILVs → Rab27-dependent fusion with the plasma membrane → exosome (CD63/CD9/CD81) uptake by recipient cells.
Fiber fermentation → SCFAs (acetate, propionate, butyrate) and secondary bile acids → GPR41/43, FXR/TGR5 signaling, barrier integrity and Treg induction; dysbiosis → LPS leak → inflammation.
DNMT3A/3B (de novo) and DNMT1 (maintenance) methylate promoter CpG islands → MBD proteins recruit HDACs → gene silencing; TET enzymes oxidize 5mC for demethylation.
OCT4/SOX2/NANOG core network maintains pluripotency and self-renewal; differentiation to three germ layers; OSKM reprogramming of somatic cells to iPSCs.
Normoxia: PHD hydroxylation → VHL ubiquitination → proteasomal degradation of HIF-1α; hypoxia: HIF-1α/HIF-1β bind HREs → VEGFA, GLUT1, LDHA, EPO.
Unfolded proteins sequester BiP/GRP78 → PERK–eIF2α–ATF4–CHOP, IRE1α–XBP1s and ATF6 arms → adaptation or apoptosis.
ETC damage → ROS overproduction and loss of ΔΨm → BAX/BAK MOMP → cytochrome c release → caspase-9/3 apoptosis; PINK1/Parkin mitophagy clears damaged mitochondria.
LPS + IFN-γ → STAT1/NF-κB → M1 (iNOS, TNF-α, IL-1β, IL-12); IL-4/IL-13 → STAT6 → M2 (Arg1, CD206, IL-10, TGF-β).
Chronic antigen → sustained TCR/NFAT signaling and TOX → PD-1, TIM-3, LAG-3, TIGIT up → loss of IL-2, TNF-α, IFN-γ; TCF1+ progenitors respond to anti-PD-1.
Tissue dissociation → droplet capture with cell barcodes and UMIs → sequencing → QC, normalization, PCA, clustering and UMAP → annotation, DEGs, trajectory and cell–cell communication.
This free AI mechanism figure generator turns a plain-text description of a molecular, biological, or physical mechanism into a clear, publication-ready figure. It captures the components, their interactions, and the sequence of events — from enzyme catalysis and signaling cascades to drug mechanisms of action and catalytic cycles — ready for journals such as Nature, Cell, Science, and PNAS.
An effective mechanism figure follows the natural flow of the process: introduce the key players, show how they interact, and lead the reader through each step with consistent arrows and labels. Use standard notation for activation and inhibition, keep text minimal, and group related events spatially. SciDraw AI drafts mechanism figures that follow these conventions automatically, giving you a publication-ready starting point to refine.
You can create signaling pathway diagrams, drug mechanism of action figures, enzymatic reaction illustrations, protein-protein interaction maps, gene regulatory networks, cellular process schematics, immune response cascades, and metabolic pathway visualizations.
Yes. SciDraw AI recognizes biological terms — proteins (p53, EGFR, mTOR), pathways (NF-kB, MAPK, PI3K/Akt), processes (apoptosis, autophagy, angiogenesis), and molecular interactions (phosphorylation, ubiquitination, acetylation). Simply describe the mechanism in natural language, then review the generated relationships.
Absolutely. The generator supports standard pathway notation including activation arrows, inhibition bars, phosphorylation indicators, complex formation, translocation, and transcriptional activation/repression markers.
Yes. All exports meet the figure requirements of journals like Nature, Cell, Science, PNAS, and specialty journals. High-resolution (300+ DPI) output with scalable vector formats ensures your mechanism figures look professional at any size.
Yes. Describe your drug target, binding mechanism, downstream effects, and therapeutic outcome. SciDraw AI will generate a professional MOA figure draft showing the pharmacological pathway from drug-target interaction to clinical effect.
Describe the components involved, their interactions, and the sequence of events. SciDraw AI does not rely on a fixed pathway database — it drafts custom mechanism figures from your natural language description, making it useful for illustrating novel findings that still require expert review.
Yes. Download the result as a high-resolution PNG, or click Open in editor to keep refining it. From the editor you can convert it to an SVG vector file (10–15 credits), a PowerPoint PPTX file (10 credits) or a Visio file (20 credits).
The AI draws and labels what you describe, but it does not check the science for you. Review every label, arrow and value before you use the figure, then fix anything that is off by refining your description and regenerating, or by adjusting it in the editor.
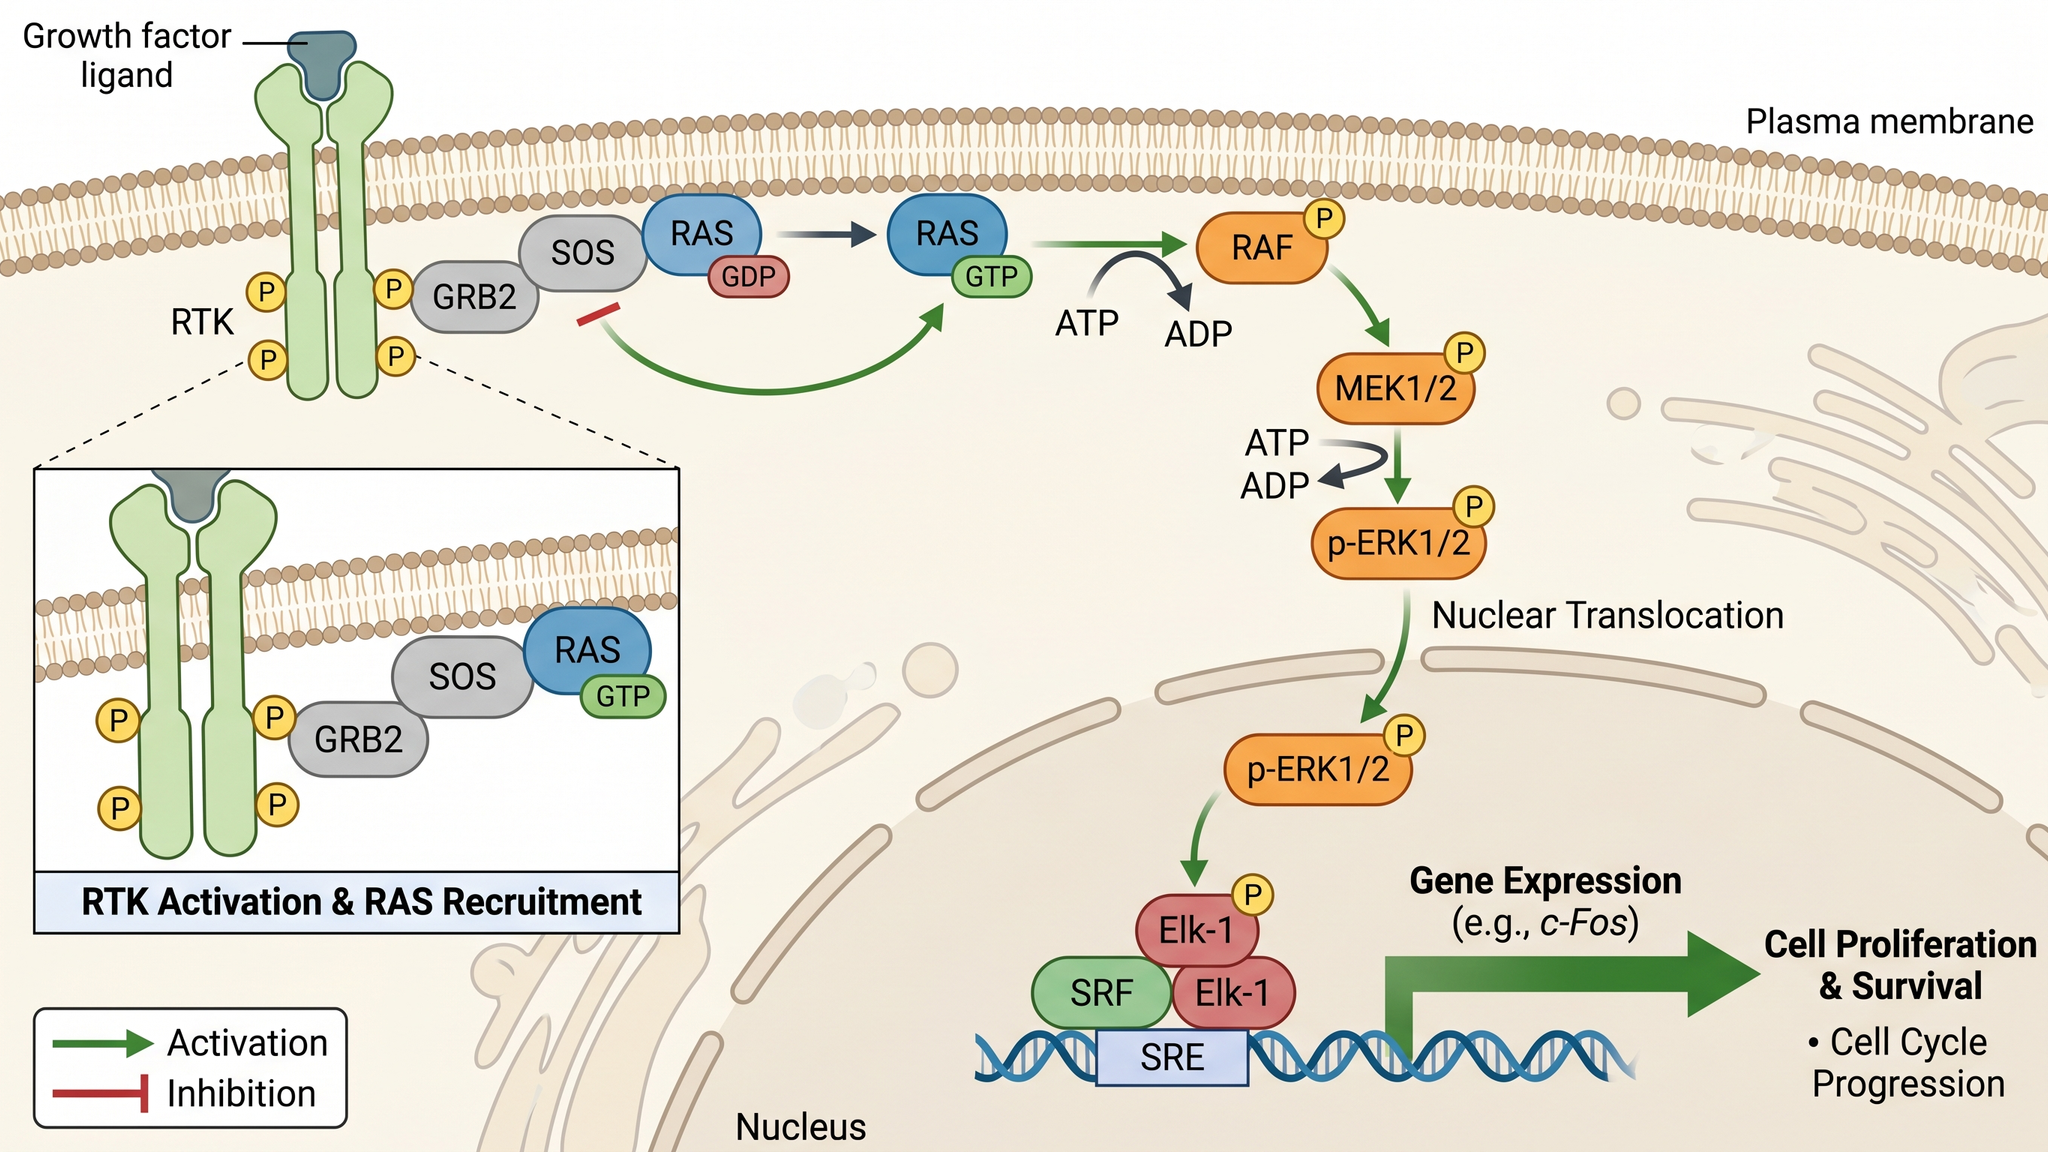
Create signaling pathway and molecular cascade diagrams
Try it free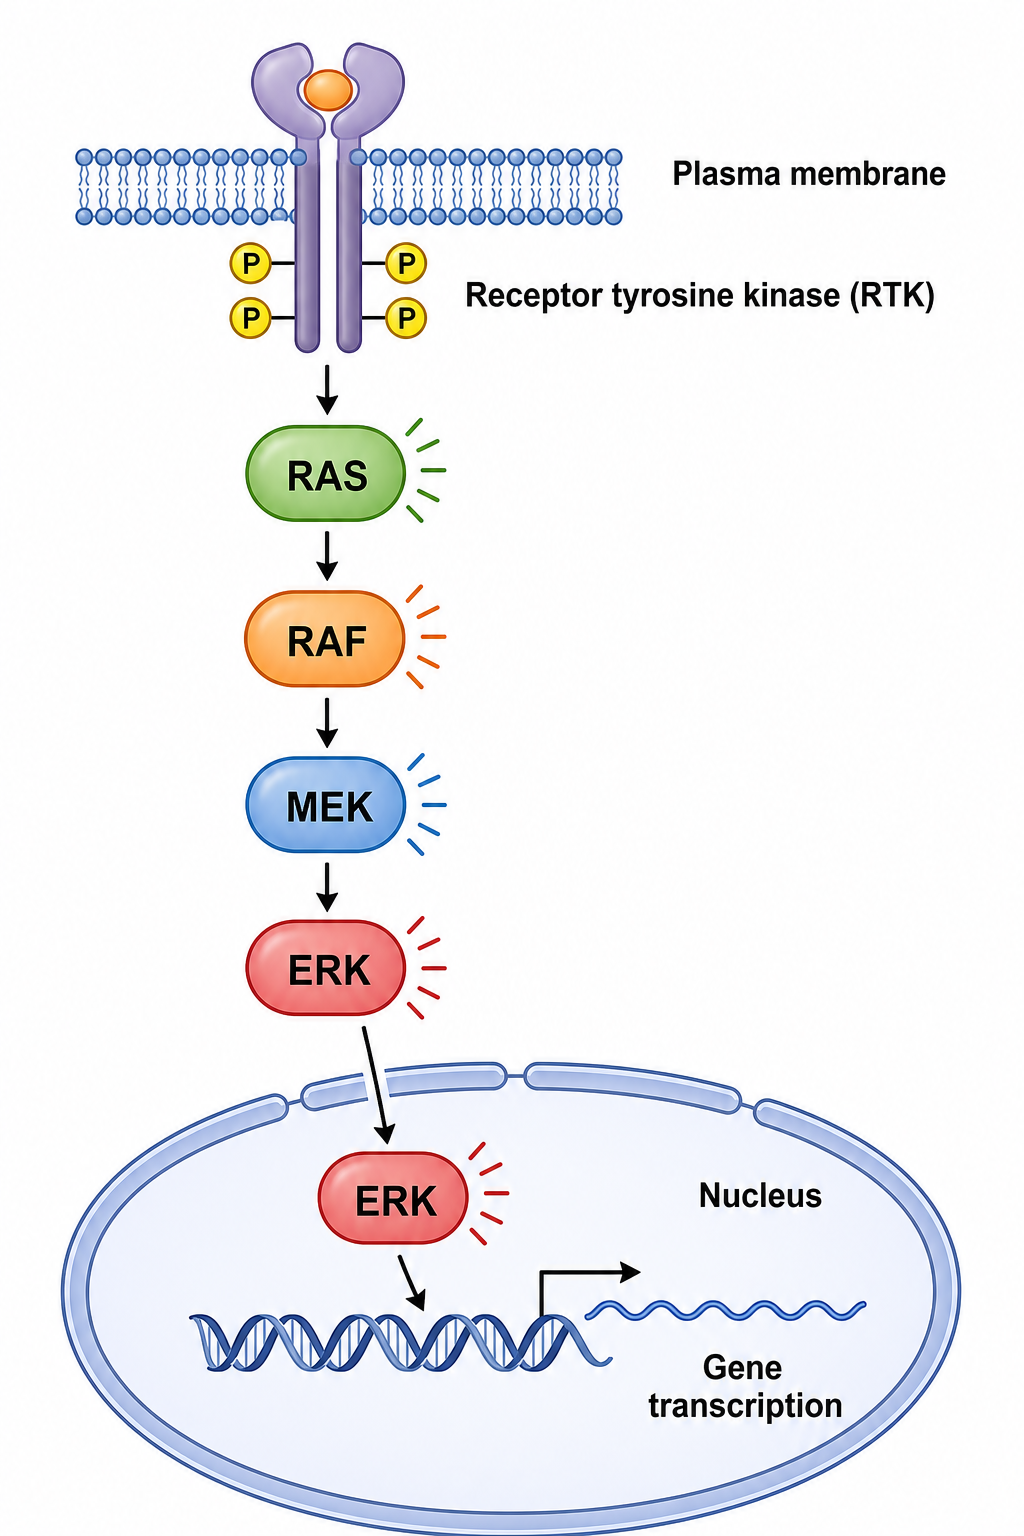
Draw labeled signaling cascades — MAPK, PI3K-AKT, Wnt, NF-κB, JAK-STAT, and TGF-β.
Try it free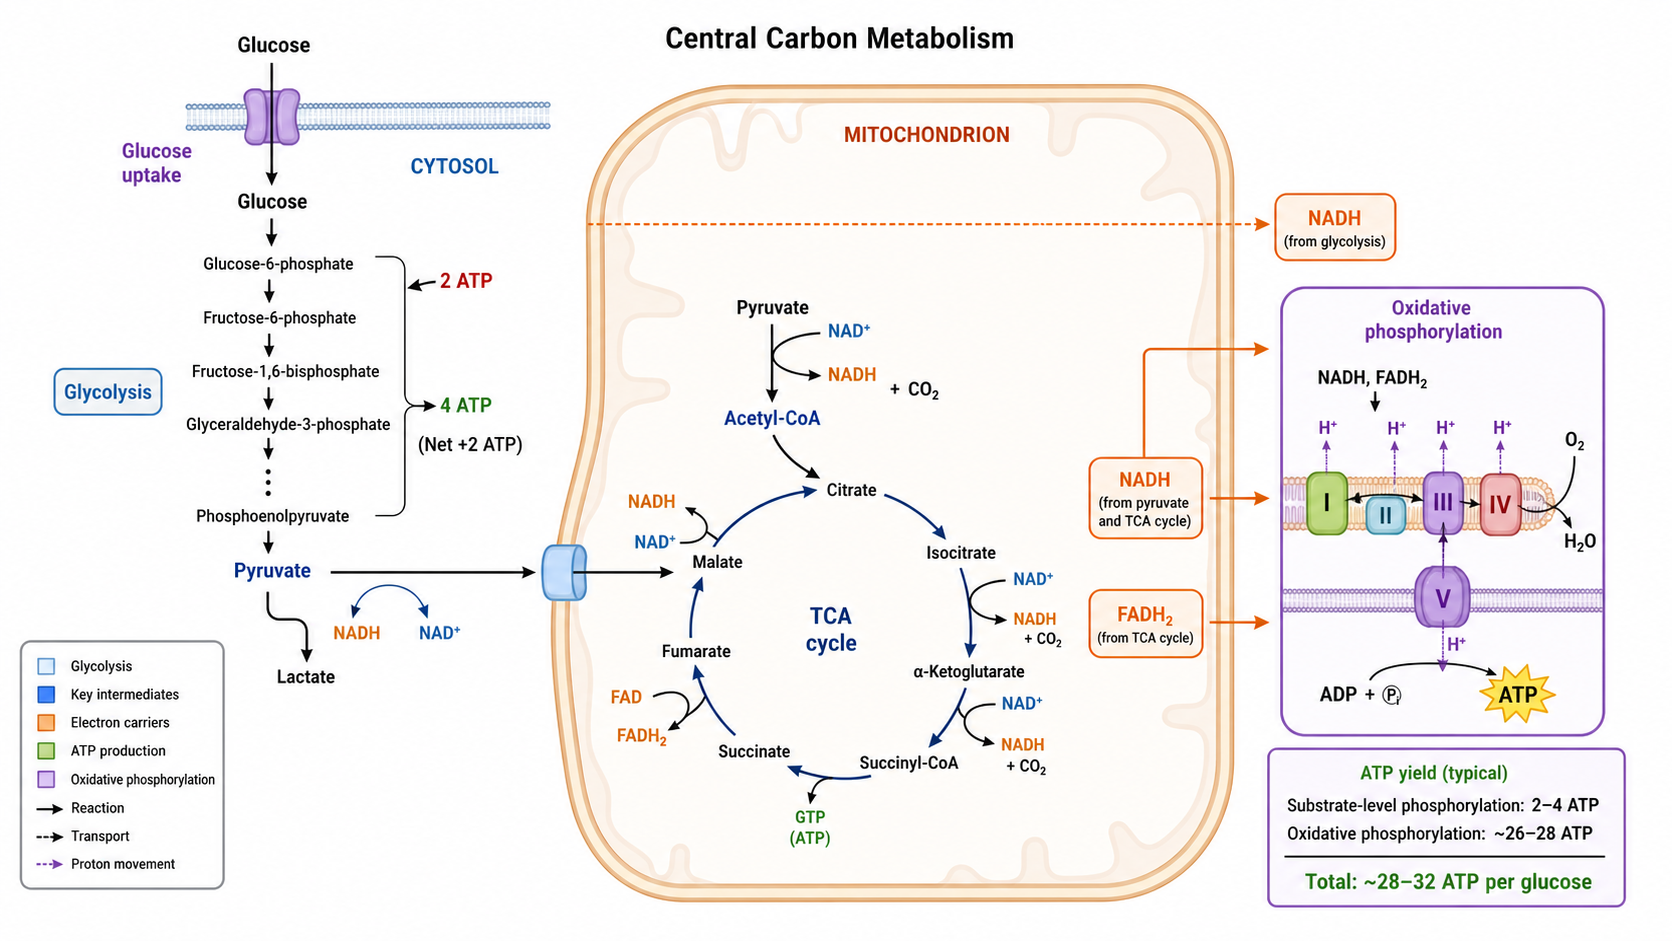
Create metabolic pathway diagram visuals for central carbon metabolism, glycolysis, TCA links, flux arrows, compartments, and energy outputs.
Try it freeJoin thousands of biomedical researchers who use SciDraw AI to visualize signaling pathways, drug mechanisms, and molecular interactions.
Preview
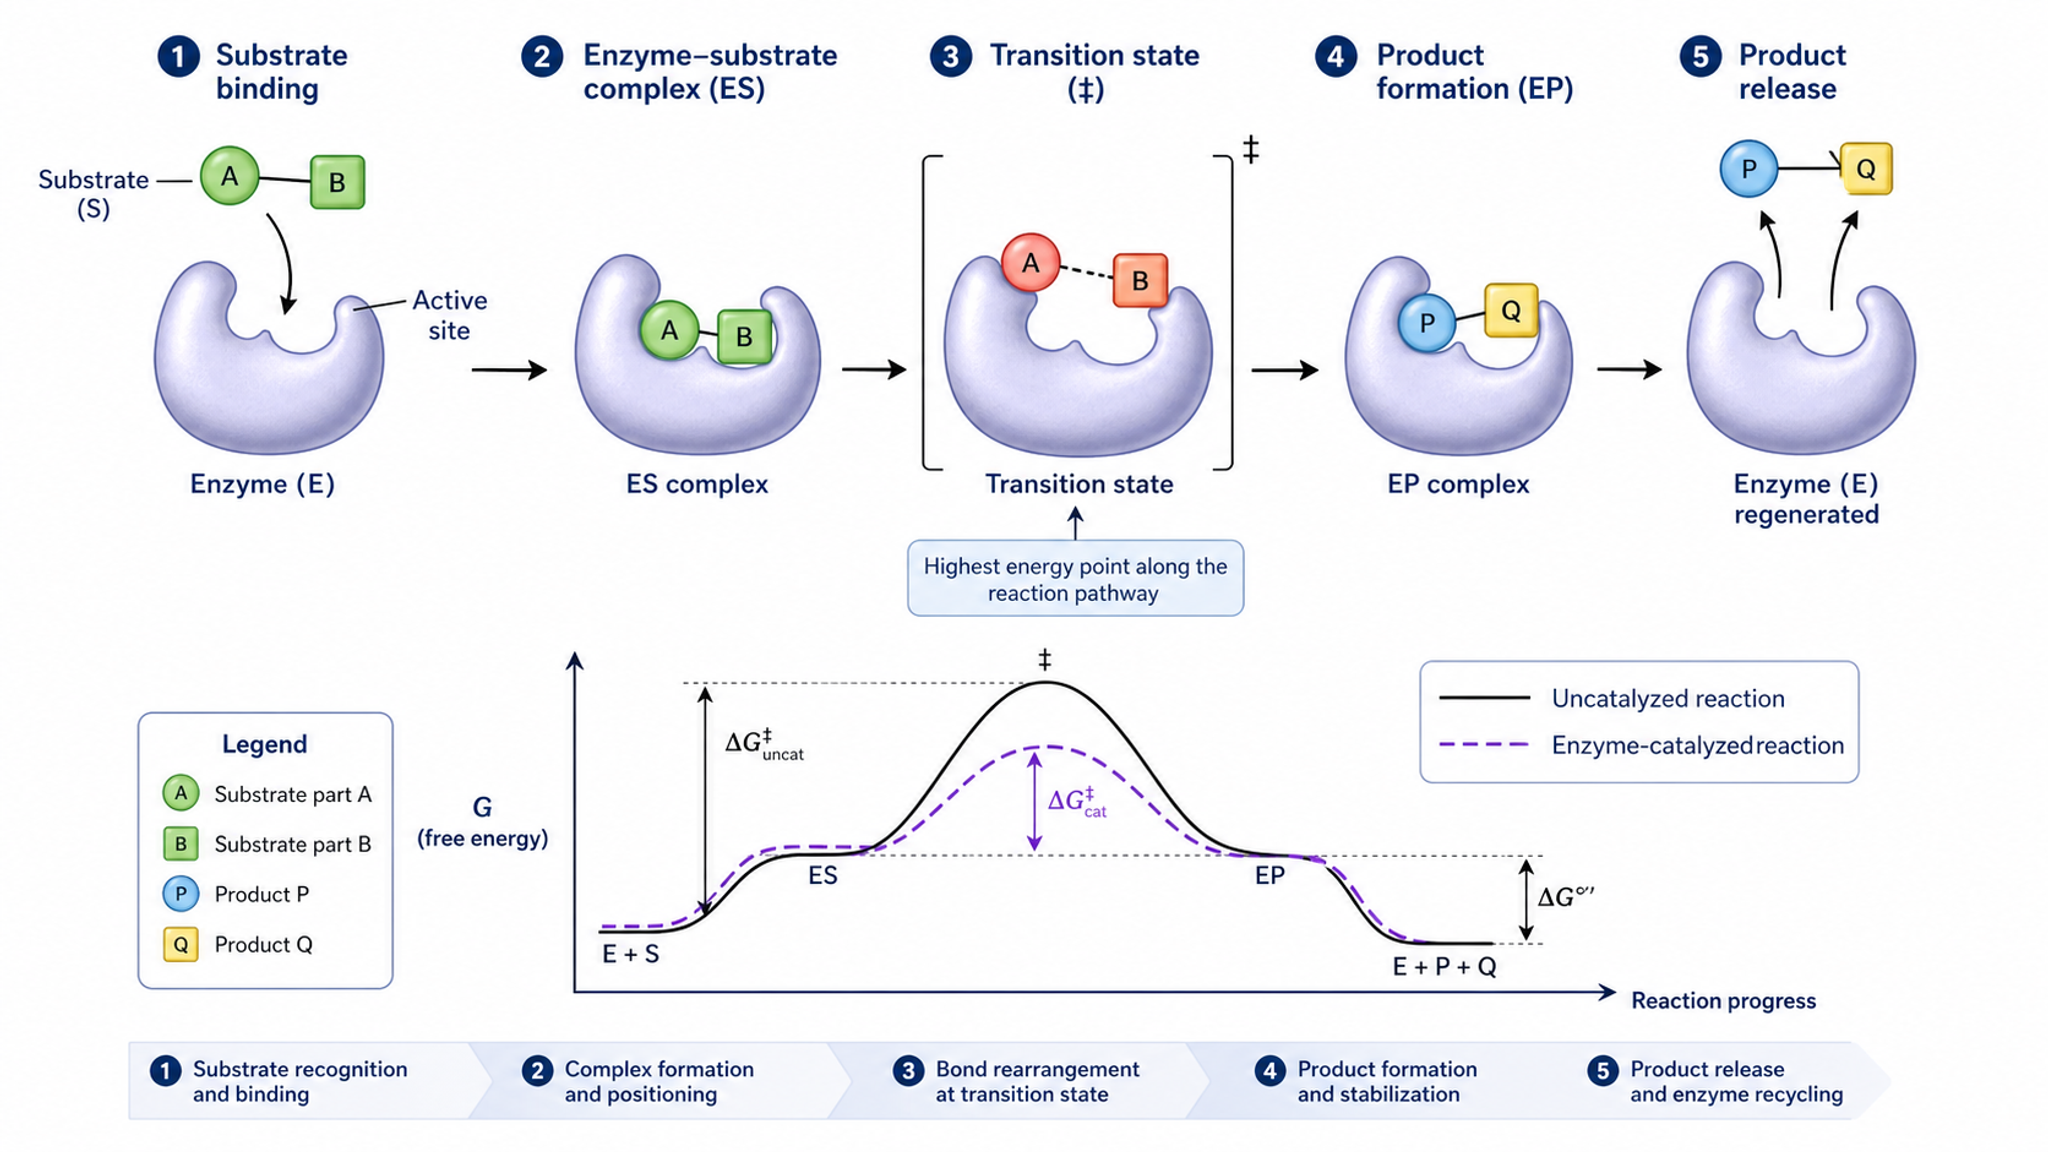 Example
This is a sample result. Describe yours to generate your own.