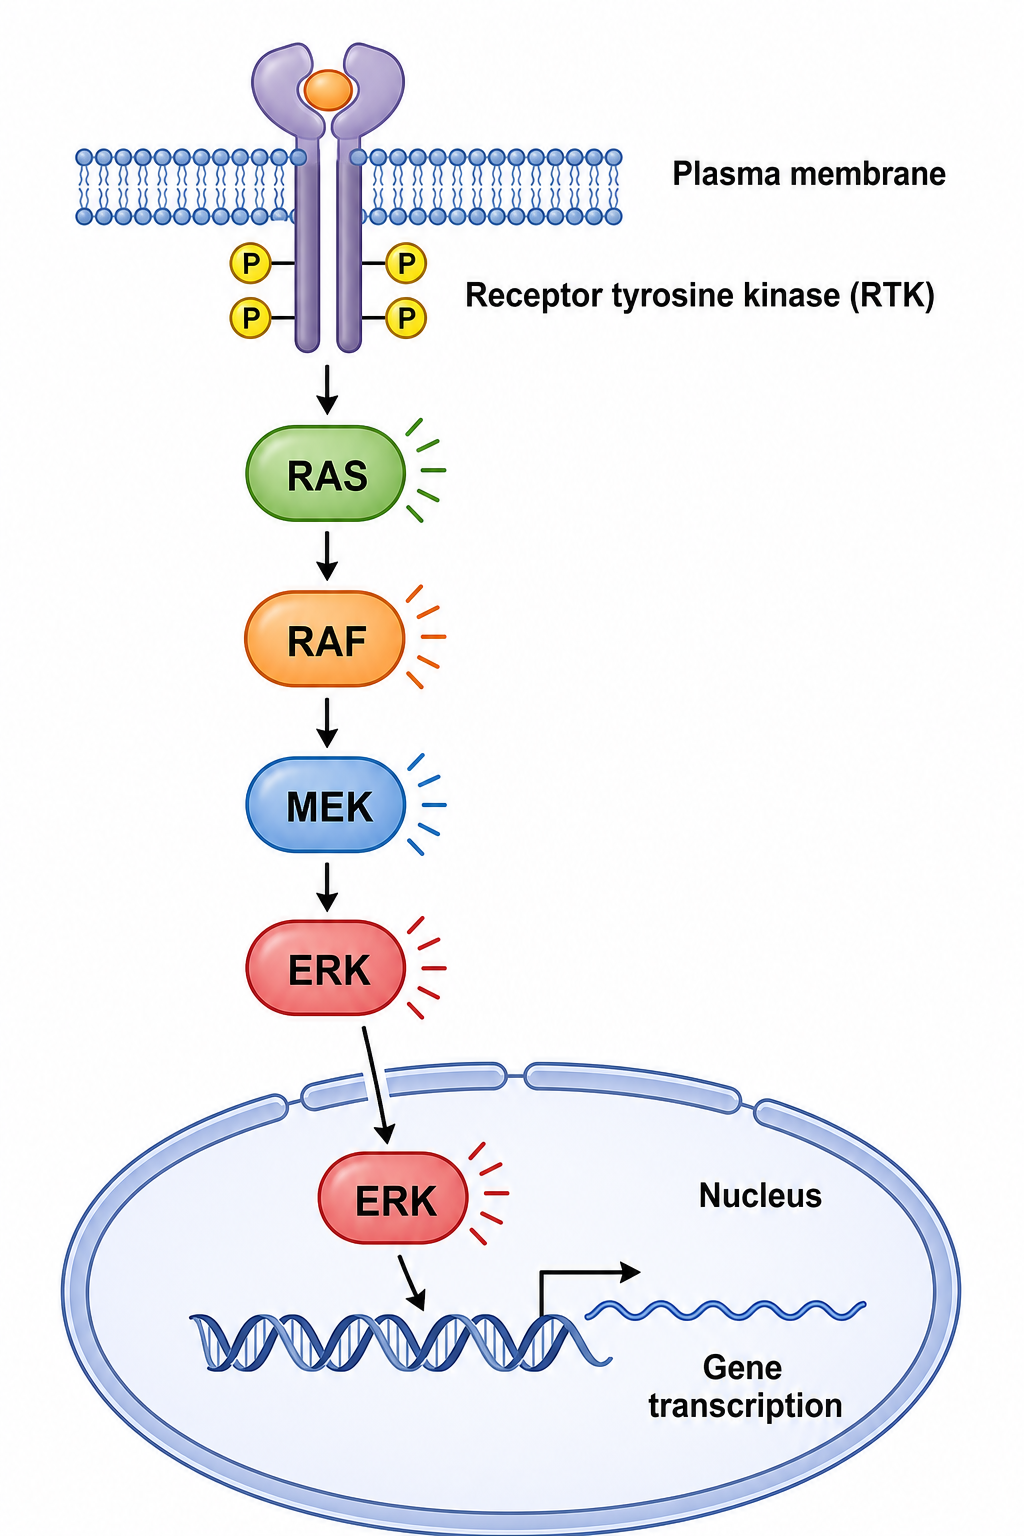
Signaling Pathway Diagram Generator
Turn a sentence into a labeled pathway figure
Describe any cell signaling cascade — MAPK/ERK, PI3K-AKT-mTOR, Wnt, NF-κB, JAK-STAT, or TGF-β — and SciDraw AI draws a clean, labeled pathway with receptors, kinases, transcription factors, and correct activation and inhibition arrows.
Signaling pathway examples
Start from a proven prompt, then adapt it to your pathway.
What this tool does
The Signaling Pathway Diagram Generator turns a plain-language description into a clean, labeled pathway figure. You describe the receptors, kinases, second messengers, and transcription factors you want — and SciDraw AI arranges them across the membrane, cytoplasm, and nucleus with consistent activation arrows and inhibition bars. It is built for researchers, students, and educators who need accurate, publication-ready signaling figures fast.
Why use an AI signaling pathway generator?
- Pathways are dense networks of nodes and edges that are slow to lay out by hand.
- Activation vs inhibition must read clearly — the tool uses arrows and bars consistently.
- Labels for kinases and factors stay crisp, avoiding the garbled text of generic image AI.
- Every diagram is editable and exportable to SVG or PowerPoint for papers and talks.
- One prompt covers many canonical cascades — MAPK, PI3K-AKT, Wnt, NF-κB, JAK-STAT, TGF-β.
How to make a signaling pathway diagram
1) Describe the cascade — list the receptor, the kinases or mediators in order, and the endpoint. 2) Click Generate to get a labeled draft. 3) Refine by asking to add a node, mark an inhibitor, recolor, or relabel. 4) Export to SVG or PPTX, or download a high-resolution image for your manuscript, lecture, or poster.
What you can illustrate
- Membrane receptors (RTKs, GPCRs, cytokine receptors) and ligands
- Kinase cascades and phosphorylation events
- Second messengers and adaptor proteins
- Activation arrows and inhibition bars, including negative feedback
- Transcription factors entering the nucleus and target genes
- Crosstalk between parallel pathways
Signaling Pathway Diagram Generator — FAQ
Which signaling pathways can I create?
Canonical cascades such as MAPK/ERK, PI3K-AKT-mTOR, Wnt/β-catenin, NF-κB, JAK-STAT, and TGF-β/SMAD — as well as custom pathways. Just describe the receptor, the steps in order, and the endpoint.
Does it show activation vs inhibition correctly?
Yes. The tool uses standard conventions — arrows for activation and flat-end bars for inhibition — so signaling logic reads the way reviewers expect.
Can I edit the pathway after generating it?
Absolutely. You can refine any diagram by asking to add or remove nodes, mark an inhibitor, recolor, simplify, or rename labels — without redrawing the whole figure.
Can I export to PowerPoint or SVG?
Yes. Diagrams export to editable SVG or PowerPoint (PPTX), or download as high-resolution images — ready for manuscripts, slides, and posters.
Is it accurate enough for publication?
It is designed for publication-ready output: clean vector style, consistent arrows and bars, membrane/nucleus context, and accurate labeling that fits journal standards. Always review the biology for your specific system.
Do I need design skills?
No. If you can describe the pathway in a sentence, you can generate a professional figure. The AI handles layout, styling, and labeling.
Explore More Tools
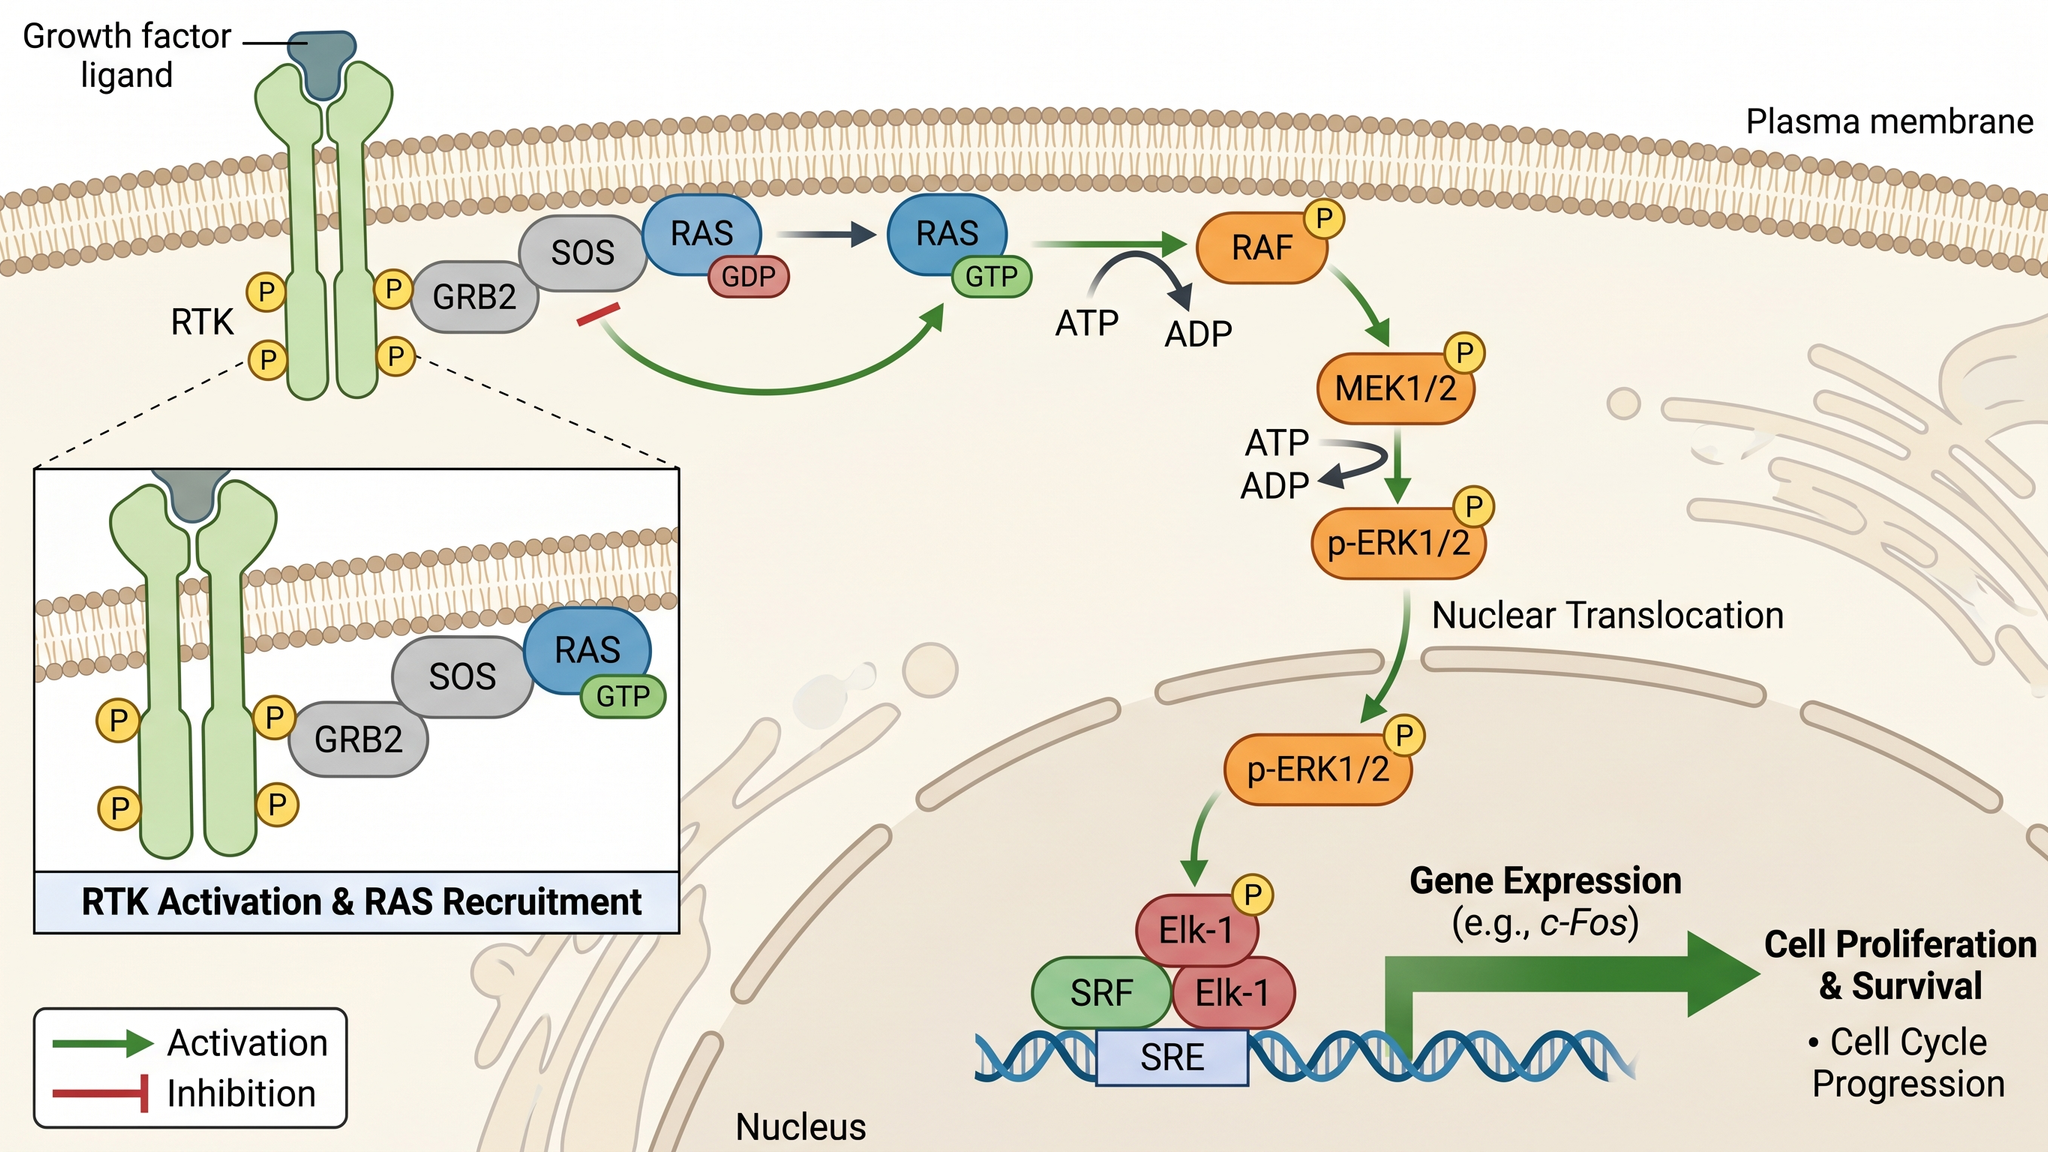
Biological Pathway Diagram Generator
Create signaling pathway and molecular cascade diagrams
Try it free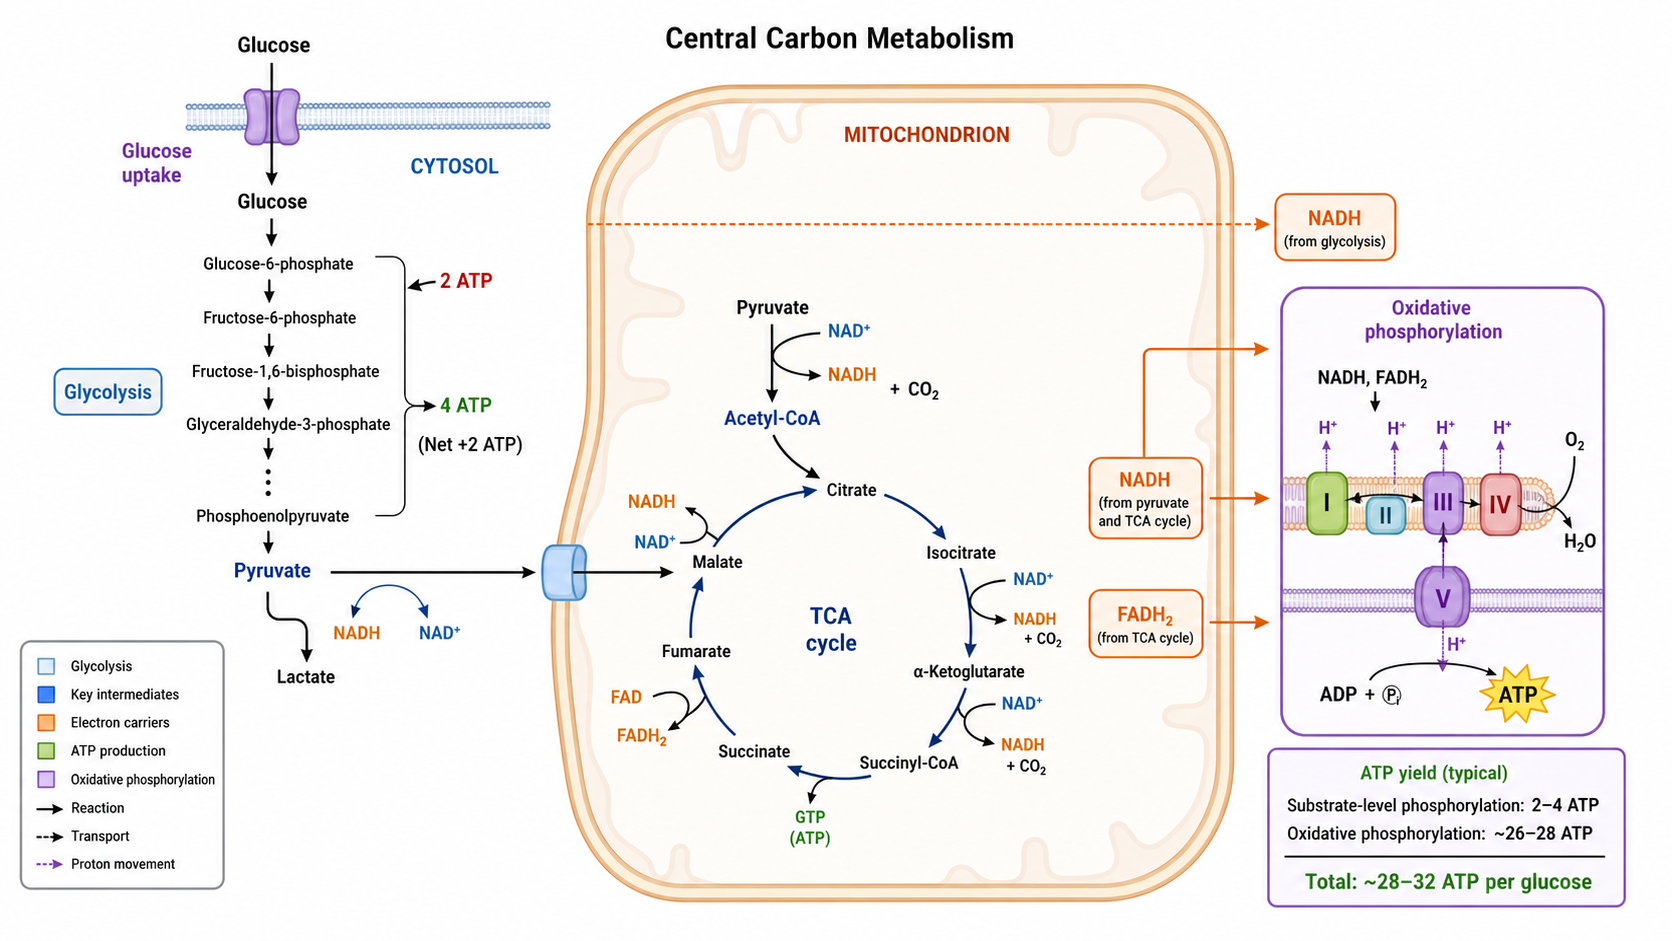
Metabolic Pathway Diagram Generator
Create metabolic pathway diagram visuals for central carbon metabolism, glycolysis, TCA links, flux arrows, compartments, and energy outputs.
Try it free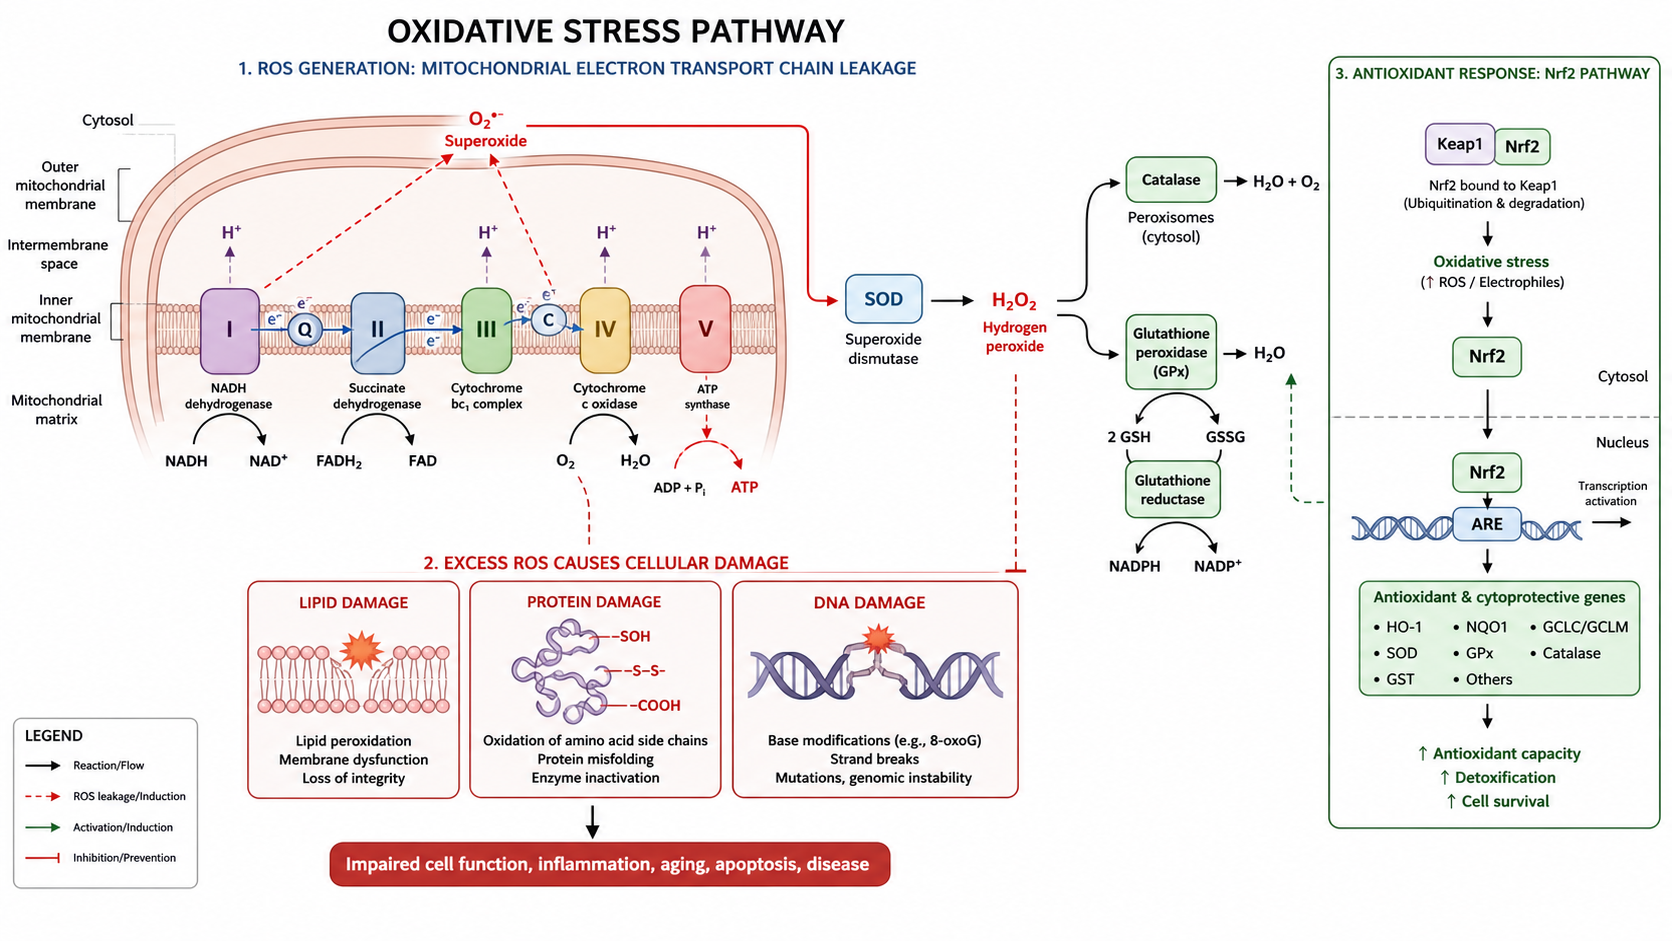
Oxidative Stress Pathway Diagram Generator
Create oxidative stress pathway diagram visuals for ROS sources, mitochondria, antioxidant enzymes, Nrf2 signaling, lipid peroxidation, inflammation, and cell outcomes.
Try it freeDraw your signaling pathway now
Describe any cascade and get a clean, labeled, publication-ready pathway figure in minutes.