Free Graphical Abstract Maker for Research Papers
Paste your abstract, generate a visual summary, and edit it for journal submission
Draft graphical abstracts, scientific infographics, and visual research summaries that explain study design, mechanisms, and key findings for journals, conferences, and lab communication.
Have your paper as a PDF?
Upload it and AI drafts a graphical-abstract prompt from your abstract — review and generate below.
Graphical Abstract Examples
Browse examples from different research fields, or generate your own above.
Graphical abstract and scientific infographic maker
This AI graphical abstract and scientific infographic maker turns a paper PDF, research abstract, or study summary into one structured visual. Use it for a journal graphical abstract, research infographic, paper infographic, or scientific visual summary that connects the research question, method, key result, and conclusion.
Why journals require graphical abstracts
- Increase paper visibility and discoverability in online searches
- Help readers quickly assess relevance before reading the full paper
- Improve social-media shareability and engagement
- Make complex findings accessible to non-specialist audiences
- Meet requirements from major publishers like Elsevier, Cell Press, and Wiley
How to create an effective graphical abstract
An effective graphical abstract tells the story of your research at a glance. Start with your main finding, then work backwards to show the key method and context. Use clear icons and minimal text, and follow your target journal's size requirements. SciDraw AI generates journal-ready graphical abstracts that follow these best practices automatically.
Common elements in graphical abstracts
- Research question or hypothesis visualization
- Key methodology or experimental design
- Main results shown with simple charts or diagrams
- Conclusion or key finding highlighted
- Arrows showing workflow or cause-and-effect
- Minimal text labels (typically under 100 words)
Graphical Abstract Maker FAQ
What is a graphical abstract?
A graphical abstract is a single visual summary of a research paper that highlights the key findings, methods, or conclusions. Many journals now require or encourage graphical abstracts alongside traditional text abstracts to improve discoverability and reader engagement.
What size and format do journals require for graphical abstracts?
Requirements vary by publisher. Common specs include 1200x1200 pixels for Elsevier, 16:9 ratio for Cell Press, and various sizes for Nature journals. SciDraw AI includes journal-specific presets so you can export at the correct dimensions automatically.
Do I need design skills to create a graphical abstract?
No. SciDraw AI generates a complete visual from your research description. You can refine colors, labels, and layout, but the AI handles the initial composition and scientific iconography.
Can I use AI-generated graphical abstracts in journal submissions?
Yes. The output is a standard image file (PNG, or editable SVG after conversion) that you create and own. Most journals accept AI-assisted visuals as long as the scientific content is accurate and the author takes responsibility for the figure.
How long does it take to create a graphical abstract?
Most users generate a first draft in under 60 seconds. Refinement and customization typically take another 5 to 15 minutes depending on complexity, compared to several hours using traditional design tools.
Can I edit the graphical abstract after generation?
Yes. You can regenerate with adjusted prompts, change styles, or export as SVG for further editing in tools like Adobe Illustrator or Inkscape.
Can I use this as a scientific infographic maker?
Yes. Upload a paper PDF or paste a research summary and ask for a scientific infographic, research visual summary, or paper infographic. The same workflow organizes the study question, method, evidence, and conclusion into one visual; use Medical Infographic Maker instead for patient education and public health communication.
Is the graphical abstract maker free?
You can try it for free. A new account gets 10 credits at sign-up, valid for one day, and then 5 free credits every day, which expire at the end of that day. A graphical abstract at the standard 2K resolution uses 5 credits, so that is two on your first day and one a day after that. Turning a PDF into a prompt costs nothing. If you need more, credit packs and plans are on the pricing page.
How accurate are the generated figures?
The AI draws and labels what you describe, but it does not check the science for you. Review every label, arrow and value before you use the figure, then fix anything that is off by refining your description and regenerating, or by adjusting it in the editor.
Explore More Tools
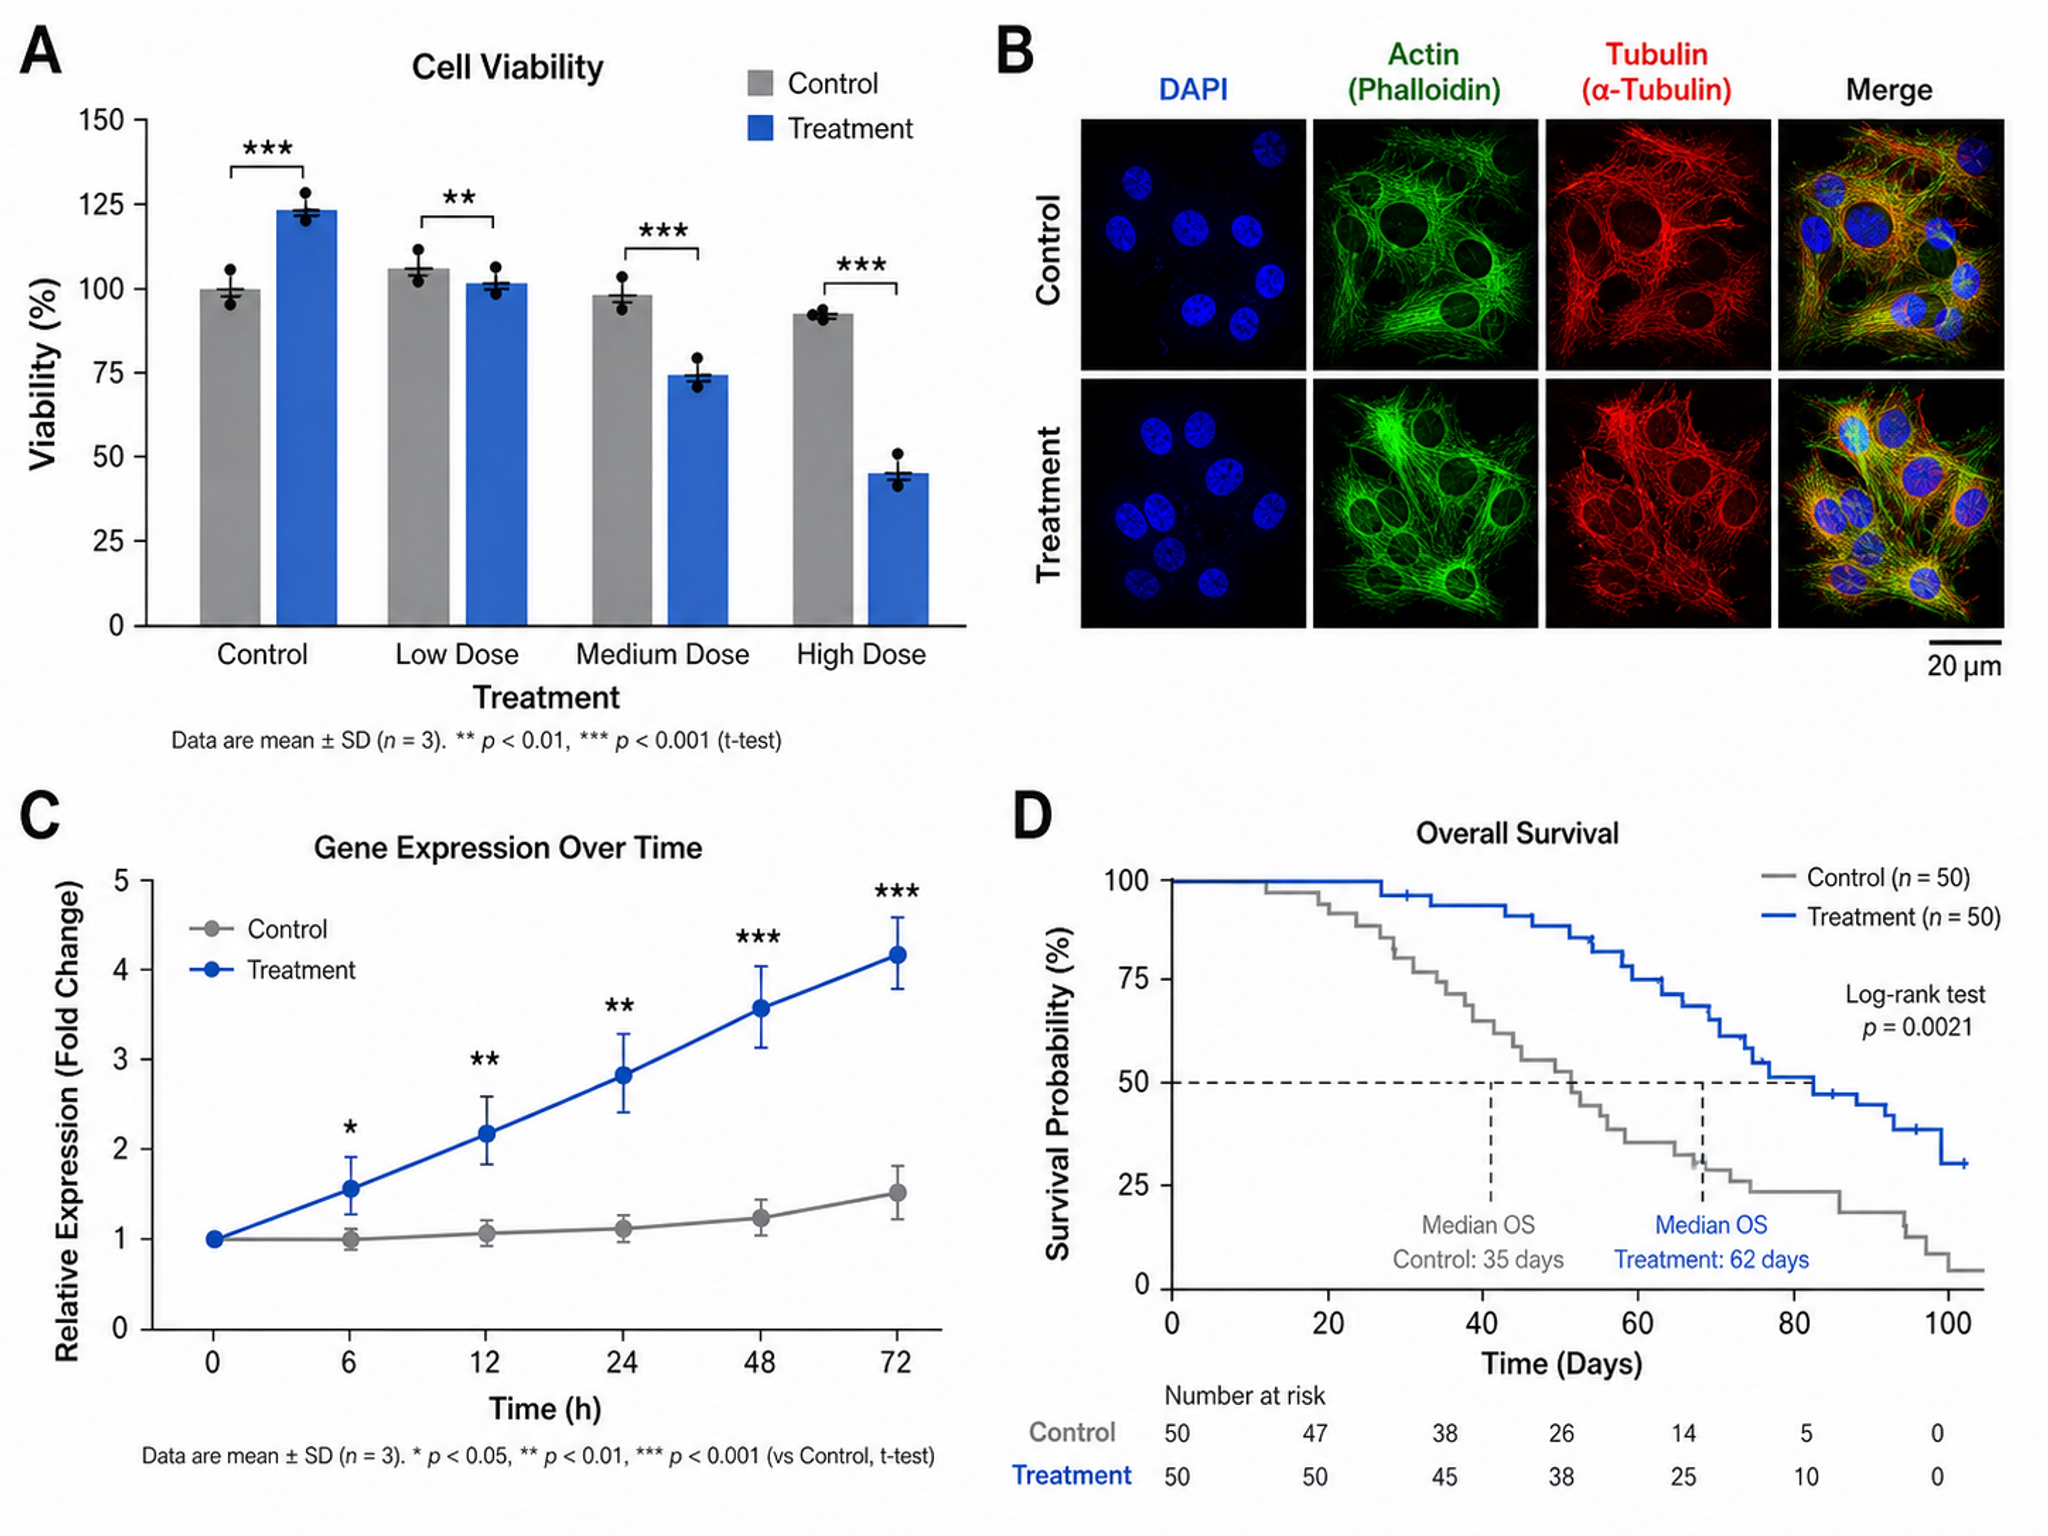
Scientific Figure Maker
Create publication-ready figures for research papers
Try it free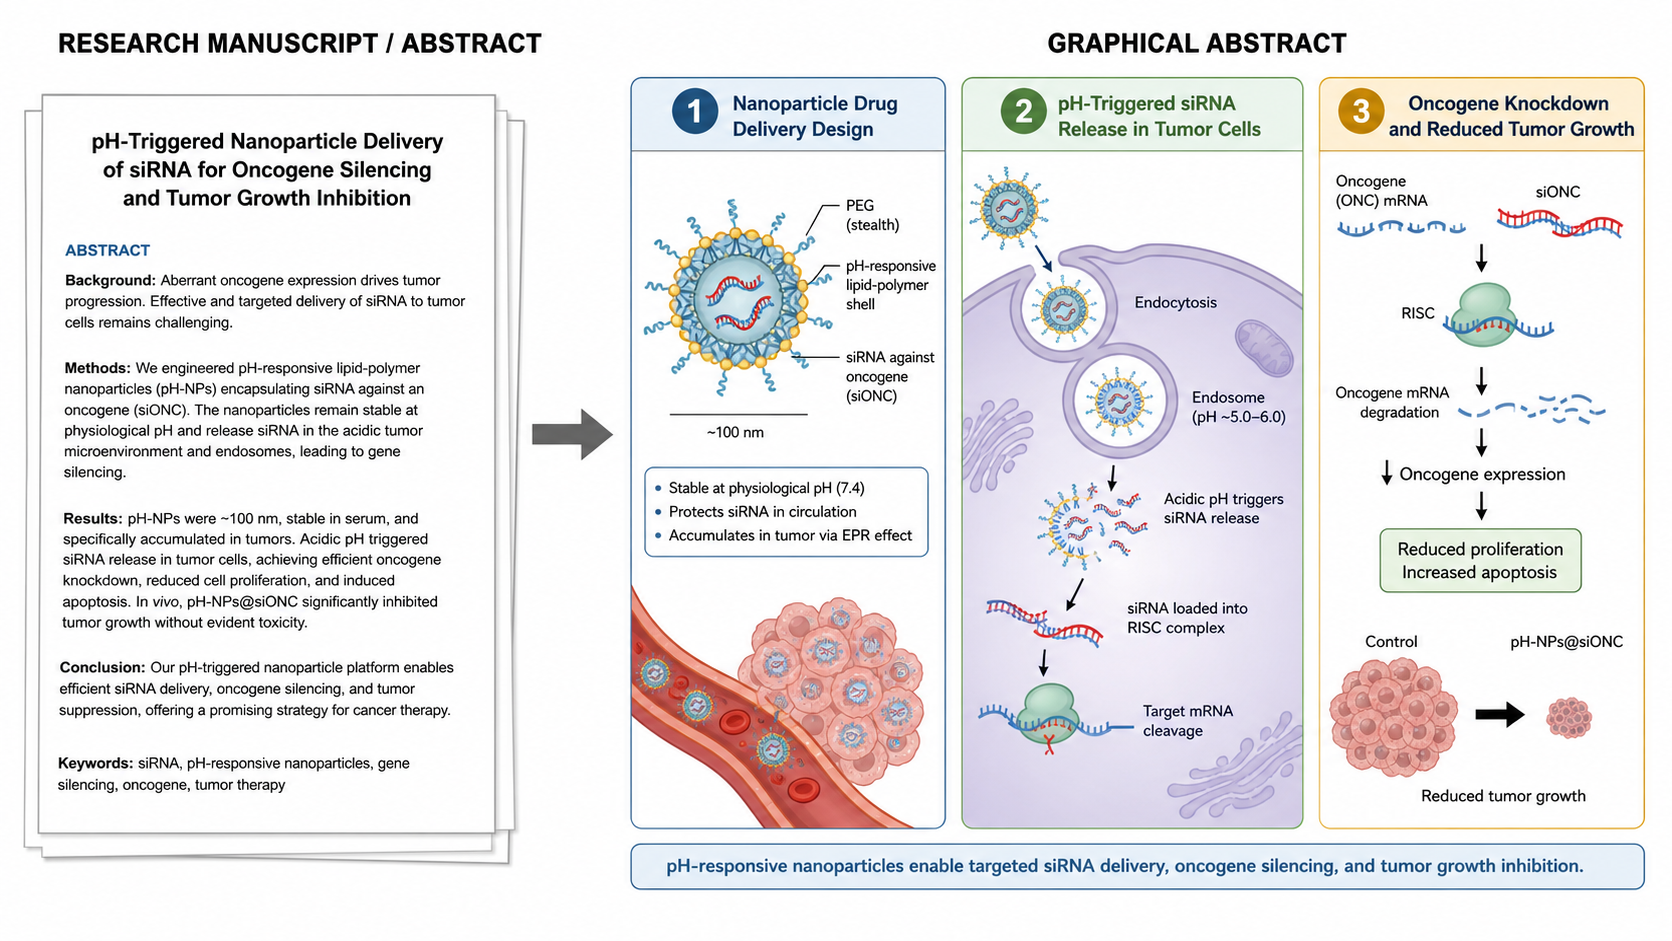
Manuscript to Figure Generator
Create manuscript to figure visuals for abstracts, methods, results, study workflows, graphical abstracts, and multi-panel paper figures.
Try it free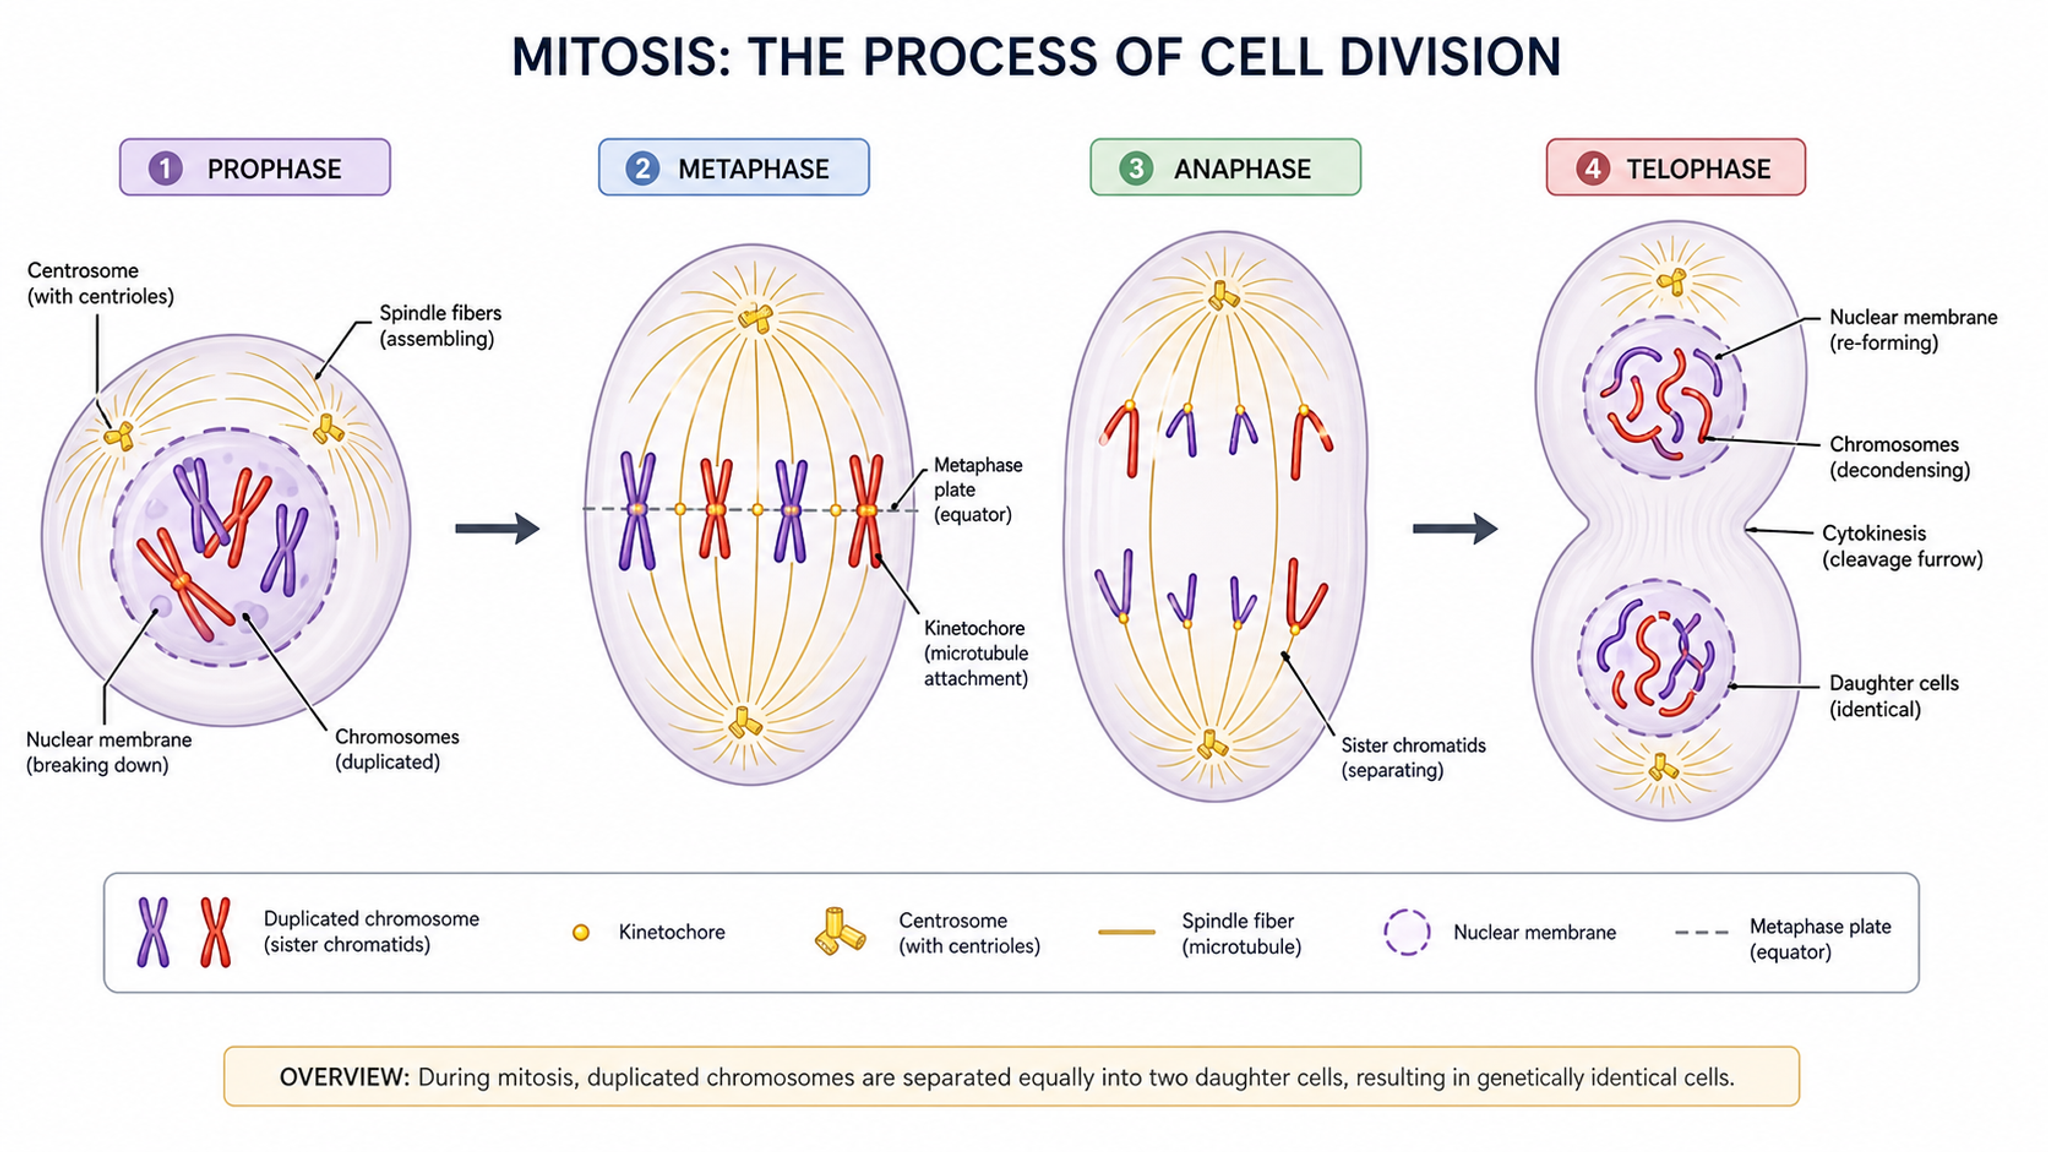
Scientific Diagram Maker
Create flowcharts, mechanism schematics, and pathway diagrams
Try it freeReady to Create Your First Graphical Abstract?
Join thousands of researchers who save hours on scientific illustration.