LogoLogoSciDraw AI
  • Start Creating
  • Tools
  • Blog
  • Pricing
  • Education Discount
LogoLogoSciDraw AI

AI-powered scientific figure platform for researchers, students, educators, and science communicators. Create publication- and classroom-ready figures, graphical abstracts, TOC graphics, posters, and teaching illustrations in minutes. No design skills required.

EmailYouTubeXGitHubLinkedInInstagramStripe ClimateStripe Climate Contribution
Tools
  • AI Drawing
  • Graphical Abstract Maker
  • Scientific Figure Maker
  • Image Converter
  • Vectorize Image
  • All Tools
Popular tools
  • Scientific Diagram Maker
  • Scientific Poster Maker
  • Research Poster Template
  • Plant Cell Diagram
  • Lewis Dot Structure Generator
  • Molecular Orbital Diagram Generator
  • PRISMA Flow Diagram Generator
  • Conceptual Framework Maker
Use Cases
  • For PhD Students
  • For Educators
  • For Journal Submission
  • BioRender Alternative
Resources
  • Blog
  • Gallery
  • Published references
  • Media Kit
  • Developers
Company
  • About
  • Pricing
  • Affiliate
  • Institutional invoicing
  • Privacy Policy
  • Terms of Service
© 2026 SciDraw AI All Rights Reserved.
How to Make a Forest Plot for a Meta-Analysis (2026 Guide)
2026/06/18

How to Make a Forest Plot for a Meta-Analysis (2026 Guide)

Make a publication-ready forest plot for a meta-analysis without coding. Plot odds ratios, risk ratios, or hazard ratios with confidence intervals, add study weights and a pooled diamond, and export — all by describing it to an AI.

You've extracted the effect sizes from every included study, computed your pooled estimate, and now you need the figure that is a meta-analysis to most readers: the forest plot. The traditional path runs through R's metafor or meta, or RevMan, and getting the columns, the diamond, and the weights to line up can eat an afternoon. This guide shows you how to make a forest plot for a meta-analysis by describing it in plain language, so the AI assembles the rows, the confidence intervals, and the pooled diamond while you focus on the synthesis.

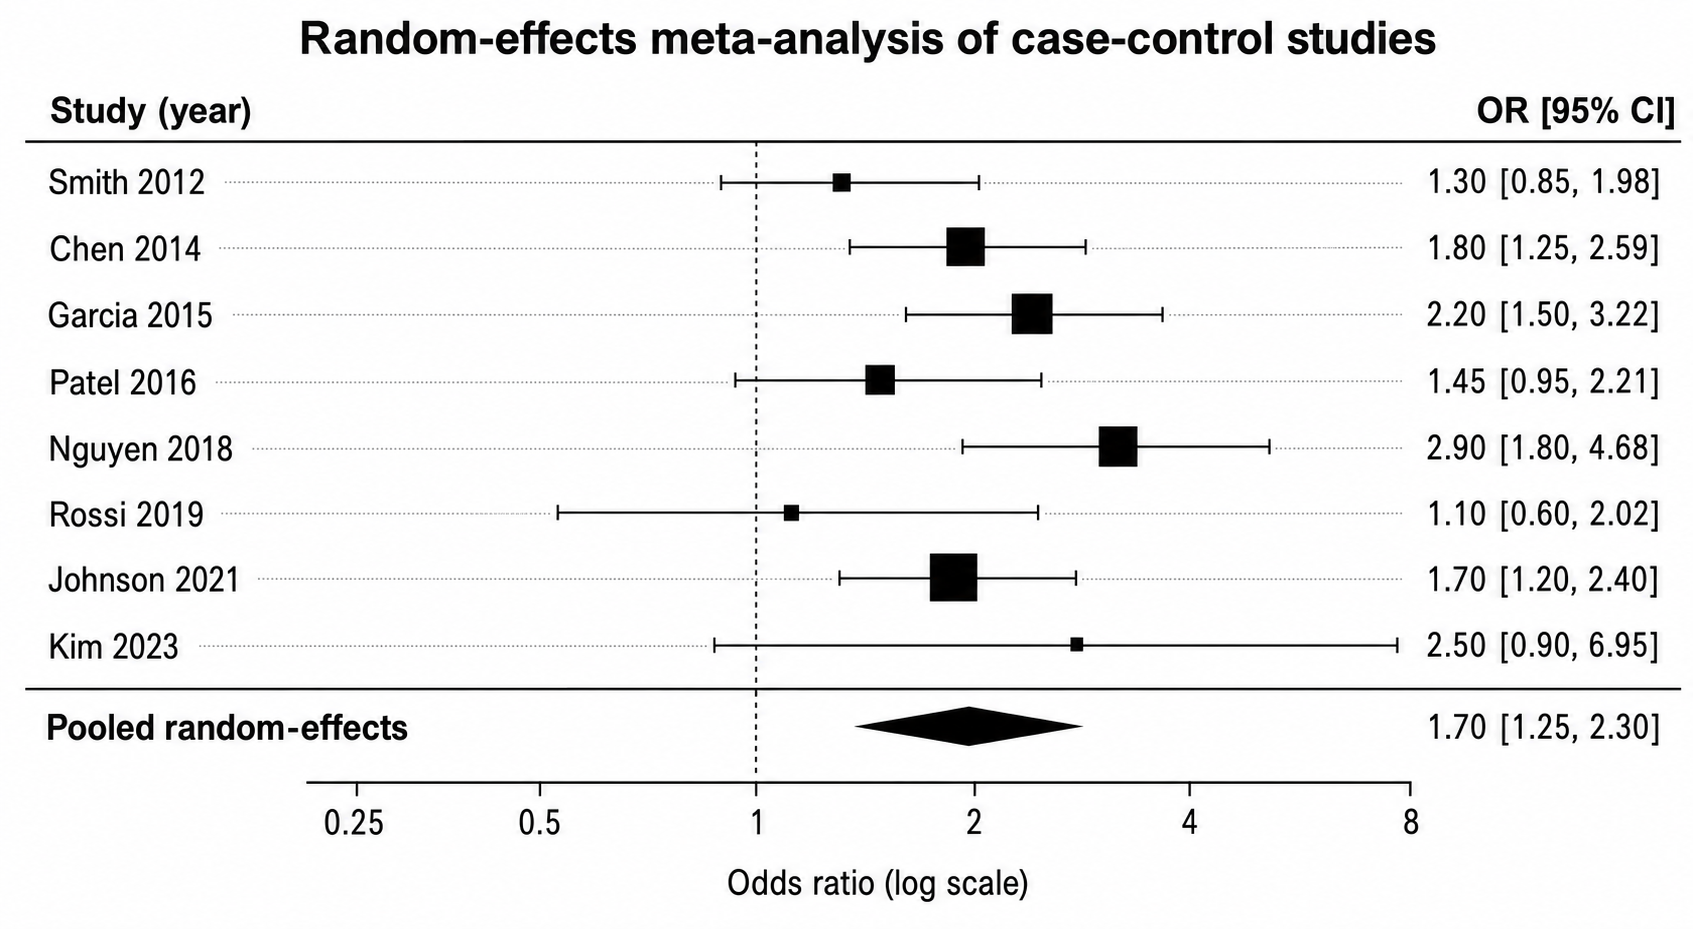
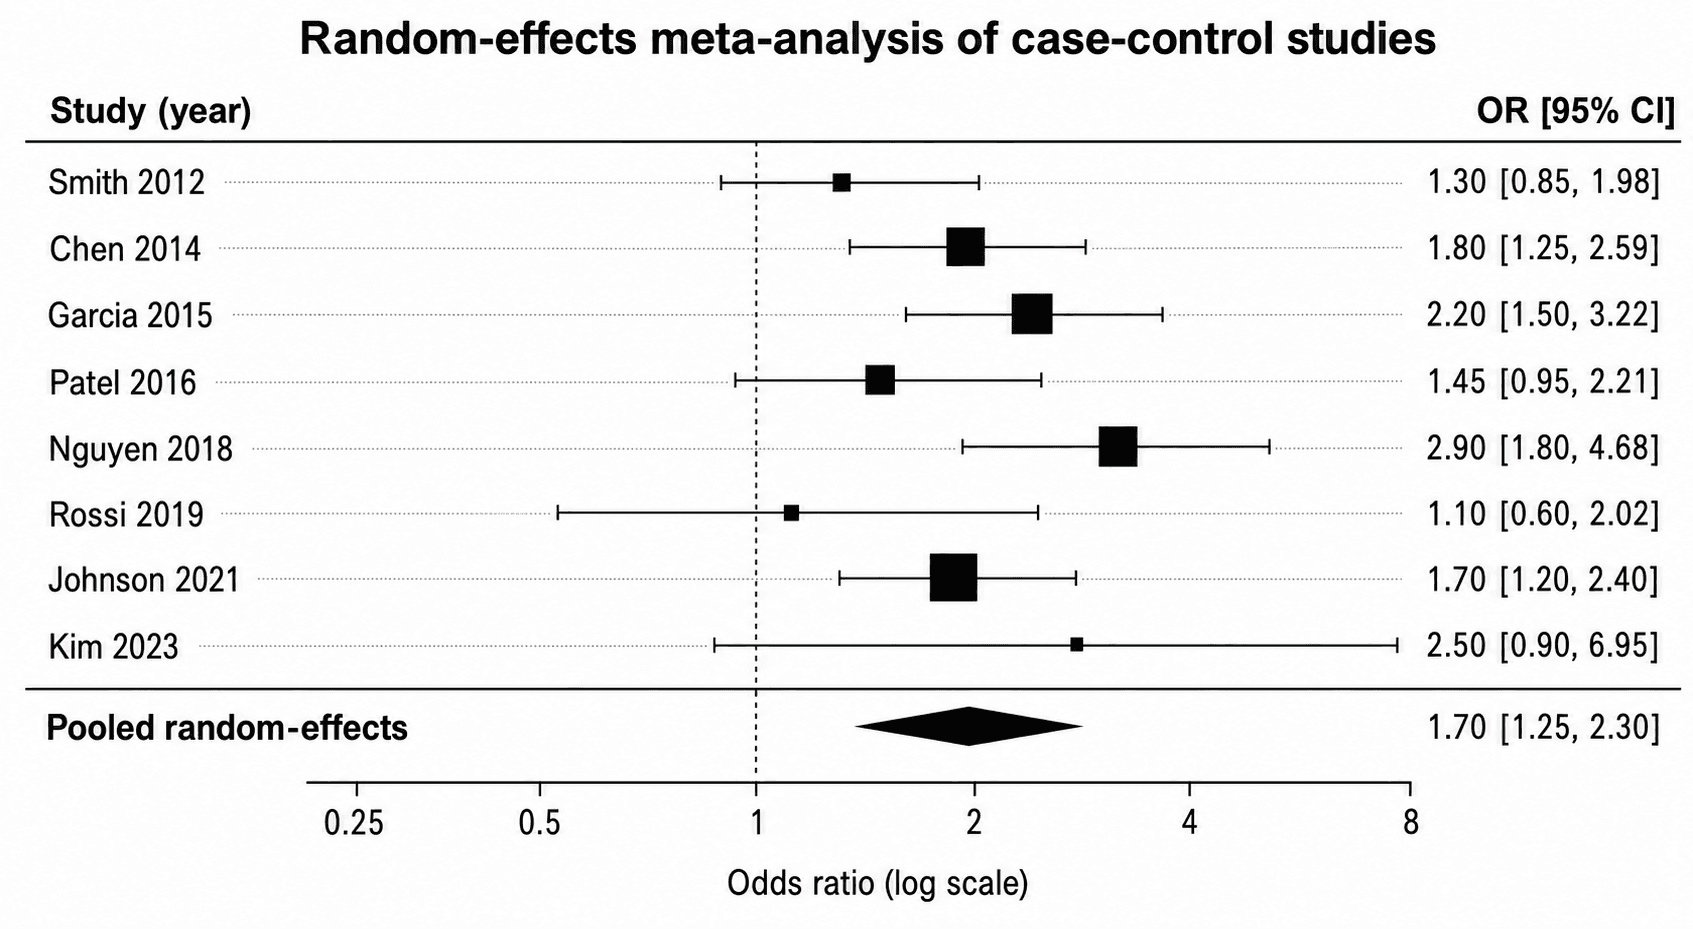
Publication-ready forest plot showing odds ratios with confidence intervals and a pooled effect diamond

By the end of this guide you'll be able to:

  • Make a forest plot for a meta-analysis with one row per study, point estimates, and confidence intervals — no coding.
  • Plot odds ratios, risk ratios, mean differences, or hazard ratios with a correctly placed line of no effect.
  • Add study weights, the pooled summary diamond, and heterogeneity statistics (I², τ²) where reviewers expect them.
  • Build subgroup forest plots and export a print-ready figure for your systematic review or journal submission.

Everything below happens inside the SciDraw AI editor using the forest plot generator — you supply the studies and effect sizes, the AI draws the plot, and you refine it with words.

What a forest plot communicates

A forest plot summarizes many studies in one vertical stack. Each row is one study: a square marks its effect estimate, a horizontal line shows the confidence interval, and the square's size reflects its weight in the meta-analysis. A vertical line of no effect (at 1 for ratios, 0 for differences) lets readers see at a glance which studies are significant. At the bottom, a diamond shows the pooled estimate — its center is the summary effect, its width the pooled confidence interval.

The figure has to make three things obvious: each study's effect and precision, how much each contributed, and what they say together. Get those right and the plot tells the whole story.

Step 1: Describe the forest plot you want

Open the editor and tell the AI the effect measure, the studies, and the structure. The effect measure determines where the null line sits and whether the axis is on a log scale, so state it up front.

Template: "Create a forest plot for a meta-analysis of [N] studies. Effect measure: [odds ratio / risk ratio / mean difference / hazard ratio]. Plot each study with its point estimate and 95% confidence interval, a square sized by weight, a vertical line of no effect at [1 / 0], and a pooled summary diamond at the bottom. Use a [log] x-axis."

A filled-in example:

  • "Create a forest plot for a meta-analysis of 8 randomized trials. Effect measure: odds ratio on a log x-axis. One row per study with the study name, OR and 95% CI as text on the right, a square sized by study weight, and a vertical dashed line of no effect at OR = 1. Add a pooled random-effects diamond at the bottom labeled 'Overall'."

Step 2: Enter the studies and effect sizes

Each row needs a label and an effect estimate with its interval. You can hand the AI a small table or list it inline.

  • "Add these studies as rows: Smith 2019, OR 1.42 (1.10–1.84); Lee 2020, OR 0.88 (0.61–1.27); Garcia 2021, OR 1.95 (1.30–2.93)..."
  • "Show the numeric OR and 95% CI in a right-hand column aligned to each row."
  • "Add a left-hand column with the first author and year for every study."

If your effect measure is continuous, switch the framing: "Use mean difference with the line of no effect at 0 and a linear x-axis."

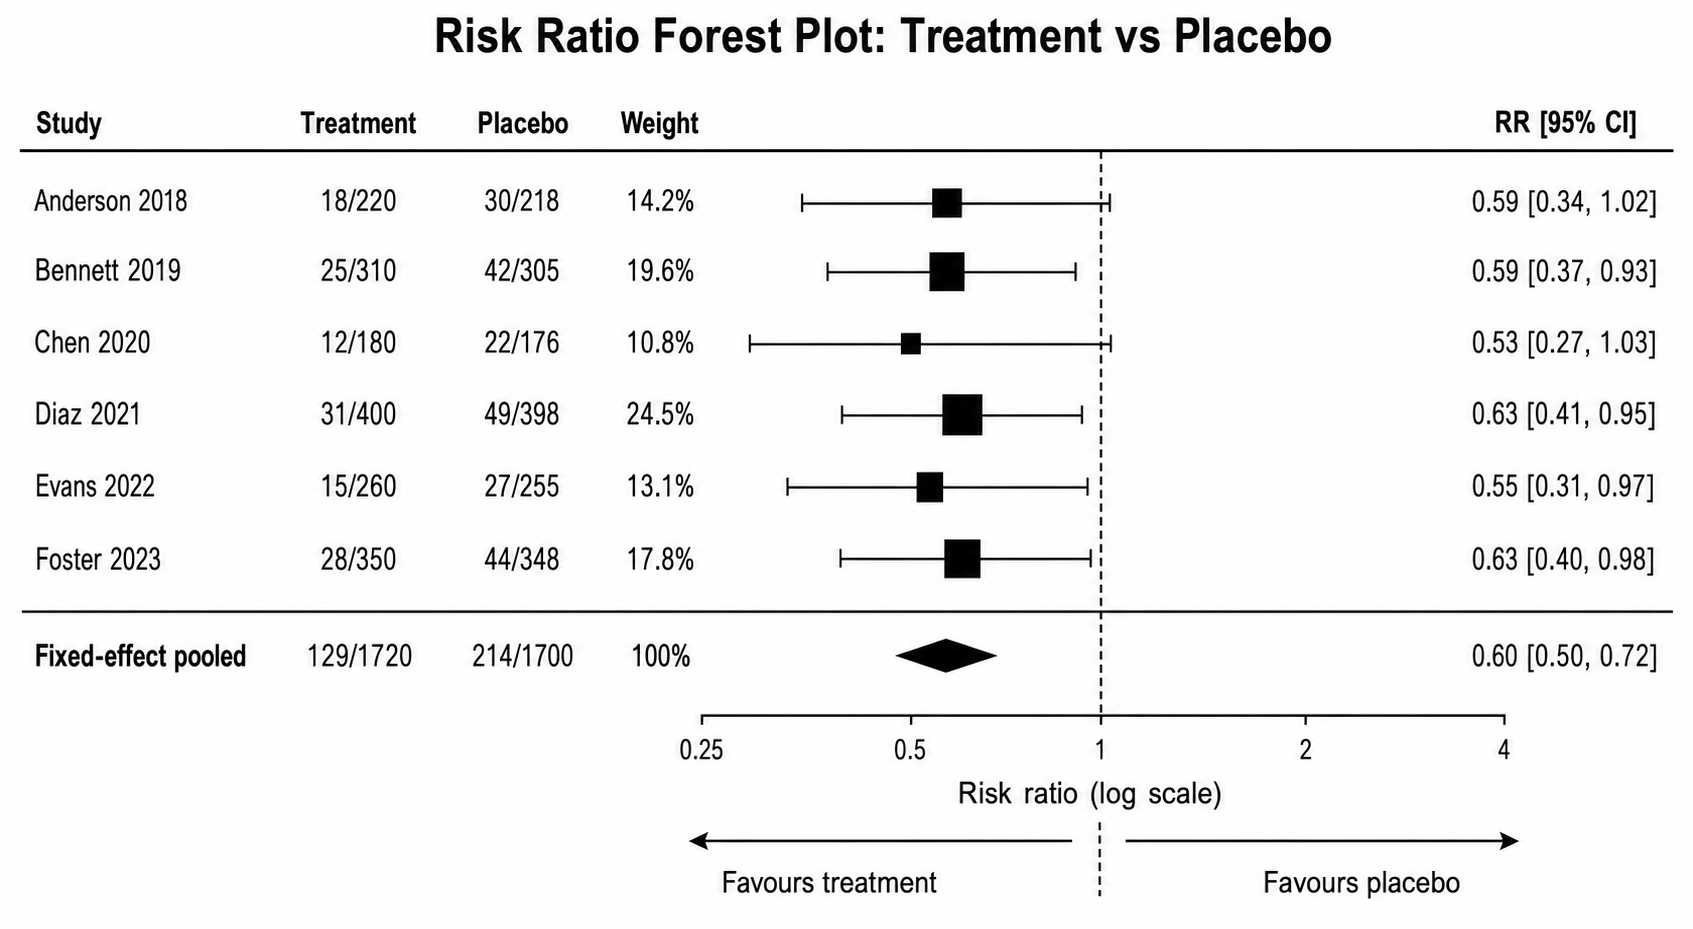
Forest plot displaying risk ratios per study with confidence interval lines and weighted squares

Step 3: Add weights, the pooled diamond, and heterogeneity

What separates a forest plot from a row of error bars is the meta-analytic detail. Ask for it explicitly:

  • "Size each study's square proportional to its weight and add a 'Weight (%)' column on the right."
  • "Add a random-effects pooled diamond at the bottom; its width is the 95% CI of the summary estimate."
  • "Add heterogeneity statistics under the diamond: I² = 38%, τ² = 0.04, p = 0.12."
  • "Label the pooled row 'Overall (random effects)'."

State whether your pooling is fixed-effect or random-effects — it changes the weights and the diamond, and reviewers will check.

Step 4: Add subgroups and direction labels

Many reviews split studies by subgroup (e.g., dose, region, risk of bias). The AI can group rows and give each subgroup its own subtotal diamond.

  • "Group the studies into two subgroups — 'High dose' and 'Low dose' — each with its own subtotal diamond, then an overall diamond at the very bottom."
  • "Add a subgroup heterogeneity test between the two subtotals."
  • "Add axis direction labels: 'Favors treatment' on the left, 'Favors control' on the right."

Direction labels under the axis are a small touch that stops readers from misreading which side helps. To polish any single label afterward, see how to edit text and labels in AI figures.

Common mistakes (and how to fix them)

  • Wrong line of no effect. A null line at 1 on a mean-difference plot is meaningless. Fix: "Put the line of no effect at 0 for mean differences and at 1 for ratio measures."
  • Linear axis for ratios. Odds and risk ratios are skewed on a linear scale. Fix: "Use a log scale for the x-axis so the confidence intervals look symmetric."
  • Missing study weights. Equal-sized squares hide which studies drive the result. Fix: "Size the squares by weight and add a weight column."
  • No pooled diamond. A stack of studies without a summary isn't a meta-analysis figure. Fix: "Add the pooled summary diamond at the bottom."
  • Omitting heterogeneity. Readers need I² and τ² to judge the synthesis. Fix: "Add I², τ², and the heterogeneity p-value below the diamond."
  • Unaligned columns. Study names, estimates, and CIs that don't line up look sloppy. Fix: "Align the study, estimate, CI, and weight columns into clean vertical lanes."

Export and use

When the plot is ready, export it for your target:

  • "Export this as a 300 DPI PNG sized for a full journal page width."
  • "Give me an SVG so I can edit it in Illustrator before submission."
  • "Export at high resolution with a white background for the supplementary file."

A forest plot is usually one figure in a larger systematic review package. Pair it with how to make a PRISMA flow diagram for your study-selection flow and how to make a CONSORT diagram if you're also reporting the trials themselves. Keep refining text with how to edit text and labels in AI figures. It all stays editable in the SciDraw AI editor.

Frequently asked questions

How do I make a forest plot for a meta-analysis without R or RevMan? Open the forest plot generator, state your effect measure (odds ratio, risk ratio, mean difference, or hazard ratio), list each study with its estimate and 95% CI, and the AI builds the rows, weights, and pooled diamond. You refine everything by typing instructions — no metafor or RevMan needed.

What's the difference between an odds ratio and a risk ratio forest plot? Both are ratio measures plotted on a log x-axis with the line of no effect at 1, so the layout is identical. The difference is in the underlying calculation and interpretation; just tell the generator which measure your data uses and it labels the axis accordingly.

Where does the line of no effect go? At 1 for ratio measures (odds ratio, risk ratio, hazard ratio) on a log scale, and at 0 for difference measures (mean difference, standardized mean difference) on a linear scale. Stating the effect measure up front places it correctly.

How do I show study weights on a forest plot? Ask the AI to size each study's square proportional to its weight and to add a "Weight (%)" column. Larger squares mean the study contributed more to the pooled estimate — a core convention of meta-analysis figures.

Can I make a subgroup forest plot? Yes. Tell the forest plot generator how to group the studies, and it creates separate subgroups, each with a subtotal diamond, plus an overall diamond and an optional subgroup heterogeneity test.

Make your forest plot now

Skip the RevMan setup. List your studies, name your effect measure, and let the AI assemble a clean, weighted, publication-ready forest plot with a pooled diamond. Open the forest plot generator or head straight to the SciDraw AI editor to make yours now.

All Posts

Author

avatar for Davie Chen / SciDraw AI
Davie Chen / SciDraw AI

Researcher

Davie Chen is a researcher at the Faculty of Animation and Intermedia, University of Arts in Poznan, studying generative AI for scientific figure creation, patent illustration, and manuscript drafting. SciDraw AI is one of the research-to-product tools built from this work.

Author profile

Categories

What a forest plot communicatesStep 1: Describe the forest plot you wantStep 2: Enter the studies and effect sizesStep 3: Add weights, the pooled diamond, and heterogeneityStep 4: Add subgroups and direction labelsCommon mistakes (and how to fix them)Export and useFrequently asked questionsMake your forest plot now

More Posts

Create your scientific figures with AI

Thousands of researchers use SciDraw AI to make publication-ready figures for papers, grants, and journal submissions — in minutes, with no design skills.

Start for free
Tutorials
How to Make a Kaplan-Meier Plot for Survival Analysis (2026)
Tutorials

How to Make a Kaplan-Meier Plot for Survival Analysis (2026)

Make a publication-ready Kaplan-Meier survival curve without coding. Add step-down curves, censoring marks, a number-at-risk table, the log-rank p-value, and confidence bands — all by describing it to an AI.

avatar for Davie Chen / SciDraw AI
Davie Chen / SciDraw AI
2026/06/18
How to Make a Volcano Plot for RNA-seq & Differential Expression (2026)
Tutorials

How to Make a Volcano Plot for RNA-seq & Differential Expression (2026)

Make a publication-ready volcano plot for RNA-seq or differential expression without coding. Set log2 fold-change and adjusted p-value thresholds, color up- and down-regulated genes, label your hits, and export — all by describing it to an AI.

avatar for Davie Chen / SciDraw AI
Davie Chen / SciDraw AI
2026/06/18
How to Make a Dichotomous Key: Step-by-Step with Examples
Tutorials

How to Make a Dichotomous Key: Step-by-Step with Examples

Learn how to make a dichotomous key with clear paired choices. Includes leaf and animal examples, a reusable template, prompt, and accuracy checklist.

avatar for Davie Chen / SciDraw AI
Davie Chen / SciDraw AI
2026/07/18
Explore Our Tools
Scientific Figure Maker·Graphical Abstract Maker·AI Scientific Illustration·Figure Checker