Forest Plot Generator
Turn study-level meta-analysis data into a publication-ready figure
Describe your meta-analysis or systematic-review results — study names, effect sizes, and 95% confidence intervals — and AI draws a clean forest plot with weighted points, CI whiskers, a no-effect reference line, and a pooled summary diamond, ready for manuscripts and talks.
Forest plot examples
Click any example to load its prompt, or use it as a starting point for your own forest plot.
What does this forest plot generator do?
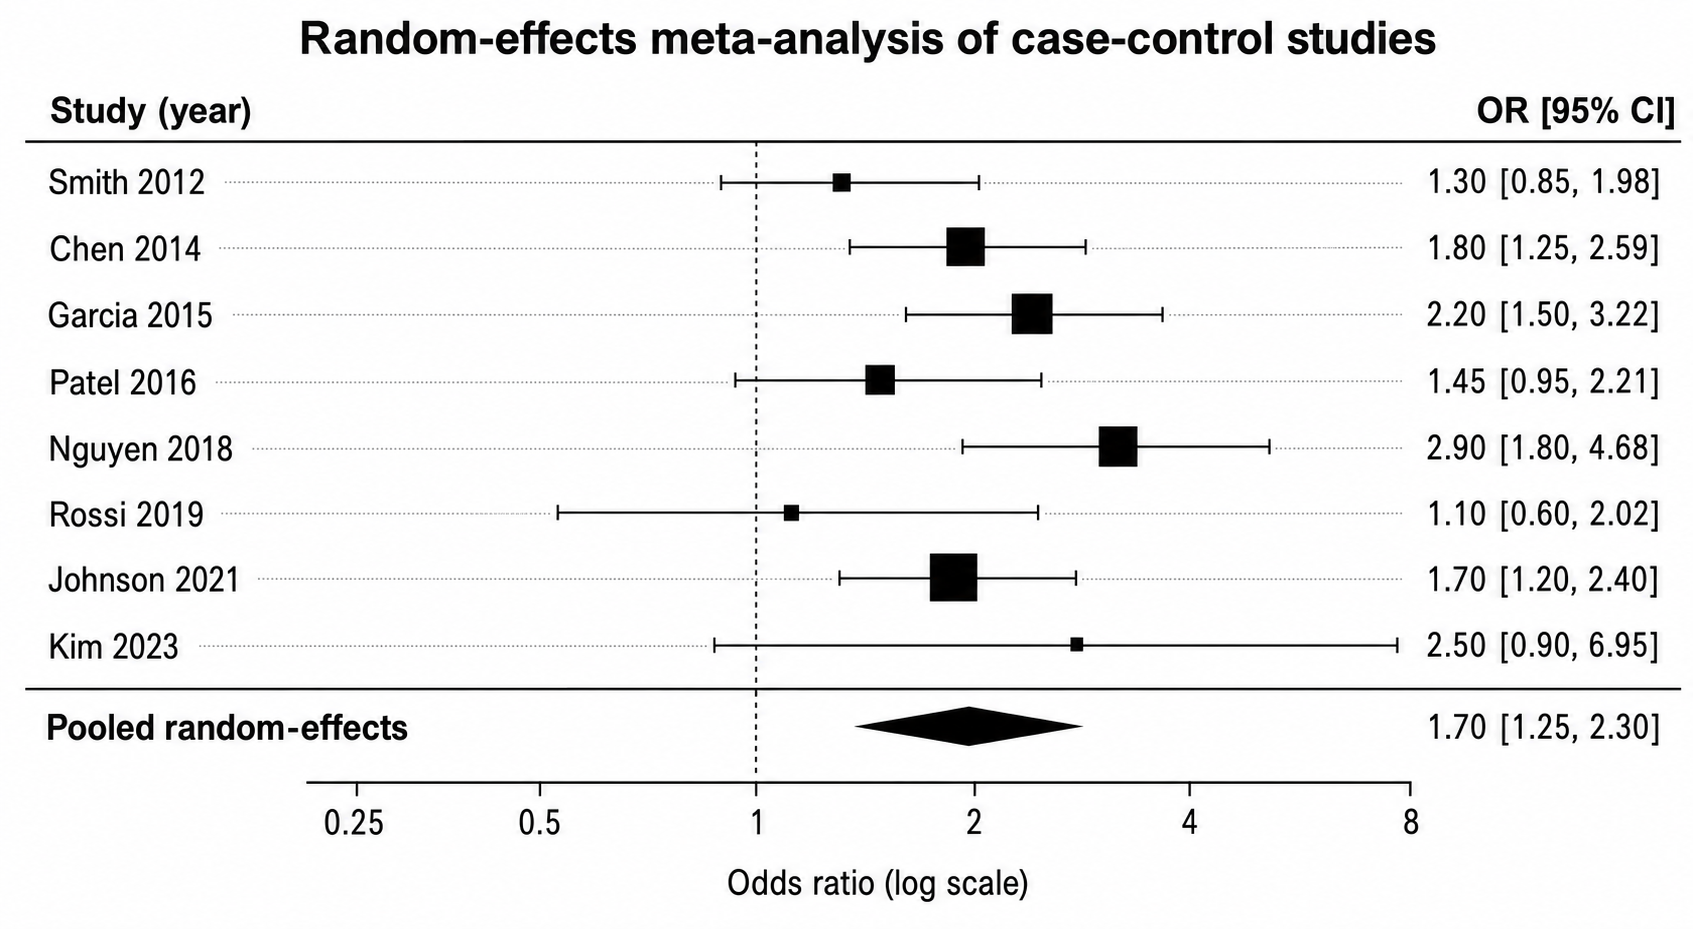
It turns a description of your meta-analysis results into a clean, labeled forest plot — the figure that shows each study's effect size as a point with horizontal 95% confidence-interval whiskers, points often sized by study weight, a vertical no-effect reference line, and a pooled summary diamond at the bottom. You describe your studies, effect measure, and intervals, and the AI draws the points, whiskers, reference line, labels, and diamond so the pattern across studies is clear at a glance. SciDraw AI helps you draw and beautify the figure; the statistical modeling, heterogeneity assessment, and systematic-review methodology stay with you or your dedicated meta-analysis software.
Why use a forest plot generator
- Forest plots are the standard way to display meta-analysis and systematic-review results in one figure.
- Laying out study labels, weighted points, CI whiskers, and a summary diamond by hand is fiddly and slow.
- A clear no-effect line and pooled diamond make the overall direction and precision obvious to any reader.
- Reviewers and journals expect a clean, readable forest plot for papers, posters, and talks.
- Regenerating from a description is faster than re-styling a plot every time labels or groupings change.
How to make a forest plot
Describe your effect measure — odds ratio, risk ratio, hazard ratio, or mean difference — and choose a log scale for ratio measures or a linear scale for differences. List your studies with their effect sizes and 95% confidence intervals, set the no-effect reference line (1 for ratios, 0 for differences), and say whether points should be sized by study weight. Note any subgroups and the pooled (fixed- or random-effects) summary diamond to show. Generate the figure, then check the values, intervals, and labels against your analysis and refine. Compute the pooled estimates and heterogeneity in your stats tool first; the generator draws what you specify.
Parts of a forest plot
- Study labels — study names, often with years or sample sizes, listed on the left.
- Effect points — each study's effect size, often sized by its weight in the analysis.
- Confidence intervals — horizontal whiskers showing each study's 95% CI.
- No-effect line — a vertical reference at 1 for ratio measures or 0 for differences.
- Summary diamond — the pooled fixed- or random-effects estimate at the bottom.
- Subgroup rows — grouped studies with per-subgroup summaries where used.
Forest Plot Generator FAQ
What is a forest plot?
A forest plot is a figure used in meta-analysis and systematic reviews to show the effect size of each study as a point with horizontal 95% confidence-interval whiskers, against a vertical no-effect reference line. A summary diamond at the bottom represents the pooled fixed- or random-effects estimate.
What data do I need for a forest plot?
For each study you need an effect size (such as an odds ratio, risk ratio, hazard ratio, or mean difference), its 95% confidence interval, and a study label. To draw the summary diamond you also provide the pooled estimate and its interval, and optionally each study's weight.
Which effect measures are supported?
You can describe odds ratios, risk ratios, hazard ratios, mean differences, or proportions like prevalence. Use a log scale for ratio measures, with the no-effect line at 1, and a linear scale for differences, with the line at 0.
Can it show subgroups and a pooled summary?
Yes. You can group studies into subgroups with a summary diamond per subgroup plus an overall pooled diamond, and note the heterogeneity (for example I²). The diamonds show the estimates you provide.
Does it compute the meta-analysis statistics for me?
No. SciDraw AI helps you draw and beautify the figure. The pooled effect, weights, heterogeneity (I²), and systematic-review methodology should come from you or a dedicated meta-analysis tool; the generator renders the values you supply.
Can I export an editable figure?
SciDraw AI can export to vector formats so you can fine-tune labels, scales, and confidence intervals afterwards. Always check the figure against your underlying analysis before submitting.
Explore More Tools


Need other research figures?
Generate PRISMA flow diagrams, survival curves, volcano plots, and other research figures with SciDraw AI.