Strumento Gratuito AI per Infografiche Mediche
Infografiche per l'educazione del paziente, l'assistenza sanitaria e la salute pubblica
Crea bozze di infografiche mediche per materiale informativo per i pazienti, spiegazioni dei trattamenti, materiali per l'alfabetizzazione sanitaria, sintesi epidemiologiche e comunicazione della salute pubblica, con revisione da parte di esperti prima dell'uso.
Esempi di Infografiche Mediche
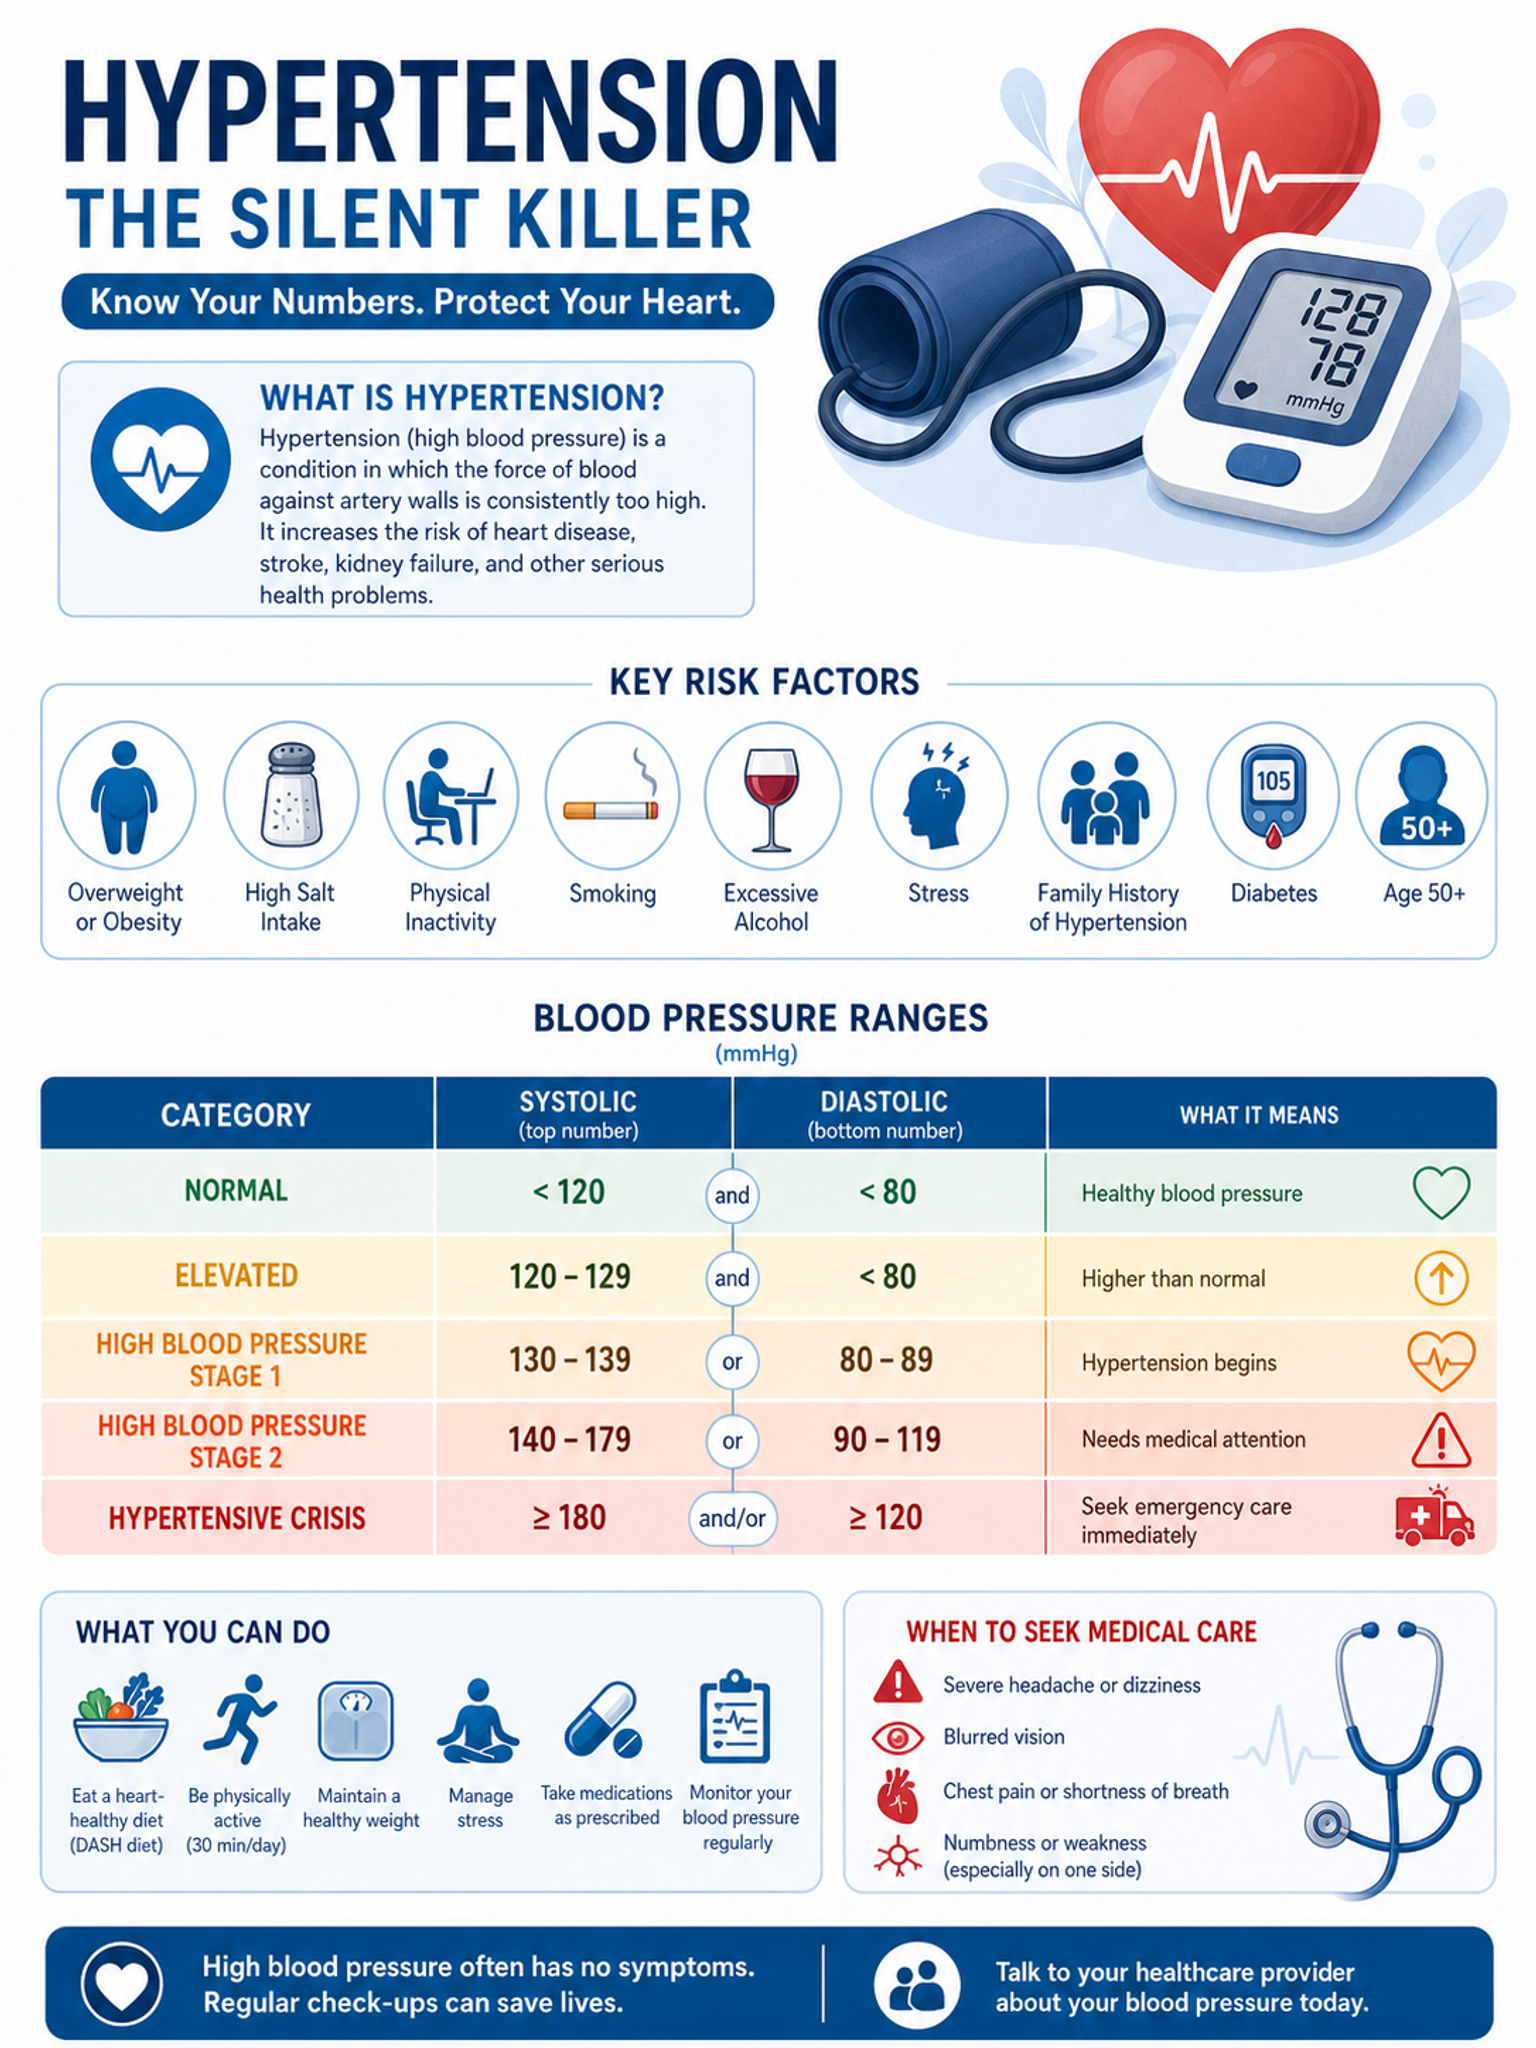
Sfoglia esempi per vari argomenti sanitari, o genera il tuo qui sopra.
Cosa può fare questo strumento AI per infografiche mediche?
Questo strumento AI per infografiche mediche trasforma un concetto clinico, una statistica sanitaria o un argomento di educazione del paziente in un visual chiaro e strutturato. Organizza meccanismi farmacologici, opzioni terapeutiche, sensibilizzazione alle malattie, dati di salute pubblica e istruzioni per i pazienti in sezioni accessibili con semplici icone mediche ed etichette leggibili — pronto per la revisione degli esperti prima della pubblicazione, dell'uso con i pazienti o della formazione clinica.
Perché le infografiche mediche sono importanti
- Rendono le informazioni cliniche complesse comprensibili per pazienti e familiari
- Migliorano l'alfabetizzazione sanitaria e l'aderenza al trattamento con visual chiari
- Comunicano le linee guida di salute pubblica e i passaggi di prevenzione a colpo d'occhio
- Supportano dispense per l'educazione del paziente, portali e display nelle sale d'attesa
- Aiutano clinici ed educatori a spiegare rapidamente condizioni, procedure e dati
Come creare un'infografica medica efficace
Un'infografica medica efficace inizia con un messaggio chiaro, poi suddivide i dettagli di supporto in sezioni brevi e scansionabili con icone semplici e codifica cromatica accessibile. Mantieni un linguaggio semplice per i visual rivolti ai pazienti e preciso per il pubblico clinico, e fai sempre revisionare l'accuratezza da un professionista medico prima dell'uso. SciDraw AI genera bozze di infografiche mediche strutturate e pronte per la revisione che seguono automaticamente queste best practice.
Elementi comuni nelle infografiche mediche
- Un titolo chiaro che indica la condizione, la procedura o il messaggio chiave
- Semplici icone mediche abbinate a etichette brevi
- Layout a sezioni per sintomi, cause, trattamento o prevenzione
- Codifica cromatica accessibile e sicura per i daltonici per gravità o categorie
- Grafici o statistiche per dati epidemiologici e di outcome
- Un footer con indicazioni su quando rivolgersi a un professionista sanitario
Domande Frequenti
SciDraw AI può creare bozze di diagrammi medici?
Sì. SciDraw AI genera bozze di illustrazioni anatomiche, diagrammi di organi e visual di processi fisiologici. Le immagini mediche generate dall'AI devono sempre essere revisionate da un professionista medico prima della pubblicazione, dell'uso con i pazienti o della formazione clinica.
Quali tipi di infografiche mediche posso creare?
Puoi creare diagrammi di meccanismi farmacologici, schemi di workflow clinici, materiali per l'educazione del paziente, panoramiche di procedure chirurgiche, visual di dati epidemiologici, cronologie di trattamento, diagrammi anatomici e infografiche di salute pubblica.
Posso usare queste infografiche in pubblicazioni mediche?
Sì. Esporta in formati ad alta risoluzione (300+ DPI) adatti per sottomissioni a riviste, poster congressuali e libri di testo medici. Le esportazioni SVG consentono ulteriori modifiche in strumenti di design professionale.
SciDraw AI è adatto per i materiali di educazione del paziente?
Assolutamente sì. Puoi regolare il livello di complessità per creare visual semplificati e accessibili al paziente dallo stesso concetto medico. Questo è ideale per dispense cliniche, portali dei pazienti e programmi di alfabetizzazione sanitaria.
Posso personalizzare colori e brand?
Sì. Scegli tra palette cromatiche appropriate per ambito medico, aggiungi il logo del tuo istituto e abbina le linee guida del brand della tua organizzazione. Sono disponibili anche opzioni sicure per i daltonici per l'accessibilità.
Come si confronta con Canva o BioRender per le infografiche mediche?
SciDraw AI combina la generazione AI con il prompting nel dominio medico. A differenza di strumenti di design generici come Canva, SciDraw AI può seguire la terminologia medica e le convenzioni di layout. A differenza di BioRender, che si concentra fortemente sugli asset biologici, SciDraw AI supporta bozze di infografiche mediche dai workflow clinici all'educazione del paziente.
Scopri altri strumenti

Generatore di illustrazioni mediche
Crea diagrammi anatomici, schemi clinici e visual didattici
Provalo gratis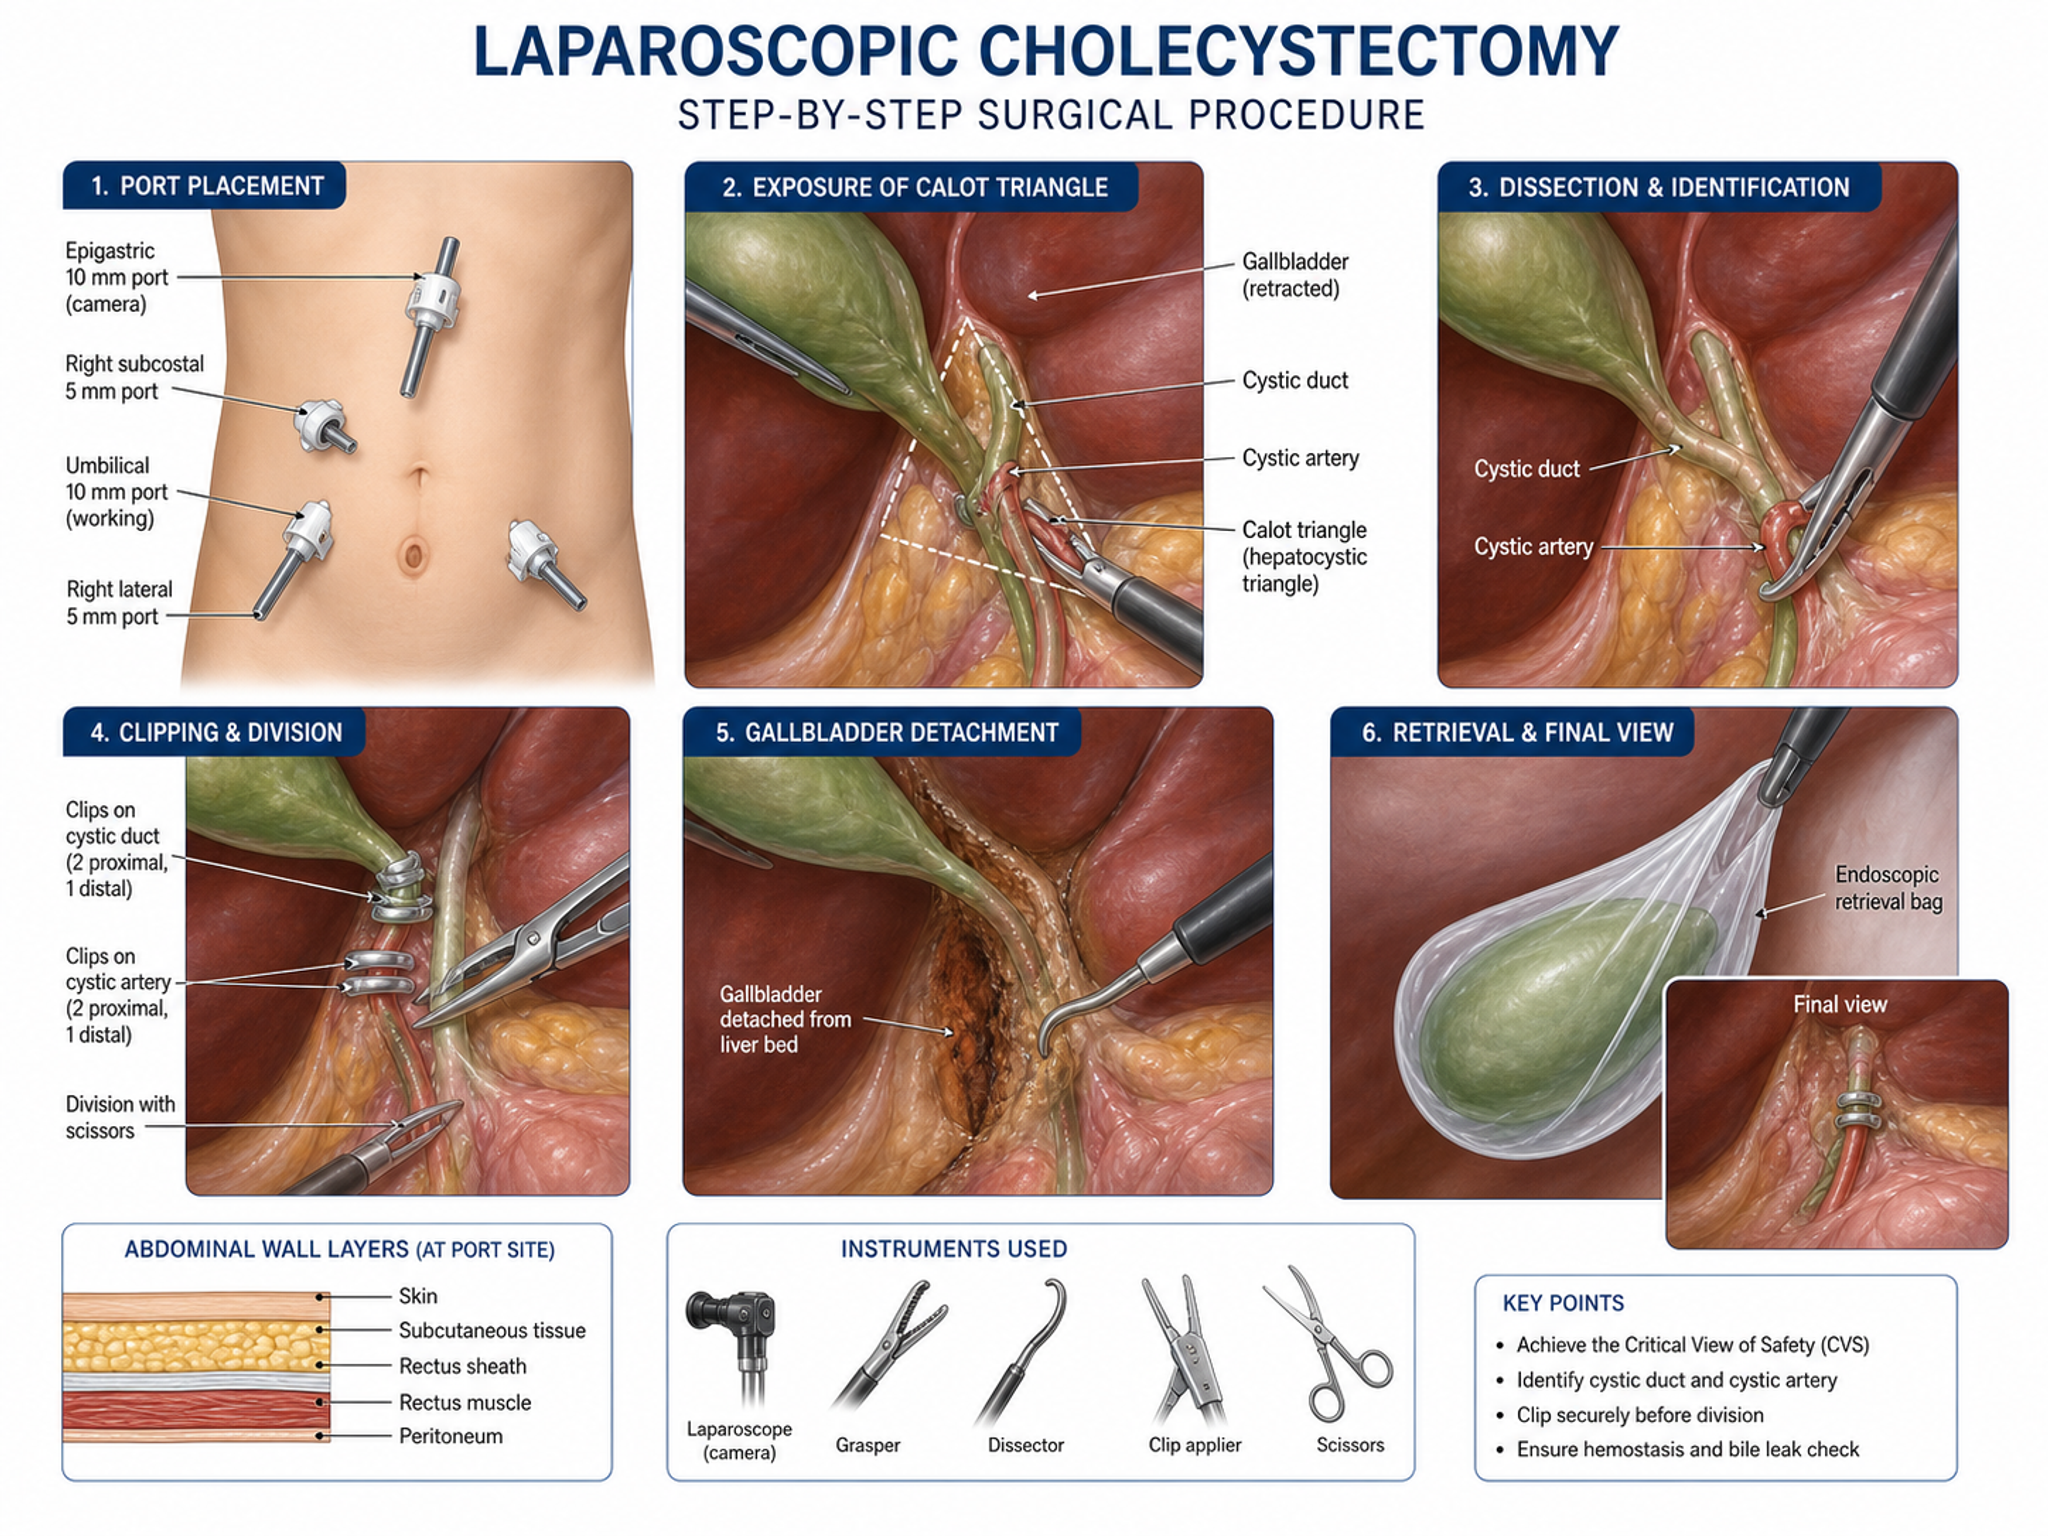
Generatore di Illustrazioni Cliniche
Crea diagrammi anatomici e figure per procedure chirurgiche
Provalo gratis
Generatore di diagrammi di anatomia
Crea diagrammi di anatomia etichettati del corpo umano, degli organi e dei sistemi con l'IA.
Provalo gratisCrea la tua prossima infografica medica
Unisciti ai professionisti sanitari ed educatori che creano visual medici più velocemente con SciDraw AI.