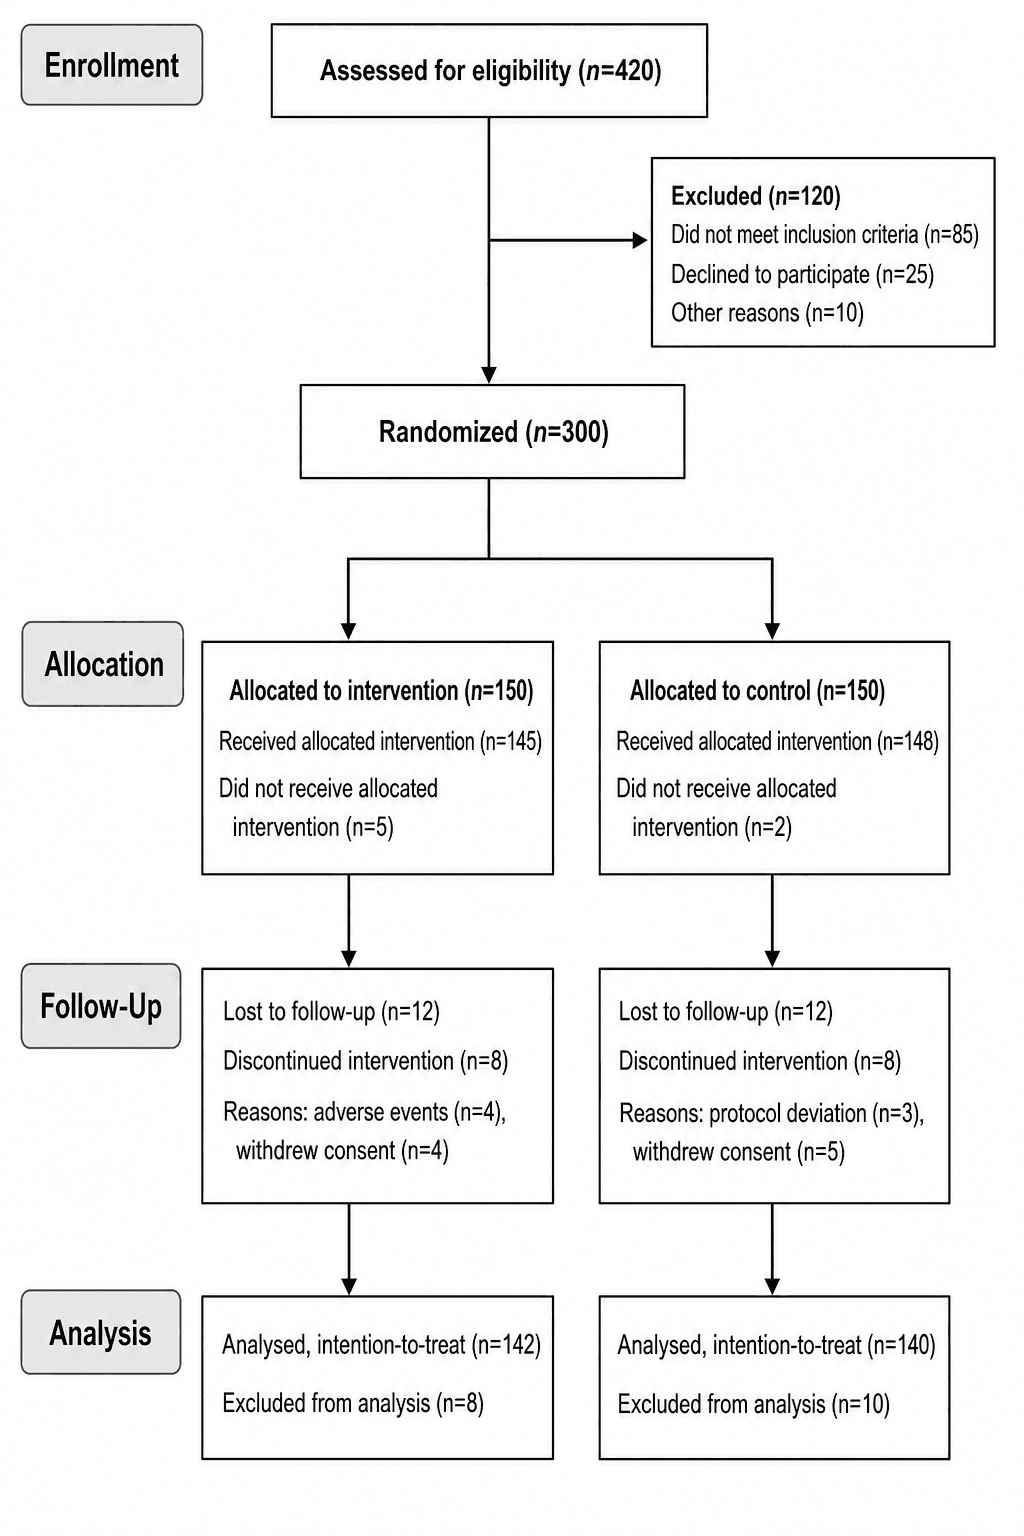
You finished your randomized controlled trial, and now you need the figure every journal requires before they'll even read your results: the CONSORT flow diagram. Built by hand in PowerPoint or Illustrator, it's a fiddly grid of boxes and arrows that breaks the moment your numbers change. This guide shows you how to make a CONSORT diagram for a randomized trial by describing it in plain language, so the AI lays out the four stages — enrollment, allocation, follow-up, and analysis — with the counts and exclusion reasons in the right place, and keeps them editable when your numbers move.
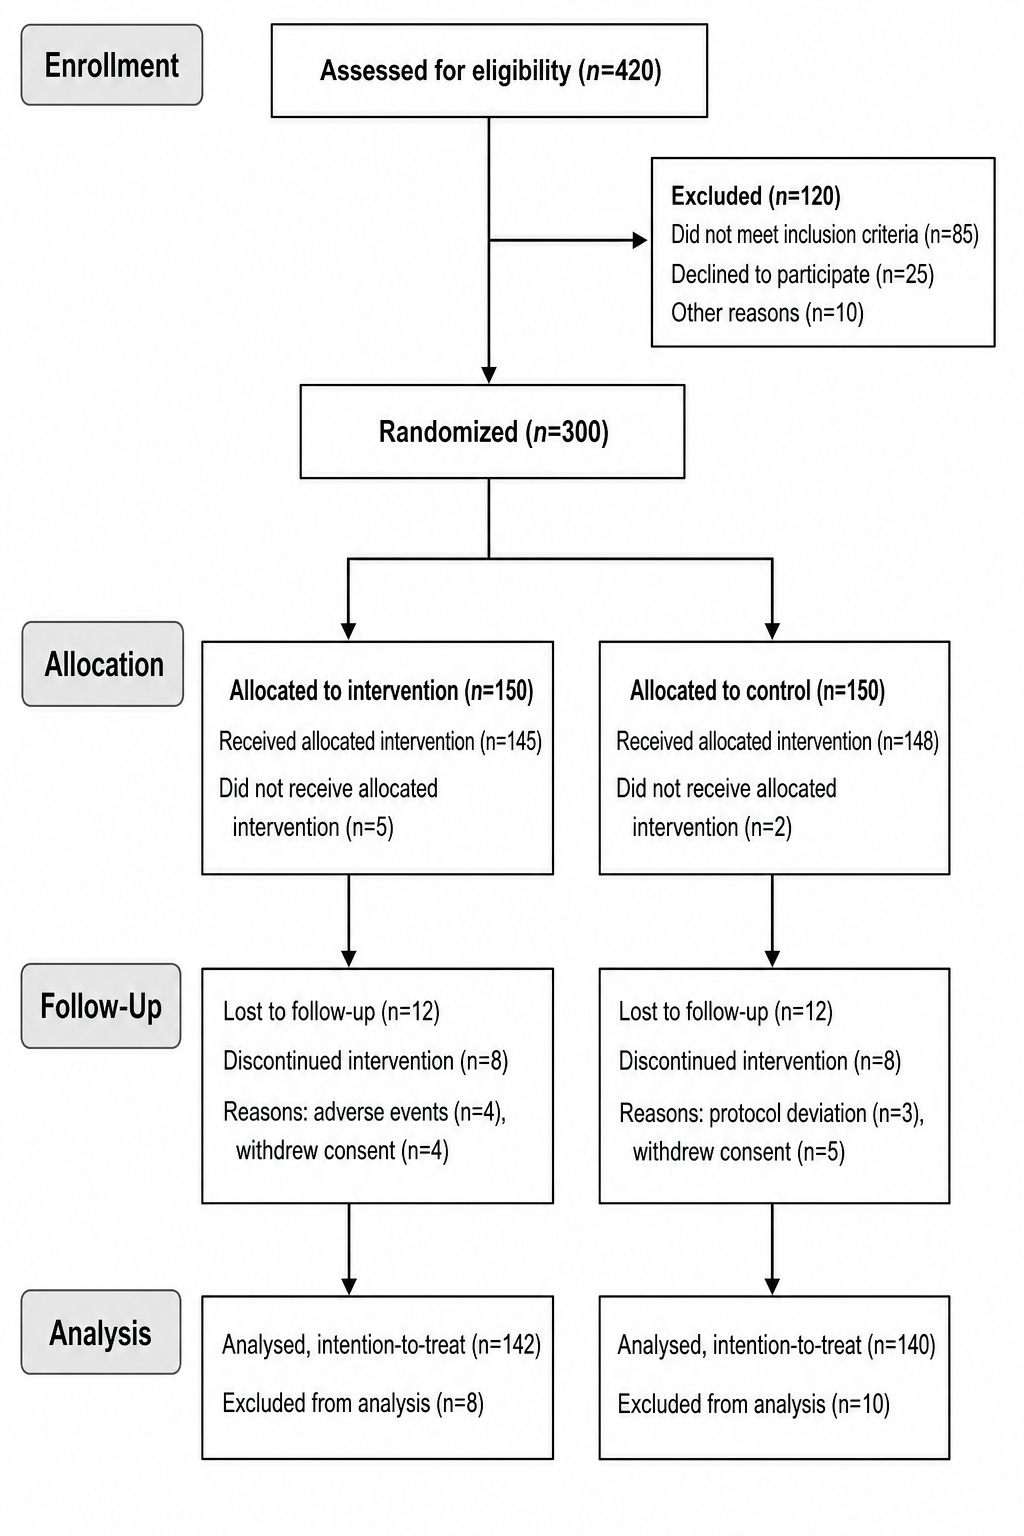
By the end of this guide you'll be able to:
- Make a CONSORT flow diagram for an RCT with the four standard stages — no manual box drawing.
- Show enrollment, allocation, follow-up, and analysis with the right counts in each box.
- Add exclusion reasons and lost-to-follow-up counts as side branches, exactly as CONSORT 2010 requires.
- Build parallel, multi-arm, or crossover versions and export a print-ready diagram for submission.
Everything below happens inside the SciDraw AI editor using the CONSORT flow diagram generator — you describe the trial and the numbers, the AI lays out the boxes, and you refine it with words.
What a CONSORT diagram must contain
The CONSORT (Consolidated Standards of Reporting Trials) flow diagram tracks every participant from screening to analysis. It has four vertical stages, each a row of boxes:
- Enrollment — number assessed for eligibility, those excluded (with reasons), and the number randomized.
- Allocation — how many were allocated to each arm, and how many actually received the intervention.
- Follow-up — how many were lost to follow-up or discontinued in each arm, with reasons.
- Analysis — how many were analyzed in each arm, and how many were excluded from analysis (with reasons).
The numbers must reconcile down each column: every participant is accounted for from top to bottom. That accountability is the whole point — reviewers use it to check for attrition bias.
Step 1: Describe the trial structure
Open the editor and tell the AI the trial type and the arms first. A parallel two-arm trial and a three-arm trial have different layouts, so set the shape before the numbers.
Template: "Create a CONSORT 2010 flow diagram for a [parallel two-arm / three-arm / crossover] randomized controlled trial. Four stages: Enrollment, Allocation, Follow-up, Analysis. Arms: [Treatment] and [Control]. Add side boxes for exclusions with reasons and for lost-to-follow-up counts."
A filled-in example:
- "Create a CONSORT flow diagram for a parallel two-arm RCT comparing Drug A vs. Placebo. Four stages stacked vertically: Enrollment, Allocation, Follow-up, Analysis. After randomization the flow splits into two columns. Add a side box at enrollment for excluded participants with reasons, and side boxes at follow-up for those lost to follow-up."
Step 2: Fill in the counts
Now add the numbers stage by stage. The AI places them in the correct boxes and keeps the columns reconciling.
- "Enrollment: 540 assessed for eligibility, 120 excluded (80 did not meet inclusion criteria, 25 declined, 15 other reasons), 420 randomized."
- "Allocation: 210 allocated to Drug A (200 received it, 10 did not), 210 allocated to Placebo (205 received it, 5 did not)."
- "Follow-up: Drug A lost 15 to follow-up (8 withdrew, 7 lost contact); Placebo lost 12."
- "Analysis: Drug A 195 analyzed, 5 excluded; Placebo 198 analyzed, 7 excluded."
Listing exclusion reasons inside the side boxes is what distinguishes a compliant CONSORT diagram from a generic flowchart.
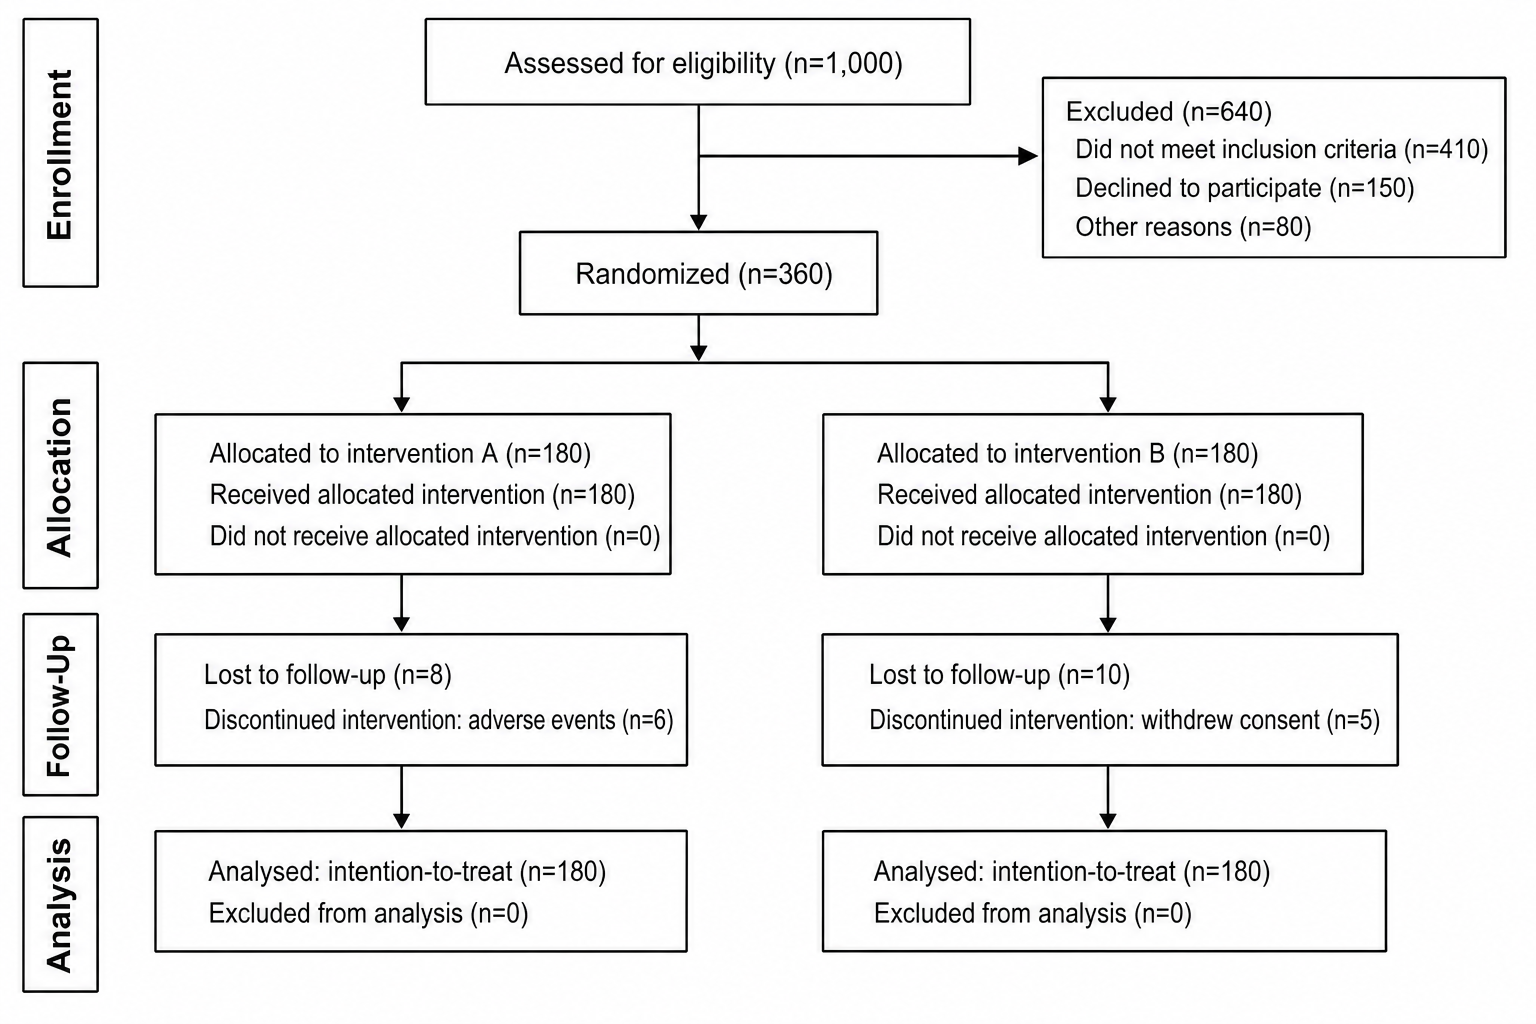
Step 3: Add stage labels and side branches
CONSORT diagrams use a left-hand strip of stage labels and right-side branches for losses. Make both explicit.
- "Add the stage labels 'Enrollment', 'Allocation', 'Follow-up', and 'Analysis' down the left side."
- "Place exclusion boxes as side branches to the right, connected with a small horizontal arrow."
- "Draw the randomization step as a single box that splits into the two arms below it."
- "Use rectangular boxes with thin connecting arrows and consistent spacing."
The side-branch arrows visually peel participants away from the main flow, which is exactly how readers expect attrition to be shown. To tweak any single box's wording later, see how to edit text and labels in AI figures.
Step 4: Adapt to multi-arm or crossover designs
Not every trial is two parallel arms. The same diagram adapts:
- "Change this to a three-arm trial: Low dose, High dose, and Placebo, each as its own column from allocation down."
- "Make this a crossover trial showing Period 1, washout, and Period 2 with the sequence groups."
- "Add a multi-site note indicating participants were enrolled across 5 centers."
Tell the AI the design and it rebalances the columns and arrows without you redrawing anything.
Common mistakes (and how to fix them)
- Numbers that don't reconcile. If 420 are randomized but the arms sum to 415, reviewers will catch it. Fix: "Check that allocated counts sum to the randomized total and fix the discrepancy."
- Exclusions without reasons. A box that says "120 excluded" with no breakdown fails CONSORT. Fix: "List the exclusion reasons with counts inside the enrollment side box."
- Missing a stage. Dropping the follow-up row hides attrition. Fix: "Add the Follow-up stage with lost-to-follow-up counts for each arm."
- Crowded, misaligned boxes. Inconsistent spacing reads as careless. Fix: "Align the boxes into clean columns with even vertical spacing."
- No stage labels. Readers shouldn't have to infer the stages. Fix: "Add the four CONSORT stage labels down the left margin."
- Wrong arm count for the design. A three-arm trial drawn as two arms misrepresents the study. Fix: "Split allocation into three columns, one per arm."
Export and use
When the diagram is ready, export it for submission:
- "Export this as a 300 DPI PNG sized for a single journal column."
- "Give me an SVG so I can make final edits in Illustrator."
- "Export at high resolution with a white background for the manuscript."
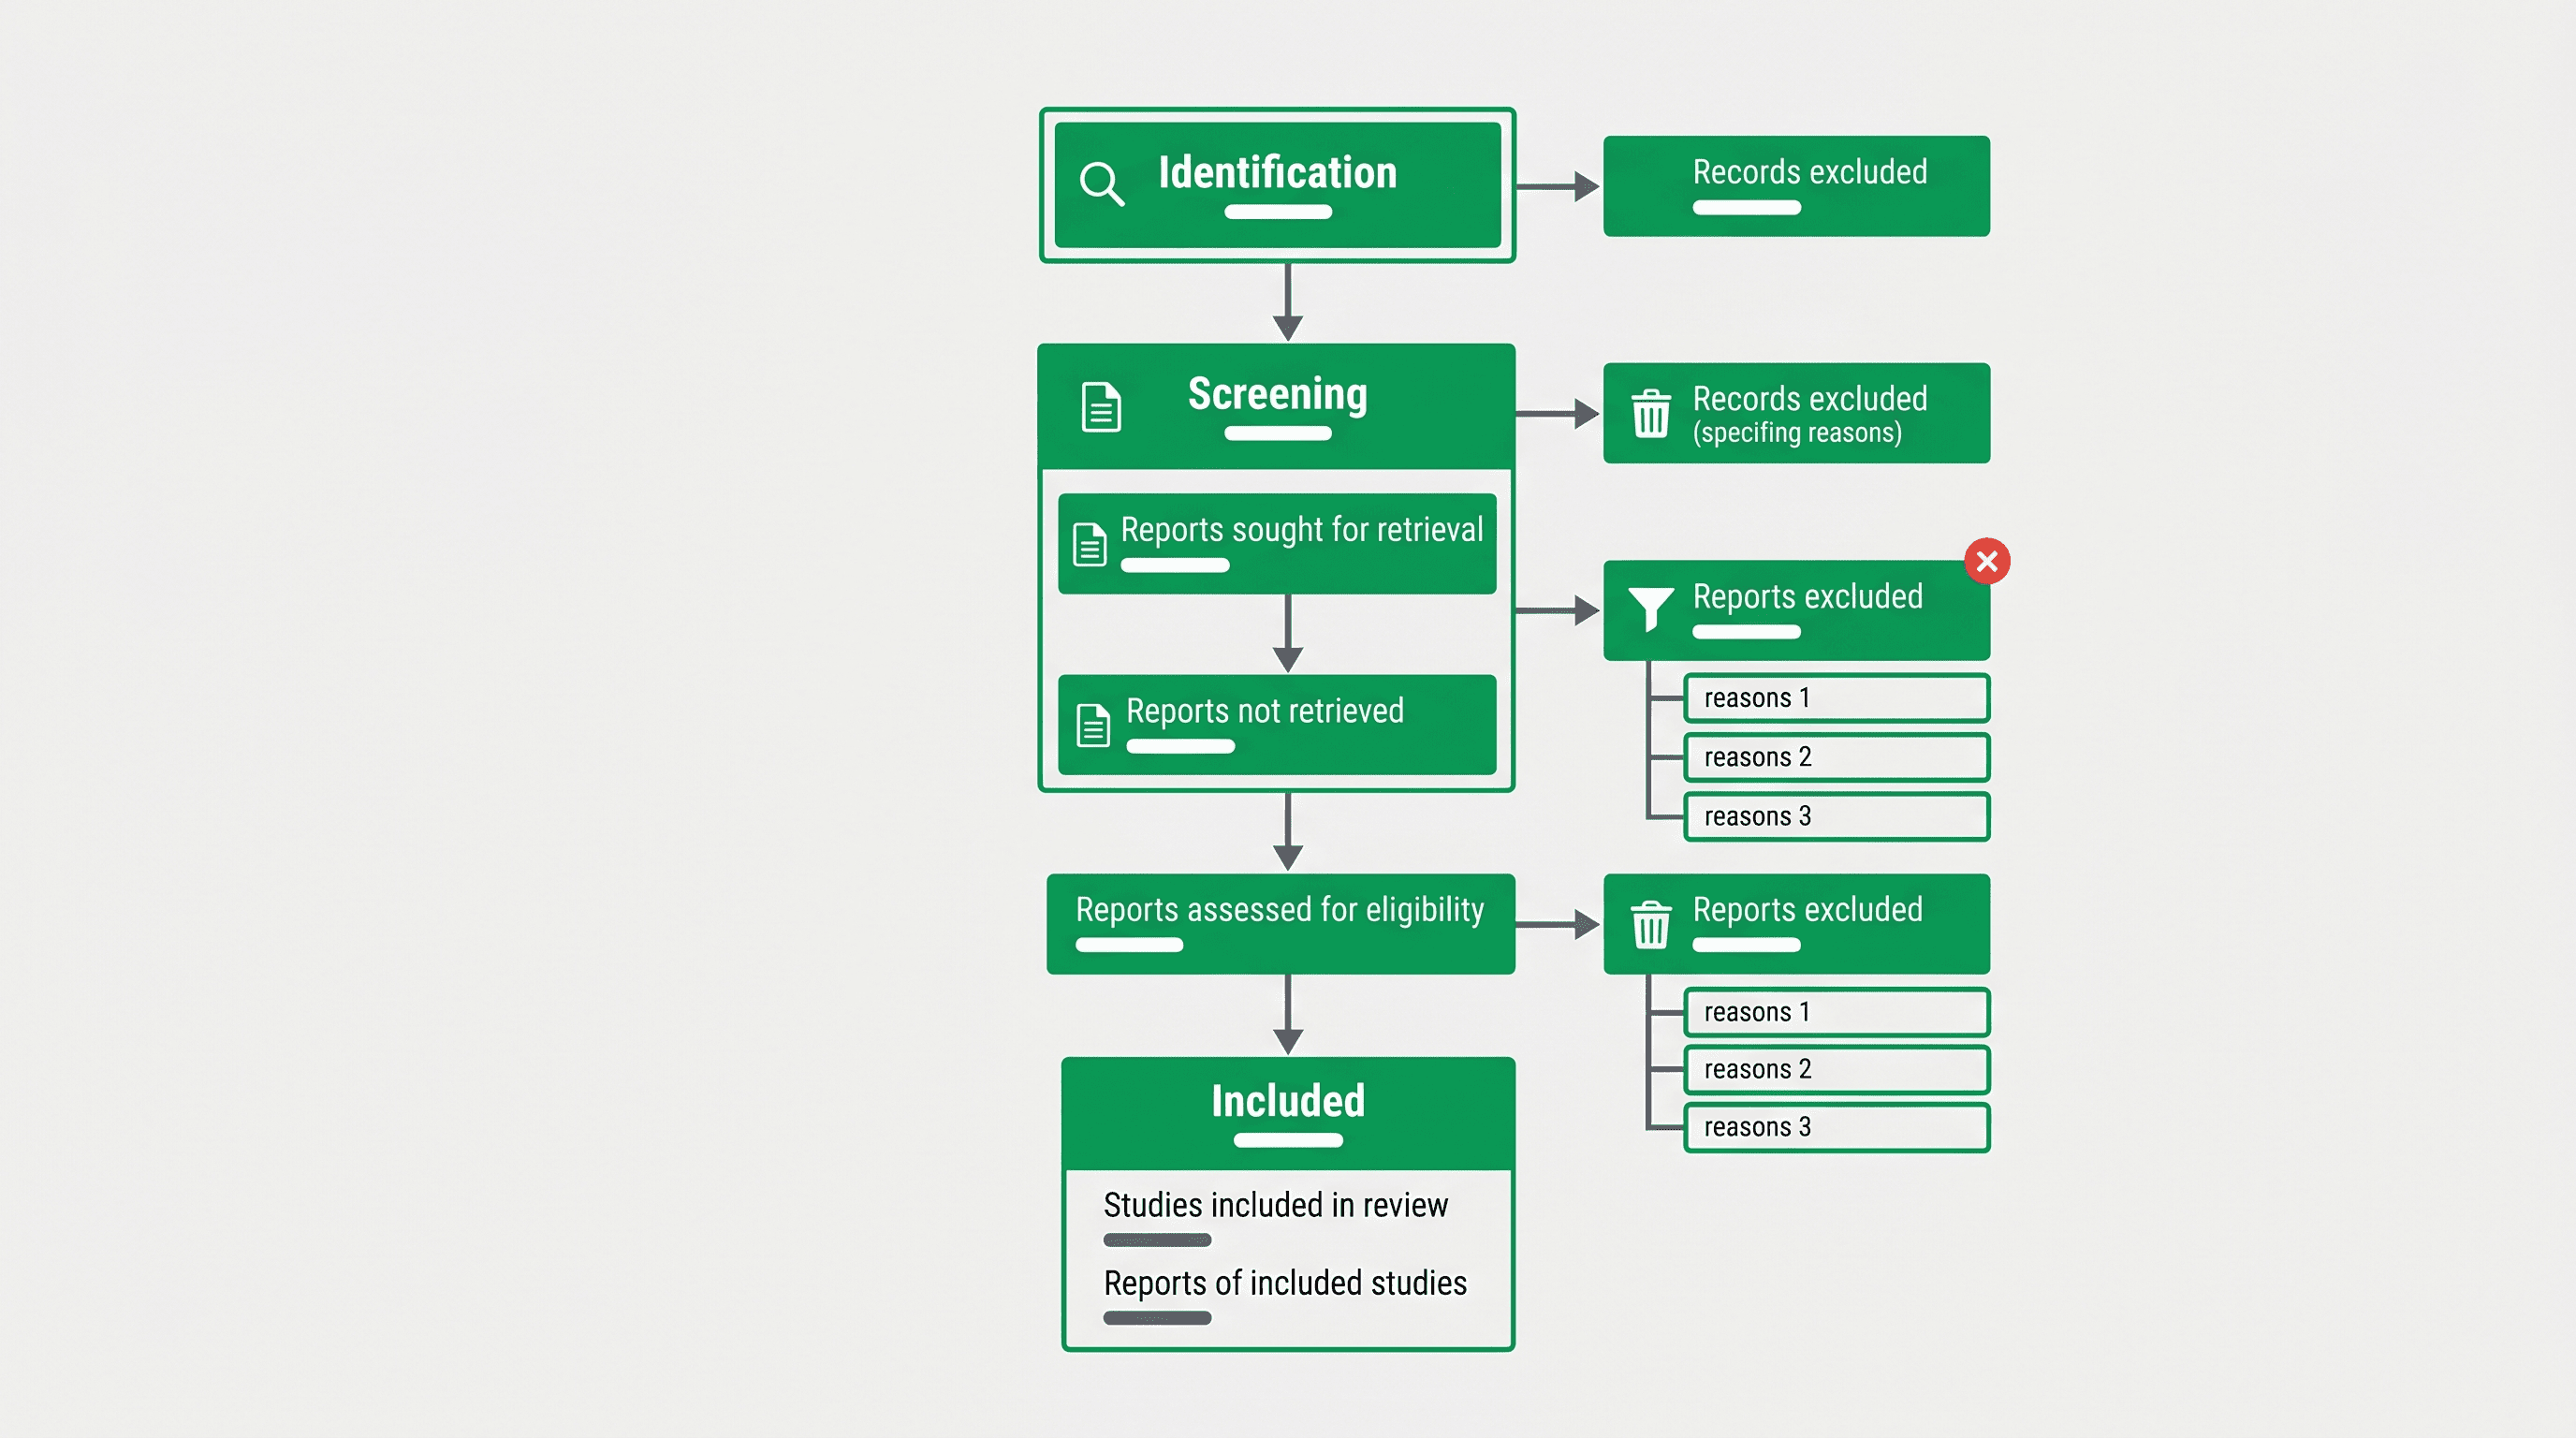
The CONSORT diagram pairs naturally with two other reporting figures. If your work is a systematic review of trials, see how to make a PRISMA flow diagram for study selection — it's the review-level cousin of CONSORT. And for reporting your trial's survival outcomes, see how to make a Kaplan-Meier plot. Everything stays editable in the SciDraw AI editor.
Frequently asked questions
How do I make a CONSORT flow diagram without PowerPoint or Illustrator? Open the CONSORT flow diagram generator, describe your trial type and arms, then give the counts for each stage. The AI lays out the four-stage flow with reconciled boxes and side branches. You edit any number or label by typing — no manual box-and-arrow drawing.
What are the four stages of a CONSORT diagram? Enrollment (assessed, excluded with reasons, randomized), Allocation (allocated and received per arm), Follow-up (lost to follow-up and discontinued per arm), and Analysis (analyzed and excluded from analysis per arm). The counts must reconcile down each column.
What's the difference between a CONSORT and a PRISMA diagram? CONSORT tracks participants through a single randomized trial, while PRISMA tracks studies through a systematic review (identification, screening, eligibility, inclusion). They look similar but serve different reporting standards; use CONSORT for an RCT and PRISMA for a review.
How do I show exclusion reasons in a CONSORT diagram? Put them in a side box branching off the main flow. At enrollment, list how many were excluded and why (e.g., did not meet criteria, declined, other). At follow-up and analysis, list lost-to-follow-up and exclusion reasons per arm. The generator places these side branches for you.
Can I make a CONSORT diagram for a three-arm or crossover trial? Yes. Tell the CONSORT flow diagram generator your design — parallel multi-arm, crossover, or multi-site — and it adds the right number of columns and adapts the allocation and follow-up rows accordingly.
Make your CONSORT diagram now
Stop nudging boxes in PowerPoint. Describe your trial, enter the counts once, and let the AI build a compliant, reconciled CONSORT flow diagram that stays editable when your numbers change. Open the CONSORT flow diagram generator or jump into the SciDraw AI editor to make yours now.