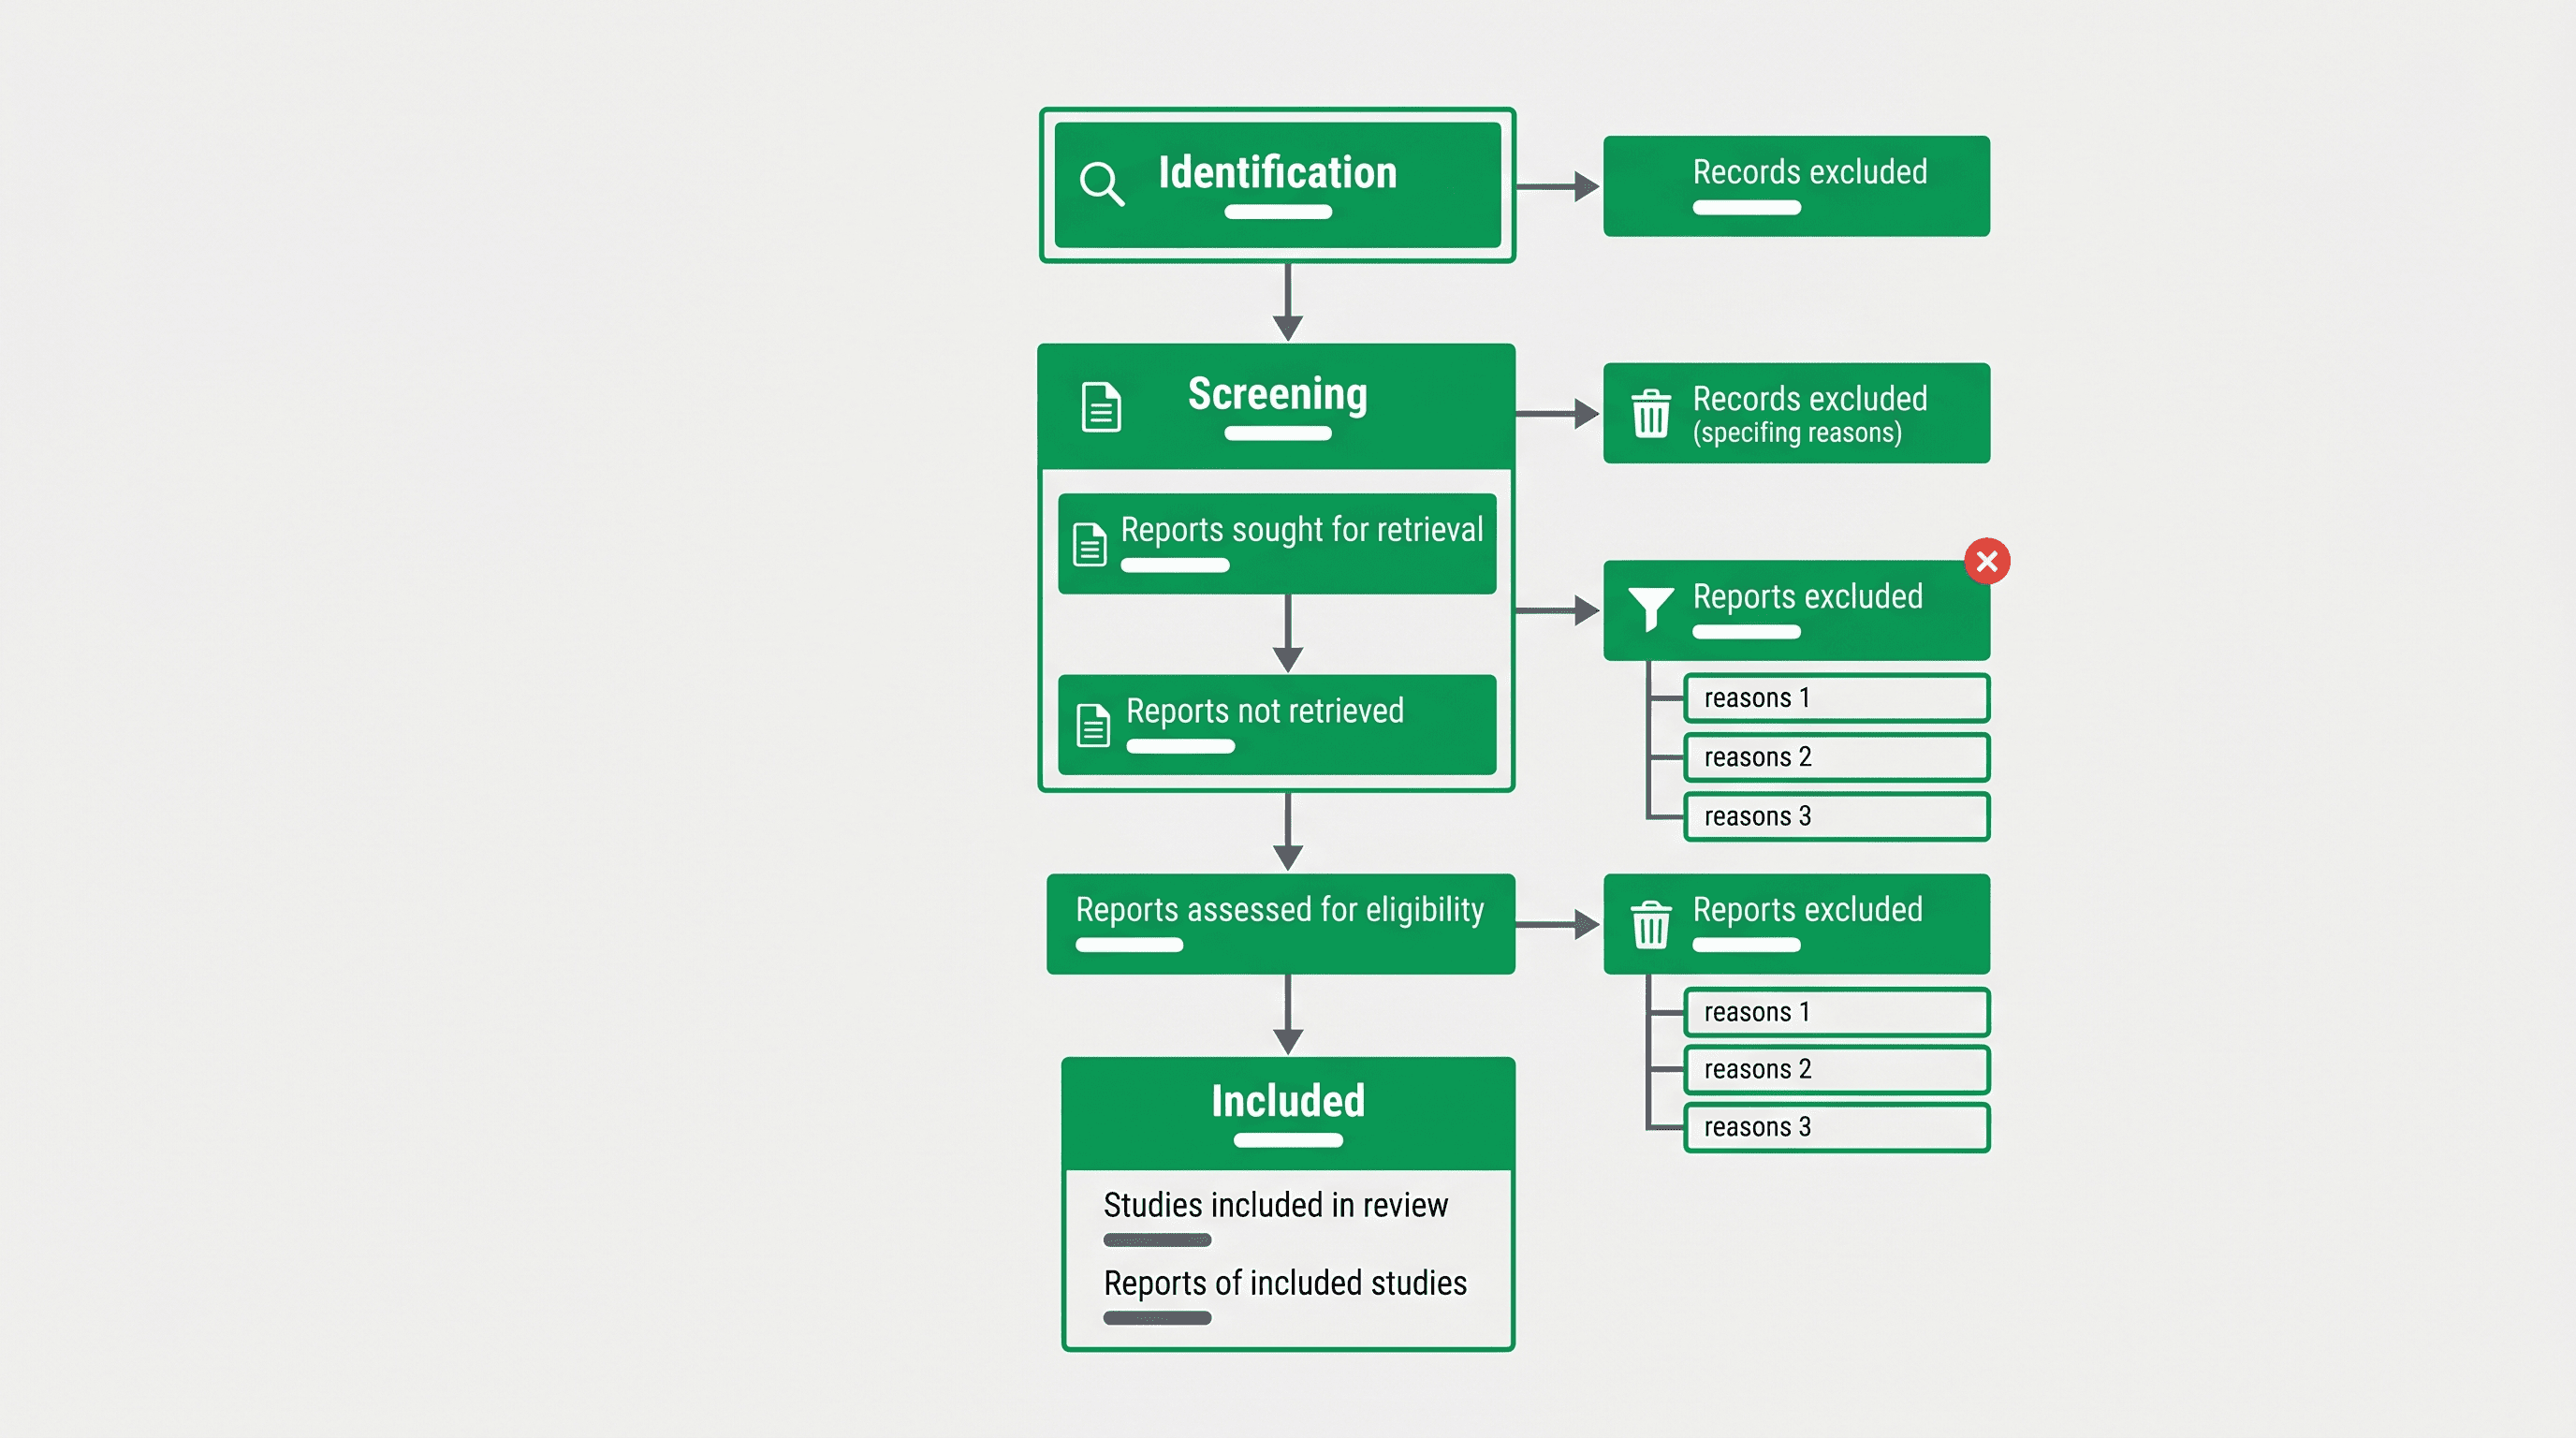
システマティックレビューやメタアナリシスを学術誌に投稿したことがある方なら、PRISMA フロー図を求められた経験があるでしょう。エビデンス総合研究において最も認知度の高い図表のひとつであり、明確にラベリングされた4つのステージ、件数の列、そして数千件のデータベースヒットから最終的に分析した少数の研究へと絞り込んでいく過程を示す矢印で構成されています。
これほど一般的な図表でありながら、初めて目にする研究者の多くが戸惑いを覚えます。どのボックスにどの数字を入れるのか?「識別されたレコード」と「取得を求めた報告」の違いは何か?「その他の方法」のための第2列はいつ表示すべきか?本ガイドではこれらの疑問をすべて解決し、完成した投稿可能なPRISMA 2020フロー図をゼロから作成する手順を丁寧に説明します。
本ガイドで学べること:
- PRISMA 2020図の4つのステージとそれぞれの意味
- 各ボックスに記入すべき数字の詳細
- データベース検索とその他の識別方法の扱い方
- 査読者から修正要求が来やすい頻出ミス
- SciDraw AI の PRISMA フロー図ジェネレーター を使って完成図を素早く作成する方法
PRISMAが生まれた背景とフロー図の重要性
PRISMAは Preferred Reporting Items for Systematic Reviews and Meta-Analyses(システマティックレビューとメタアナリシスのための優先報告項目)の略称です。2020年版は2009年版を改訂したもので、レコードの出所(データベース、レジストリ、引用文献、その他の方法)に関する表現が明確化され、全文報告書を検索・取得するための明示的なステップが追加されました。
フロー図はThe BMJ、The Lancet、JAMA、Cochrane Database of Systematic Reviewsをはじめ、医学・心理学・教育学・社会科学の数百誌で必須または強く推奨されています。査読者は真っ先にフロー図を確認します。数字の不整合やボックスの欠落は「大幅修正」判定を招く最も典型的な原因のひとつです。
PRISMA 2020の4つのステージを理解する
PRISMA 2020は文献検索のプロセスを4つの連続したステージに分類しています。上が広く下が狭い漏斗をイメージすると分かりやすいでしょう。
| ステージ | わかりやすい意味 |
|---|---|
| 識別(Identification) | フィルタリングを一切行う前に見つかったすべてのレコード |
| スクリーニング(Screening) | タイトル・抄録レベルで選択・除外基準に照らして確認したレコード |
| 適格性(Eligibility) | 取得して詳細に評価した全文報告書 |
| 組み入れ(Included) | すべての基準を満たし、統合分析に組み入れられた研究 |
各ステージには1つ以上のボックスがあり、そのステージに入ったレコード数と除外されたレコード数(理由付き)が示されます。
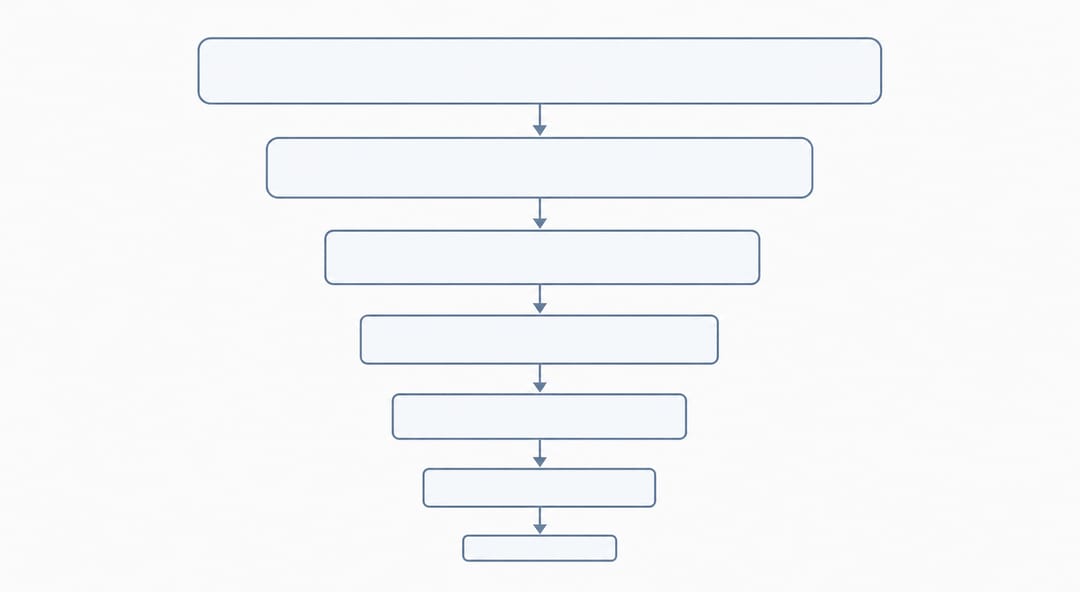 PRISMAのフローは漏斗のように機能し、見つかったすべてのレコードから最終的に組み入れられた研究へと絞り込まれていきます。
ステージ1 — 識別
2列構造
PRISMA 2020では識別ステージが2列に分かれています:
- 左列 — データベースおよびレジストリ:文献データベース(PubMed、Embase、Web of Science、Cochrane CENTRAL、PsycINFO、Scopusなど)や試験登録(ClinicalTrials.gov、WHO ICTRPなど)から見つかったレコード。
- 右列 — その他の方法:引用文献検索(前向き・後ろ向き)、著者への問い合わせ、グレー文献のレビュー、その他のデータベース以外の情報源から見つかったレコード。
データベースのみを検索した場合は右列を完全に省略できます。両方を使用した場合は両方を表示します。
各識別ボックスに記入すること
左列、ボックス1:
データベースから識別されたレコード(n = X)およびレジストリ(n = Y)
重複排除の前に全データベースのヒット数をひとつの合計に加算します。PubMedで1,243件、Embaseで2,187件だった場合、合計は3,430件です。重複があっても同様です。
左列、ボックス2(除外):
スクリーニング前に除外されたレコード: 重複レコードの除外(n = ?) 自動化ツールにより不適格とマークされたレコード(n = ?) 取得できなかったレコード(n = ?)
各理由を別々に記載します。「自動化ツール」とは、人によるスクリーニングの前に使用された機械学習支援スクリーニングソフトウェア(Rayyan、Covidence等)を指します。
右列(該当する場合):
識別されたレコードの出所:引用文献検索(n = ?)/ウェブサイト(n = ?)/機関(n = ?)/ハンドサーチ(n = ?)/その他(n = ?)
方法別に内訳を記載するか、「その他の方法」の合計にまとめても構いません。
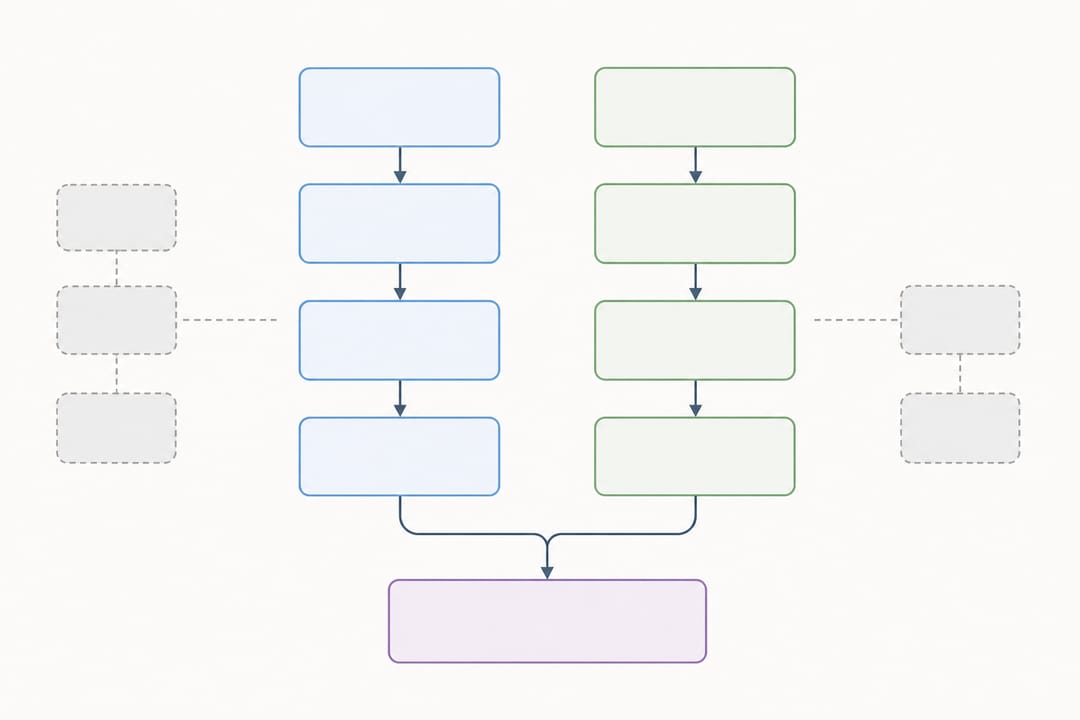 識別は2列構成を使います——一方はデータベースとレジストリ、もう一方はその他の方法です。
ステージ2 — スクリーニング
重複とオートメーション除外を行った後、残りのレコードがスクリーニングに入ります。
ボックス:スクリーニングされたレコード
人間の査読者が実際に確認したレコード(タイトルと抄録)の総数です。識別されたレコード数からスクリーニング前に除外したレコード数を引いた数になります。
スクリーニングされたレコード(n = ?)
ボックス:除外されたレコード
タイトル・抄録レベルで除外した合計数を報告します。PRISMA 2020では、タイトル・抄録除外の理由を列挙することは求められていません(全文除外とは異なります)。合計数のみが必要です。
除外されたレコード(n = ?)
ステージ3 — 適格性(全文評価)
タイトル・抄録スクリーニングを通過したレコードは全文取得・評価に進みます。
ボックス:取得を求めた報告書
全文取得を試みたレコードの数です。通常、スクリーニングで「除外されなかった」レコードと同じ数ですが、取得可能な全文がない場合もあります。
取得を求めた報告書(n = ?)
ボックス:取得できなかった報告書
取得できなかった全文(ペイウォール後かつ著者応答なし、会議抄録のみ等)の数です。
取得できなかった報告書(n = ?)
ボックス:適格性評価を受けた報告書
実際に読んで全基準に照らして評価した全文の数です。
適格性評価を受けた報告書(n = ?)
ボックス:理由付きで除外された報告書
これはフロー図の中で最も重要な除外ボックスです。各除外理由とその件数を必ず記載しなければなりません。一般的な理由は以下の通りです:
- 対象集団が基準を満たさない
- 介入/曝露が対象外
- 対照群が未指定
- アウトカムが報告されていない
- 研究デザインが不適切
- 重複出版(既に組み入れた研究と同一データ)
- 会議抄録のみ/完全なデータなし
除外された報告書: 理由A(n = ?) 理由B(n = ?) ……
ステージ4 — 組み入れ
ボックス:レビューに組み入れられた新規研究
全文評価を通過し、レビューに採用された研究です。メタアナリシスを行う場合、少なくとも1つの分析にデータを提供する研究が該当します。
レビューに組み入れられた研究(n = ?)
ボックス:組み入れられた新規研究の報告書
1つの「研究」が複数の報告書を持つことがあります(主論文、副次アウトカム論文、プロトコル論文など)。ユニーク研究数と報告書総数の両方を記録します。
組み入れられた新規研究の報告書(n = ?)
以前の研究(先行レビューの更新の場合)
今回のシステマティックレビューが以前のものを更新する場合、PRISMA 2020では以前のバージョンから引き継がれた研究と報告書のボックスを追加します。これらは組み入れステージ下部の網掛けエリアに表示されます。
ボックスと件数の完全参照表
| ボックスラベル | 数字が表すもの | 計算チェック |
|---|---|---|
| データベースおよびレジストリのレコード | 重複排除前の全データベースヒット数 | 各データベースの検索ヒット数の合計 |
| その他の方法のレコード | データベース以外の全レコード | 方法別に合計 |
| スクリーニング前に除外されたレコード | 重複 + 自動化除外 + 未取得の合計 | 識別合計から減算 |
| スクリーニングされたレコード | 人間の査読者が確認したレコード | 識別合計 − スクリーニング前除外 |
| 除外されたレコード(タイトル/抄録) | タイトル/抄録スクリーニングで不合格 | スクリーニング済み − 全文に進んだもの |
| 取得を求めた報告書 | 取得しようとした全文 | = スクリーニングから進んだレコード |
| 取得できなかった報告書 | アクセスできなかった全文 | 求めたもの − 実際に取得したもの |
| 適格性評価を受けた報告書 | 実際に読んだ全文 | = 取得した報告書 |
| 除外された報告書(理由付き) | 全文評価で不合格 | 評価済み − 組み入れ済み;理由の合計が総除外数と一致すること |
| 組み入れられた研究 | 統合分析のユニーク研究 | 最終分析サンプル |
| 組み入れられた研究の報告書 | 組み入れ研究の全出版物 | 研究数以上 |
数値の整合性を確認する
数字の不整合は、査読者から修正要求が来る典型的な原因のひとつです。投稿前に以下の4つを確認してください:
- 識別→スクリーニング:(データベースのレコード数)+(その他の方法のレコード数)−(スクリーニング前除外数)= スクリーニング済みレコード数
- スクリーニング→適格性:スクリーニング済みレコード数 − 除外レコード数(タイトル/抄録)= 取得を求めた報告書数
- 適格性→組み入れ:評価済み報告書数 − 除外報告書数(理由付き)= 組み入れ研究数
- 報告書数 ≥ 研究数:組み入れ研究の報告書数は、組み入れ研究数以上でなければなりません
いずれかの数字を更新するたびに、この4項目を再確認してください。
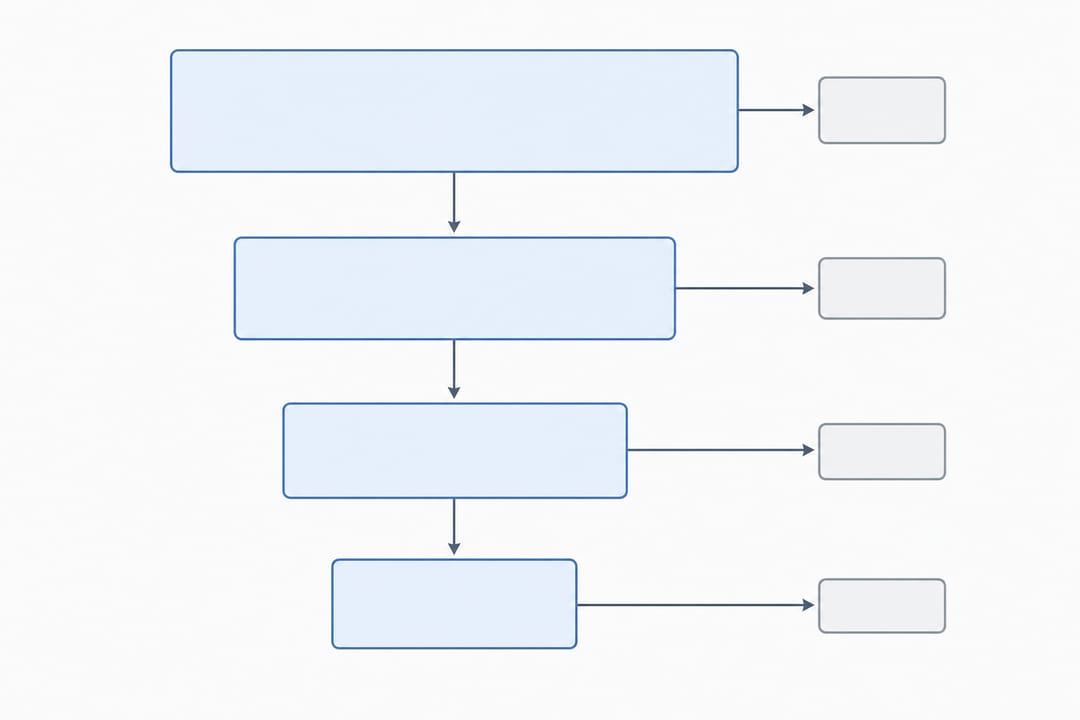 どのステージでも数字は整合していなければなりません。入ったレコード数から除外された数を引くと、次に進むレコード数になります。
よくある間違いを避けるために
最初のボックスに重複排除後の数字を記入している。 識別ステージの最初のボックスには、重複を排除する前の各情報源の生のヒット数を示す必要があります。重複排除のステップは除外ボックスに明示します。
全文除外の理由を省略している。 タイトル・抄録除外の理由は任意ですが、全文除外の理由は必須です。すべての理由とその件数を列挙してください。
研究と報告書を混同している。 組み入れステージでは、ユニーク研究数とそれらを報告する出版物数を区別します。両者を分けて管理してください。
その他の検索を行ったのに右列を示していない。 学術誌の手動検索、参考文献リストのスクリーニング、専門家への問い合わせを行った場合、それらのレコードは右列に属します。省略すると報告バイアスとみなされます。
2020年投稿にPRISMA 2009テンプレートを使用している。 2つのバージョンは見た目は似ていますが、用語と構造が異なります。現在、多くの学術誌は2020年版を要求しています。不明な場合は、Page et al.(2021年、BMJ)のPRISMA 2020声明を確認してください。
図表の書式設定
PRISMAはフォントや色を規定していませんが、慣例と可読性の観点からいくつかのベストプラクティスがあります:
| 要素 | 推奨事項 |
|---|---|
| フォント | サンセリフ体(Arial、Helvetica、またはCalibri);ボックスのテキストは8〜10 pt |
| ボックスのスタイル | ステージボックスは角丸四角形;カウント/除外ボックスは四角形 |
| 矢印 | 単方向、実線;装飾的な矢印頭なし |
| 色 | モノクロはすべての学術誌で安全;除外ボックスへの薄いグレーの塗りつぶしで視認性向上 |
| ステージラベル | 太字、すべて大文字またはタイトルケース;各ステージの最初のボックスの外側または上部に配置 |
| ファイル形式 | 学術誌投稿にはTIFF(300 DPI以上)またはPDFでエクスポート;プレプリントにはPNG |
SciDraw AIでPRISMAダイアグラムを作成する
PowerPoint、Word、Illustratorで手動でダイアグラムを描くのは手間がかかります。数字が変わるたびにボックスを再編集し、位置調整を確認しなければなりません。専用ツールを使う方が効率的です。
SciDraw AIのPRISMAフロー図ジェネレーターでは、構造化されたフォームに数字を直接入力するだけで、適切にフォーマットされた投稿可能なダイアグラムが自動生成されます。ステージラベルの調整、「その他の方法」列の追加・削除、除外理由の編集、投稿先学術誌が要求するフォーマットへのエクスポートが可能です。
システマティックレビュー以外の用途で実験フロー、分析パイプライン、複数ステップの方法論図が必要な場合は、同プラットフォームのワークフローダイアグラムジェネレーターも活用できます。原著論文の方法セクションにも役立ちます。
よくある質問
PRISMA 2020の公式テンプレートを使わなければなりませんか? PRISMAのウェブサイトには記入式のWordテンプレートがありますが、学術誌からの要求ではありません。必要な要素と正確な数字が含まれていれば、どのダイアグラムでも受け入れられます。専用ツールやベクターソフトで図を描く方法でも、内容がチェックリストと一致していれば問題ありません。
あるレコードが複数のデータベースに出てきた場合は? 各データベースのヒット数に1回ずつ計上します(第1ボックスの重複排除前合計に含めます)。その後、「重複レコード除外」ステップで1件を残して残りを削除します。第1ボックスの数字が生の検索結果を反映していることが重要で、読者がデータベース間の重複度を判断できるようにする必要があります。
アウトカムごとに別々のPRISMAダイアグラムが必要ですか? 通常は不要です。1つのダイアグラムがレビュー全体をカバーします。異なるレビュー課題に対して個別の検索を行っている場合は別々のダイアグラムが適切なこともありますが、それは稀なケースです。共著者と相談し、投稿先学術誌の著者ガイドラインを確認してください。
スコーピングレビューにもPRISMAを使えますか? スコーピングレビュー向けのPRISMA-ScR(PRISMA extension for Scoping Reviews)が提供する修正版チェックリストがあります。フロー図の構造はPRISMA 2020とほぼ同じなので、本ガイドのボックスロジックがそのまま適用できます。
除外ステップの「自動化ツール」とは具体的に何ですか? 人によるスクリーニングの前に機械学習やルールベースのアルゴリズムを使ってレコードを不適格候補としてフラグを立てるソフトウェアのことです。代表例はRayyanのAI優先順位付け、CovdenceのAI重複排除エンジン、ASReviewです。そのようなツールを使用しなかった場合は、除外ボックスのその行を省略してください。
学術誌から「スタディフロー図」を求められましたが、同じものですか? ほとんどの場合、同じものです。「スタディフロー図」「PRISMAフロー図」「文献検索フローチャート」はすべて同じ図を指します。学術誌がPRISMA 2020への準拠を明示している場合は、本ガイドに従ってください。