Ecology textbooks are full of tangled arrows and Latin species names — but a clear food web diagram is one of the most powerful ways to communicate who eats whom in any ecosystem. Whether you are preparing a lesson, writing a thesis section, or submitting a lab report, knowing how to build a food web from scratch will save you hours of confusion.
In this guide you will learn:
- The difference between a food web and a food chain
- The five ecological roles every food web needs
- How energy flows and which direction arrows point
- What trophic levels are and how to assign them
- A worked example for a temperate grassland ecosystem
- A quick trophic-level reference table
- How to turn your sketch into a polished diagram fast
Want to skip straight to the diagram? The SciDraw AI food web maker turns a plain-text description of your ecosystem into a clean, arrow-correct, labeled food web in seconds — no drawing skills needed. Read on for the concepts, or jump in and generate one now.
Food Web vs Food Chain: What Is the Difference?
A food chain is a single, linear sequence of feeding relationships: grass → grasshopper → frog → hawk. It is easy to draw but dangerously oversimplified — in reality most organisms eat more than one thing and are eaten by more than one predator.
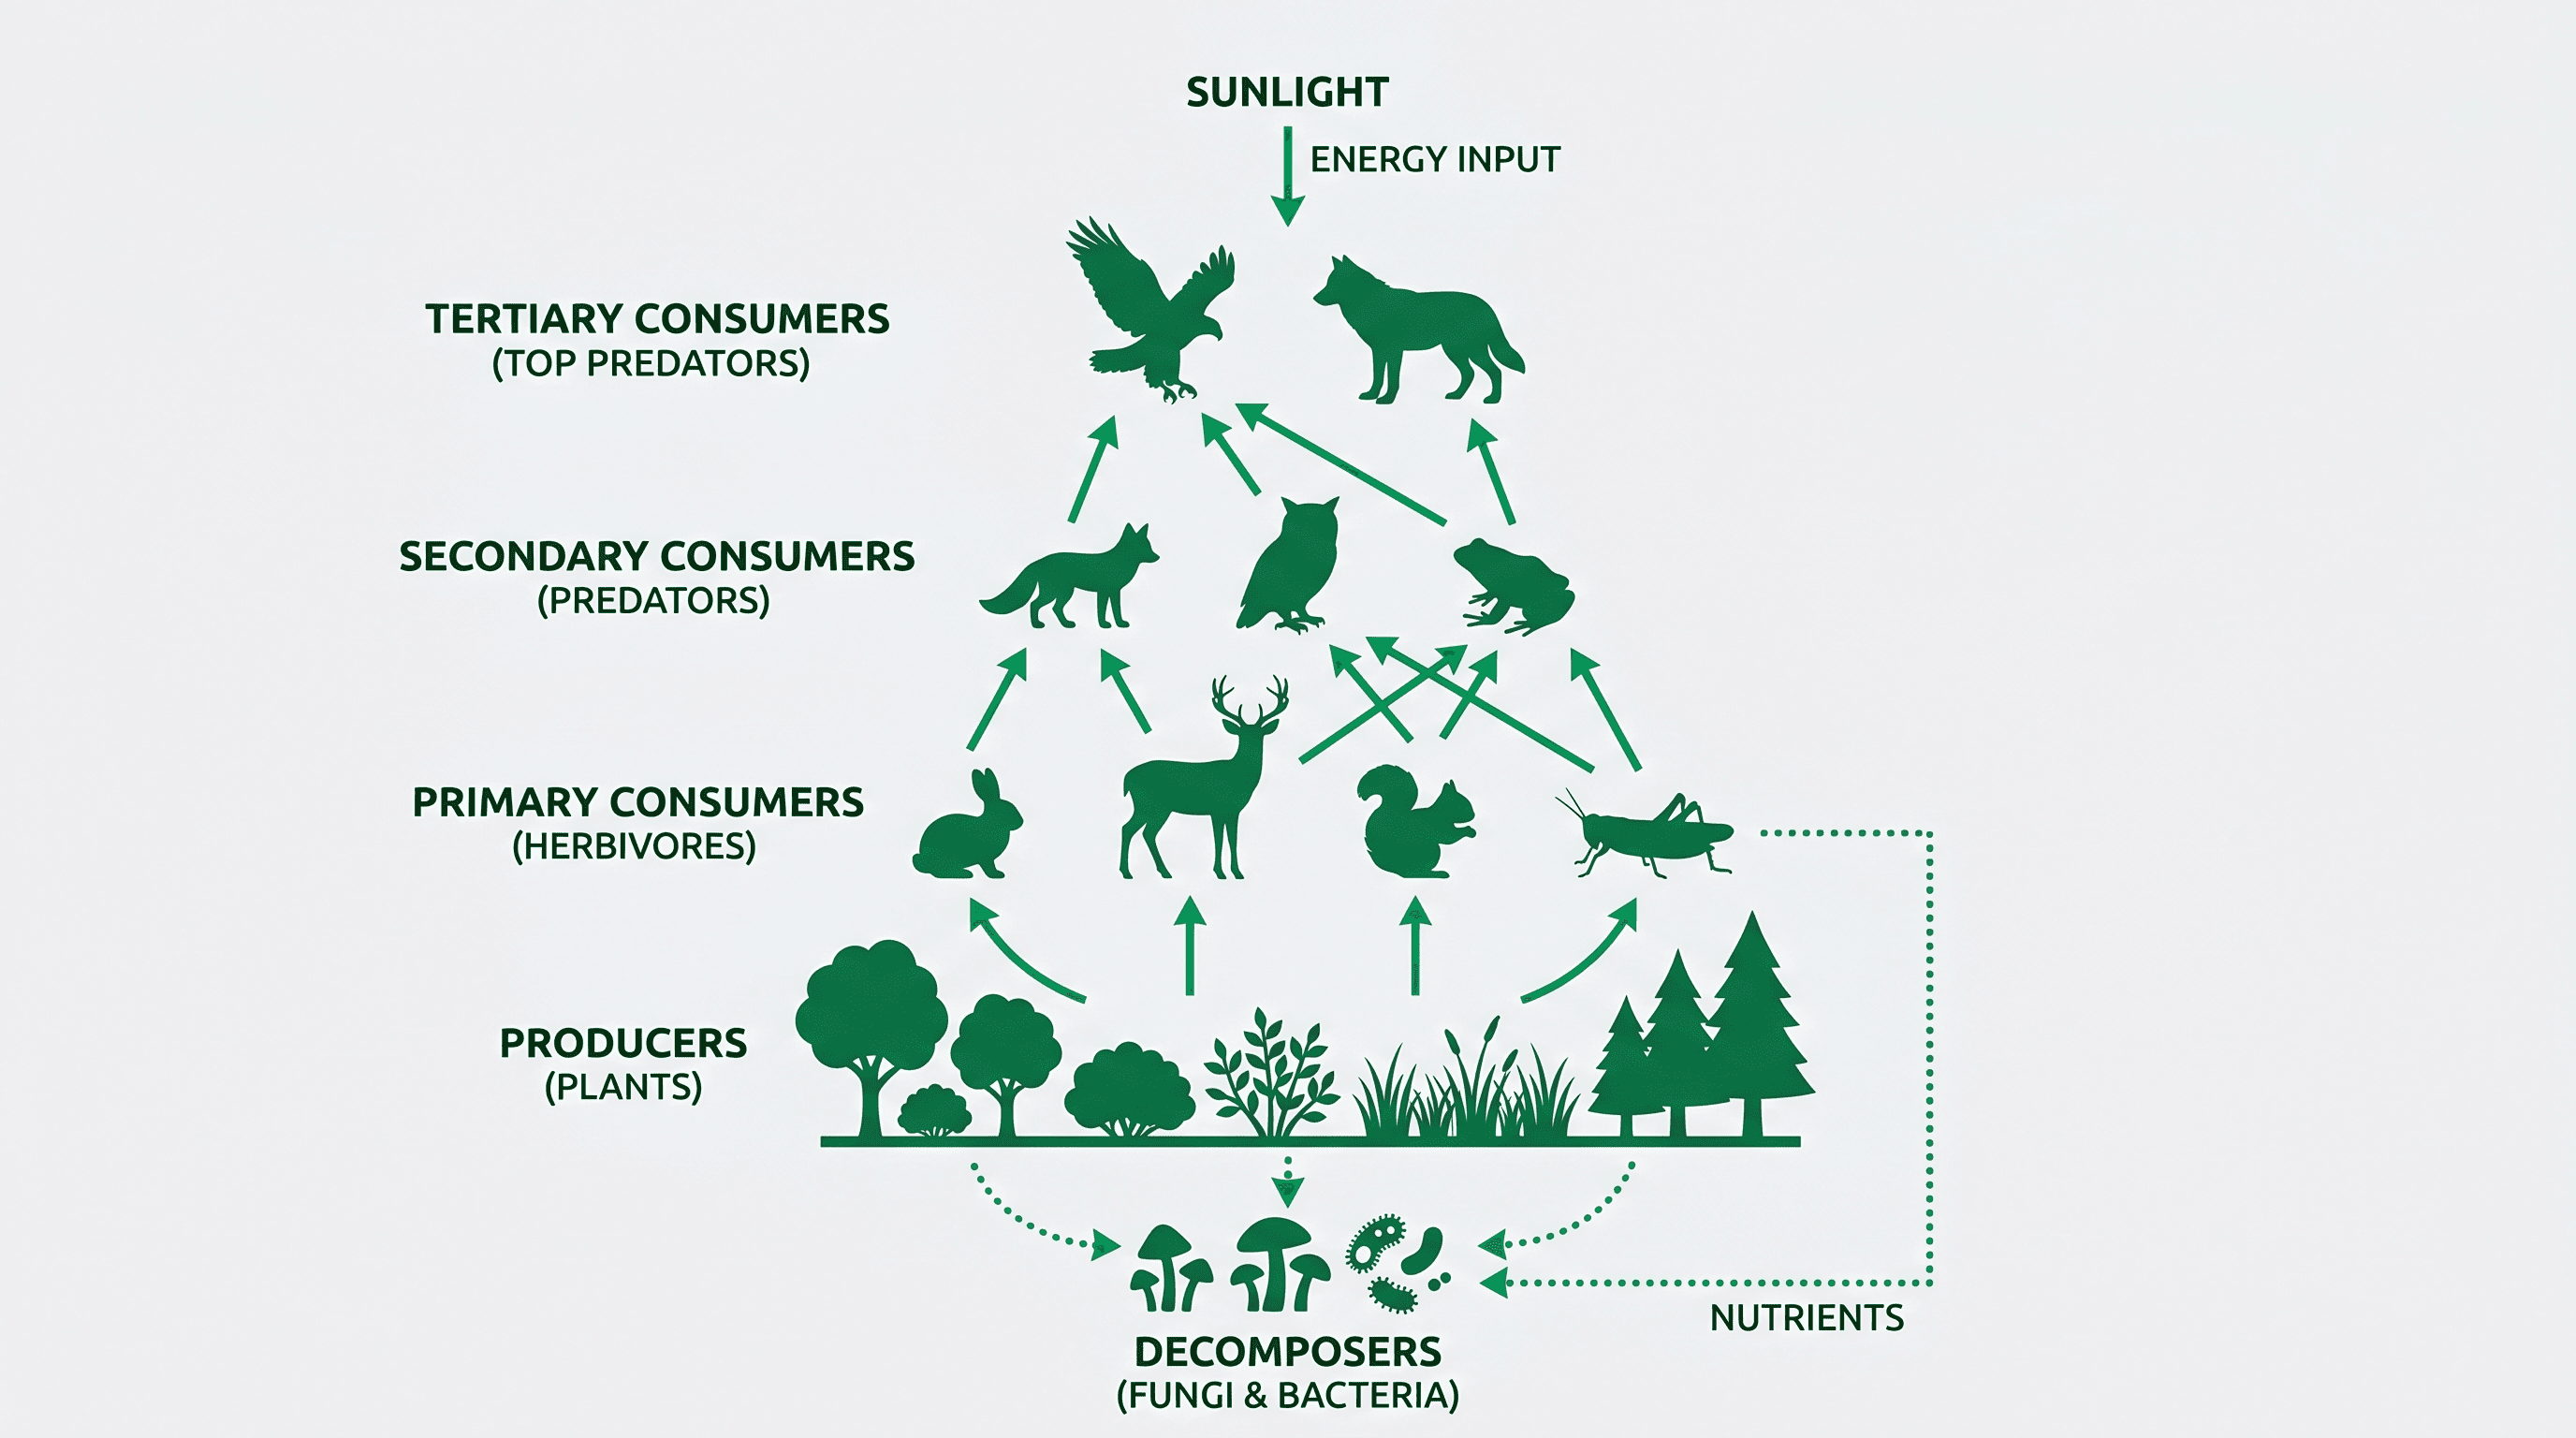
A food web overlays many food chains into a network. It shows the true complexity of energy flow, including:
- Omnivores that feed at multiple trophic levels
- Generalist predators with several prey species
- Decomposers that recycle nutrients from every level
- Feedback loops when a top predator is removed
For scientific accuracy — in a paper, poster, or exam diagram — always use a food web rather than a single chain.
The Five Ecological Roles in Any Food Web
Every organism in a food web plays at least one of these roles:
1. Producers (Autotrophs)
Plants, algae, and cyanobacteria that convert solar energy into chemical energy via photosynthesis. They sit at the base of every food web. Examples: oak tree, phytoplankton, prairie grass, kelp.
2. Primary Consumers (Herbivores)
Animals that eat producers directly. Examples: grasshoppers, rabbits, zooplankton, deer, caterpillars.
3. Secondary Consumers
Animals that eat primary consumers. Many are carnivores, though omnivores also appear here. Examples: frogs, small fish, foxes eating rabbits, shrews.
4. Tertiary (and Higher) Consumers
Animals at the top of local food chains; they eat secondary consumers and are rarely preyed upon within the same ecosystem. Examples: hawks, wolves, orcas, large sharks, eagles.
5. Decomposers and Detritivores
Fungi, bacteria, and invertebrates (earthworms, millipedes) that break down dead organic matter at every trophic level and return nutrients to the soil or water. They are often omitted by beginners but are ecologically critical.
Understanding Energy Flow and Arrow Direction
This is where students most often make mistakes.
The arrow in a food web points from prey to predator — that is, in the direction energy flows.
- Grass → Grasshopper (grass is eaten by the grasshopper; energy moves from grass to grasshopper)
- Grasshopper → Frog (frog eats grasshopper)
- Frog → Hawk (hawk eats frog)
A common error is to draw arrows pointing at the thing being eaten, which reverses the energy flow. Remember: the arrowhead shows where the energy (and biomass) goes.
The 10% Rule
Only about 10% of energy stored at one trophic level is transferred to the next. The rest is lost as heat, used for respiration, or locked in tissues that are not eaten. This is why:
- Food webs rarely have more than four or five trophic levels
- Top predators are always much less abundant than producers
- Removing a top predator can cascade down all levels (trophic cascade)
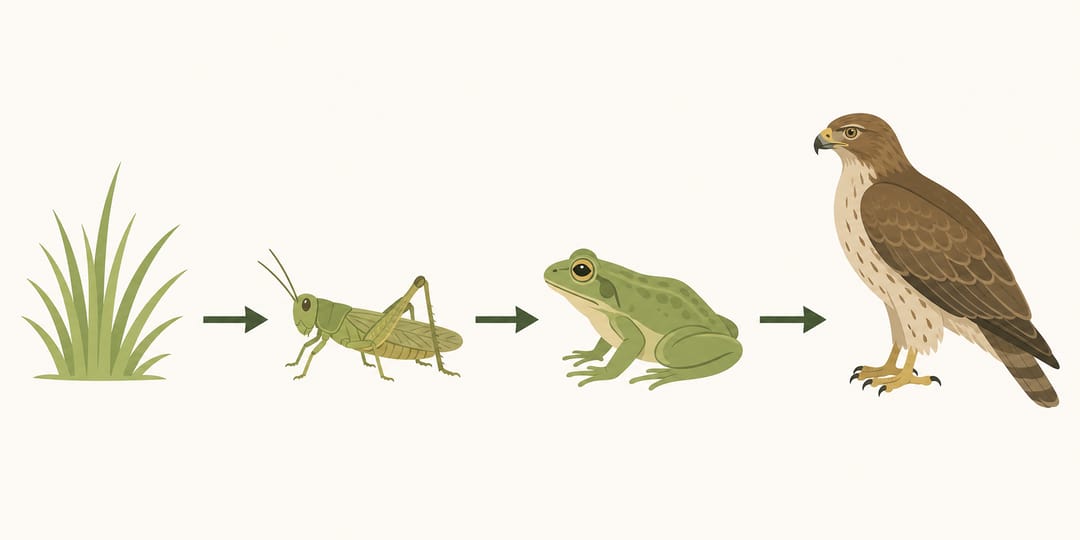 Arrows point from prey to predator, tracing the direction of energy flow.
Trophic Levels Explained
A trophic level is a feeding position in a food web, numbered from the bottom up.
| Trophic Level | Name | Role | Example Organisms |
|---|---|---|---|
| 1 | Producers | Photosynthesis / chemosynthesis | Grass, algae, phytoplankton |
| 2 | Primary Consumers | Eat producers | Rabbit, grasshopper, zooplankton |
| 3 | Secondary Consumers | Eat primary consumers | Frog, small fish, fox |
| 4 | Tertiary Consumers | Eat secondary consumers | Hawk, wolf, large tuna |
| 5 | Apex Predators | Top of the local web | Orca, polar bear, great white shark |
| — | Decomposers | Break down all levels | Earthworm, fungi, bacteria |
Note that many organisms span more than one level. A bear eats berries (trophic level 2), salmon (level 4), and honey (level 3), making it an omnivore that sits across levels 2–5 depending on the meal.
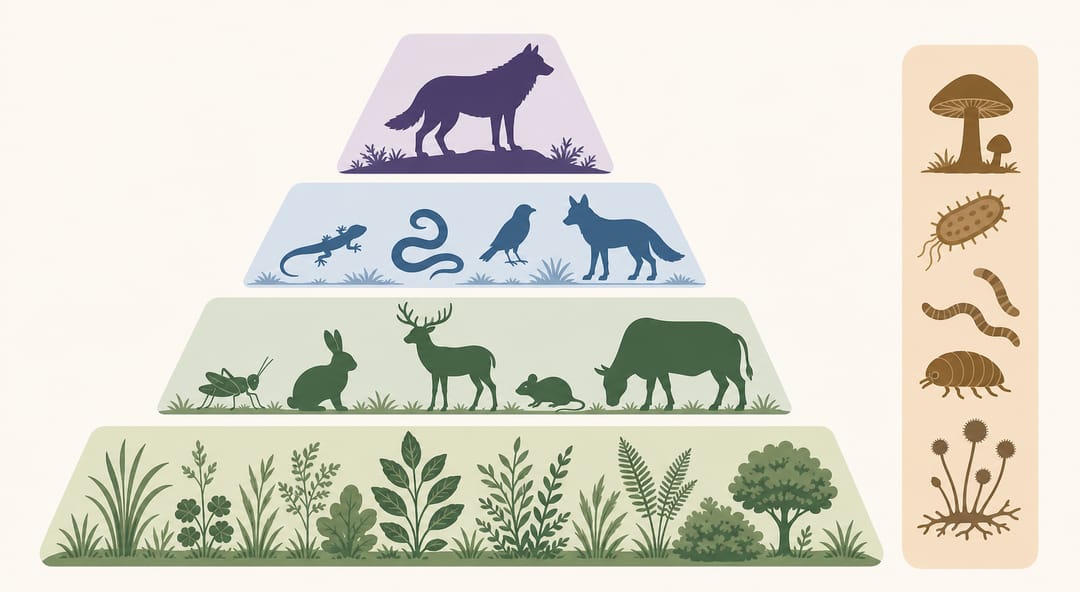 Each trophic level holds less energy than the one below it, narrowing toward the top.
Step-by-Step: How to Make a Food Web Diagram
Step 1 — Choose Your Ecosystem
Define a clear scope: temperate forest, coral reef, freshwater pond, arctic tundra. A focused ecosystem gives you a manageable number of species (typically 10–25 for a teaching diagram, up to 50+ for a research figure).
Step 2 — List the Organisms
Write out every species or functional group you want to include. Organise them by role:
- Producers: ______
- Primary consumers: ______
- Secondary consumers: ______
- Tertiary consumers: ______
- Decomposers: ______
Step 3 — Identify All Feeding Relationships
For each animal, ask: What does it eat in this ecosystem? Verify with a reliable source (field guide, primary literature, ecology textbook). List each pair: prey → predator.
Step 4 — Sketch a Draft Layout
Arrange organisms vertically by trophic level — producers at the bottom, apex predators at the top. Place decomposers to one side or at the very bottom connected to every level. This vertical layout makes energy flow immediately readable.
Step 5 — Draw the Arrows
Add arrows from prey to predator for every feeding relationship you identified in Step 3. Use a consistent arrowhead style. Where two or more prey feed the same predator, each gets its own arrow.
Step 6 — Check for Accuracy and Completeness
- Does every consumer have at least one prey?
- Does every prey have at least one predator (or does it reach decomposers)?
- Are decomposers connected to dead matter from multiple levels?
- Do all arrows point in the direction of energy flow?
Step 7 — Add Visual Clarity
- Use colour-coded nodes by trophic level
- Add species illustrations or silhouettes
- Label each node with common name + scientific name if needed
- Include a legend explaining arrow direction and node colours
Step 8 — Export or Publish
Save as SVG for scalable print, PNG for slides and reports, or PDF for submission.
Worked Example: Temperate Grassland Food Web
Below is a simplified food web for a North American temperate grassland.
Producers: Prairie grass, wildflowers, forbs
Primary Consumers: Grasshopper, prairie vole, bison, monarch butterfly larva
Secondary Consumers: Western meadowlark (eats grasshoppers), coyote (eats voles), American badger (eats voles)
Tertiary Consumers: Red-tailed hawk (eats meadowlark and voles), ferruginous hawk (eats ground squirrels and voles)
Apex Predator: Gray wolf (eats bison calves and coyotes)
Decomposers: Soil bacteria, dung beetles, earthworms
Key arrows to draw:
- Prairie grass → Grasshopper → Western Meadowlark → Red-tailed Hawk
- Prairie grass → Prairie Vole → Coyote → Gray Wolf
- Prairie grass → Bison → Gray Wolf
- Prairie grass → Prairie Vole → American Badger
- Dead matter at all levels → Soil bacteria / Earthworms → Prairie grass (nutrient cycle back to producers)
This web already shows a trophic cascade: if the gray wolf is removed, coyote populations explode, voles are over-hunted, grassland vegetation changes — a documented real-world effect.
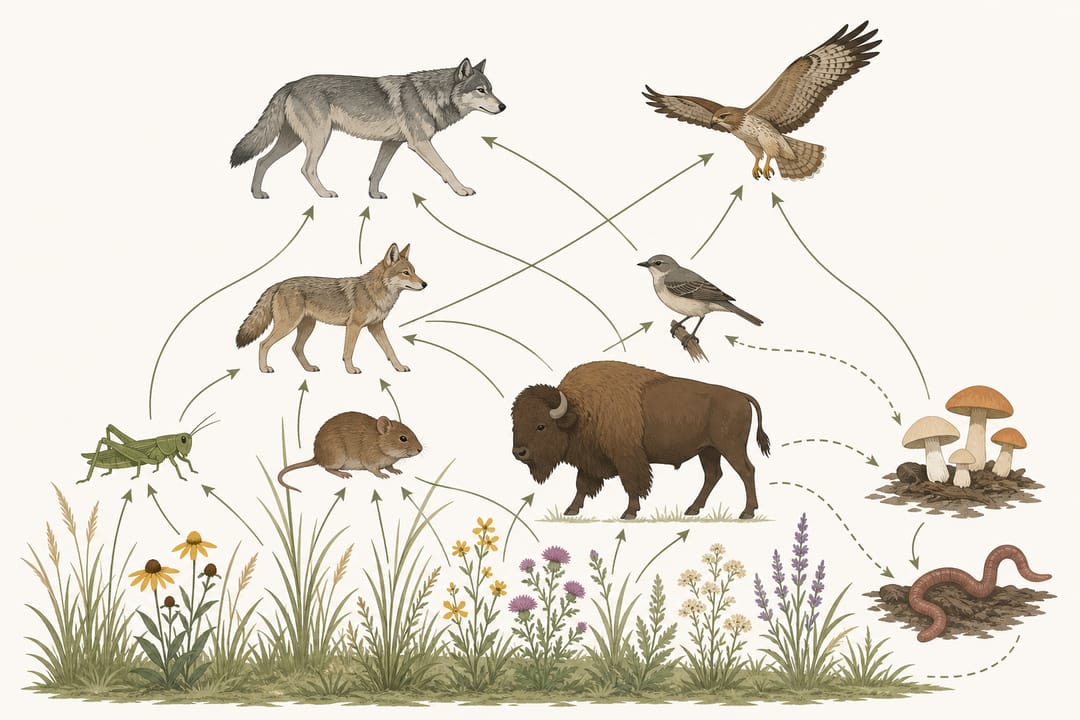 A temperate grassland food web links producers, consumers, and decomposers into one network.
Common Mistakes to Avoid
| Mistake | Why It Matters | Fix |
|---|---|---|
| Arrows pointing toward prey | Reverses energy flow direction | Arrow goes FROM prey TO predator |
| Omitting decomposers | Makes the diagram ecologically incomplete | Add fungi/bacteria connected to dead matter |
| Too many trophic levels (>6) | Biologically unrealistic due to 10% energy loss | Cap at 4–5 for most ecosystems |
| Mixing two separate ecosystems | Creates feeding relationships that do not occur | Stick to one defined habitat |
| Unlabelled nodes | Reader cannot identify organisms | Always label nodes |
| No legend | Arrow meaning is ambiguous | Add a "→ = energy flow" legend |
Food Web Diagram vs Other Ecological Diagrams
| Diagram Type | Shows | Best For |
|---|---|---|
| Food chain | Single linear feeding path | Introductory teaching, simple examples |
| Food web | Full network of feeding relationships | Accurate ecological representation |
| Energy pyramid | Biomass / energy at each trophic level | Quantitative analysis of energy transfer |
| Nutrient cycle | Element cycling (C, N, P) through ecosystem | Biogeochemical focus |
| Ecological network | Mathematical graph of interactions | Research and modelling |
Making Your Food Web Diagram with SciDraw AI
Once you have your organism list and feeding relationships mapped out, the time-consuming part is turning rough notes into a clean, publication-ready figure. SciDraw AI's food web maker lets you describe your ecosystem in plain text and generates a properly layered, arrow-correct food web diagram in seconds.
You can specify:
- The ecosystem type and key species
- The number of trophic levels to show
- Colour schemes (by trophic level, by taxon, or monochrome for print)
- Whether to include decomposer nodes
For biology educators and researchers who also need cellular-level figures, the cell illustration generator handles organelle diagrams and cross-section views with the same text-to-figure workflow — so you can keep your visual style consistent across a whole report or slide deck.
FAQ
Q: Which direction do arrows point in a food web? Arrows point from prey to predator — in the direction energy flows. If a rabbit is eaten by a hawk, the arrow goes: rabbit → hawk.
Q: What is the difference between a food web and a food chain? A food chain is one straight line (e.g. grass → rabbit → hawk). A food web overlaps many chains into a network that shows the full complexity of feeding relationships in an ecosystem.
Q: How many trophic levels should a food web have? Most realistic food webs have four to five trophic levels. Rarely more than six, because only ~10% of energy transfers between levels — higher levels simply cannot sustain populations.
Q: Should I include decomposers in my food web? Yes. Decomposers are ecologically essential and most science teachers and examiners expect to see them. Connect them to dead organic matter from every trophic level.
Q: What software is best for drawing a food web diagram? For quick, accurate diagrams without manual graphic design, SciDraw AI's food web maker is the fastest option. For fully manual control, tools like draw.io, Lucidchart, or Adobe Illustrator work but require more time.
Q: Can one organism belong to more than one trophic level? Yes. Omnivores like bears, humans, and raccoons feed across multiple trophic levels. In a food web diagram, you can show this by drawing arrows from multiple prey at different levels to the same omnivore node.