Free Food Chain Diagram Maker
Create a labeled food chain diagram from plain text
Describe the organisms and the order they feed in, and AI draws a clean, linear food chain diagram with arrows showing energy flow — ready for biology homework, ecology lessons, and classroom worksheets.
Food chain examples
Click any example to load its prompt, or use it as a starting point for your own food chain diagram.
What is a food chain?
A food chain is a simple linear diagram that shows how energy and nutrients pass from one organism to the next as each is eaten, starting with a producer and moving up through consumers to a top predator and decomposers. This food chain diagram maker turns a plain-text description into a clean, labeled food chain — you name the organisms and the order they feed in, and the AI draws a left-to-right (or top-to-bottom) sequence with arrows pointing in the direction of energy flow, tidy labels, and optional trophic-level names, all without any drawing or design work.
Why use a food chain diagram maker
- Food chains are the standard way to show how energy flows from producers to consumers in an ecosystem.
- Drawing a neat, labeled food chain with correctly pointing arrows by hand or in slide software is slow and fiddly.
- Students learning trophic levels and energy flow grasp the idea far better from a clearly labeled food chain diagram.
- Teachers and tutors need quick, presentable ecology diagrams for worksheets, lesson slides, and study guides.
- Swapping organisms, adding a decomposer, or changing the habitat and regenerating is much faster than redrawing by hand.
How to make a food chain diagram
List the organisms in feeding order, starting with the producer and ending with the top consumer, and say whether you want it drawn left to right or top to bottom. Then add any features you need: arrows pointing in the direction of energy flow, trophic-level labels such as producer and primary consumer, a decomposer at the end, or a specific habitat like ocean or forest. Generate the food chain diagram, check the organisms, arrows, and labels, and refine the description if anything is unclear.
Parts of a food chain
- Producer — the green plant or alga at the start of the chain that makes its own food through photosynthesis.
- Primary consumer — the herbivore that eats the producer, occupying the second trophic level.
- Secondary consumer — the carnivore or omnivore that eats the primary consumer.
- Tertiary consumer — the higher-level predator that feeds on secondary consumers, often near the top of the chain.
- Decomposer — bacteria or fungi that break down dead organisms and return nutrients to the ecosystem.
- Energy-flow arrows — arrows pointing from each organism to the next, showing the direction energy and nutrients travel.
Food Chain Diagram Maker FAQ
What is a food chain?
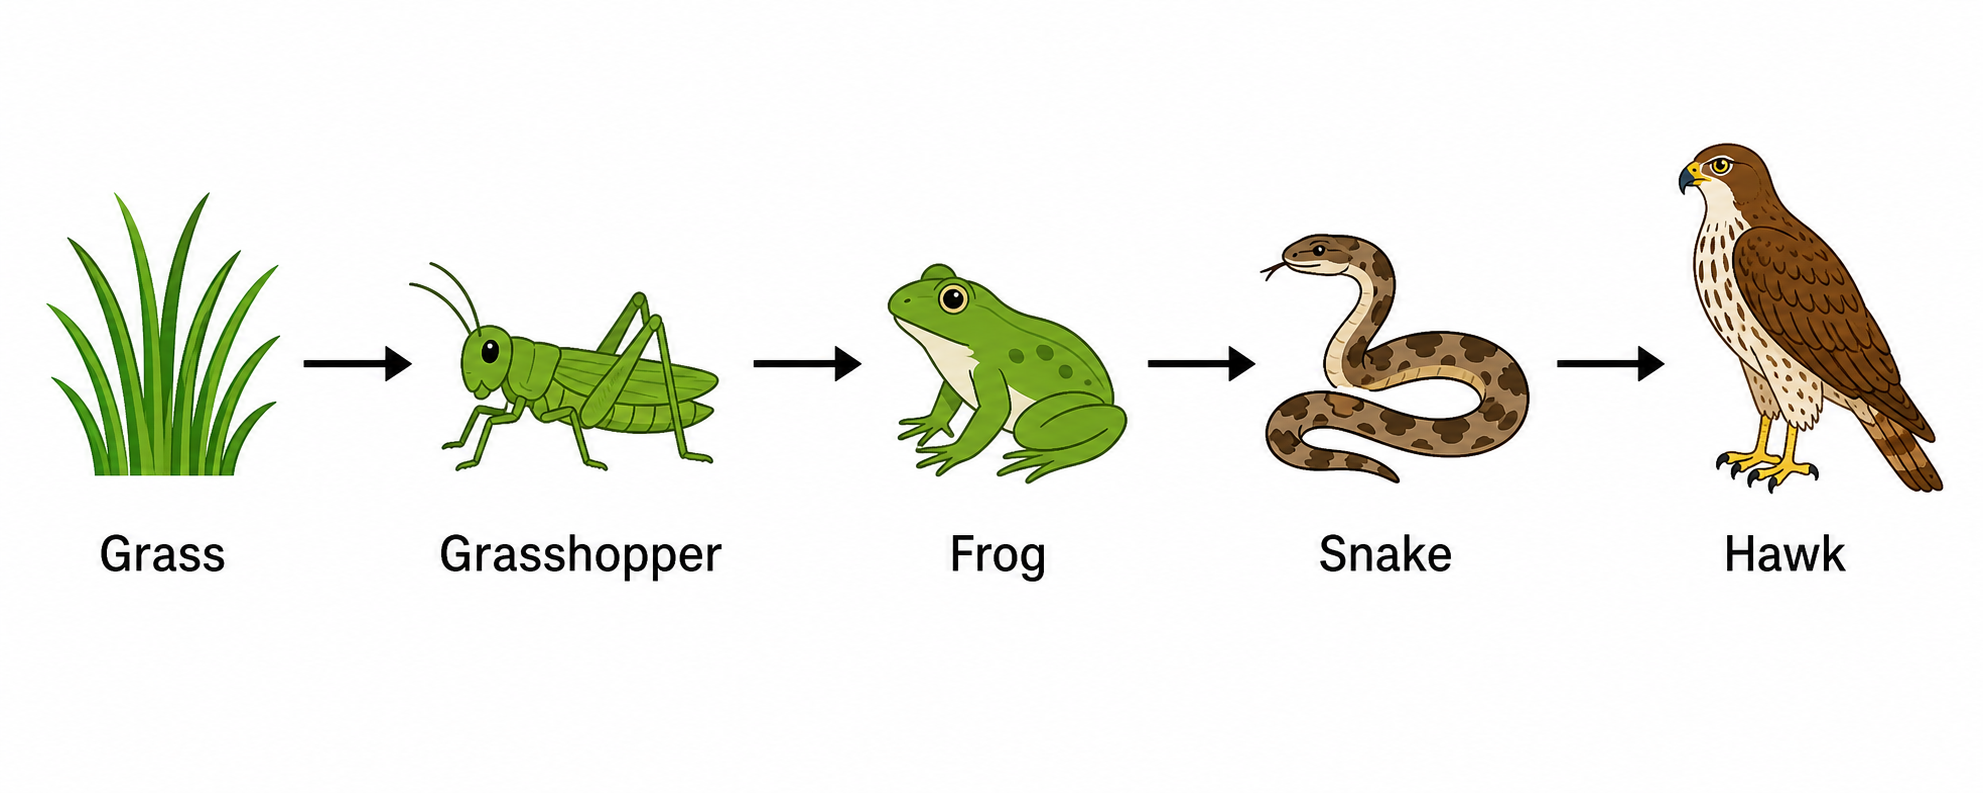
A food chain is a linear sequence that shows how energy and nutrients pass from one organism to the next as each is eaten. It begins with a producer, such as a plant, and moves through primary, secondary, and tertiary consumers up to a top predator, often ending with decomposers. In a food chain diagram, arrows point in the direction of energy flow, from the organism being eaten to the one that eats it.
How do I make a food chain diagram online?
Type a short description, such as a food chain from grass to grasshopper to frog to snake to hawk, and list the organisms in feeding order. SciDraw AI then draws a clean, labeled linear food chain with arrows showing energy flow. You can adjust the organisms, habitat, or labels and regenerate until the food chain diagram matches what you need.
What is the difference between a food chain and a food web?
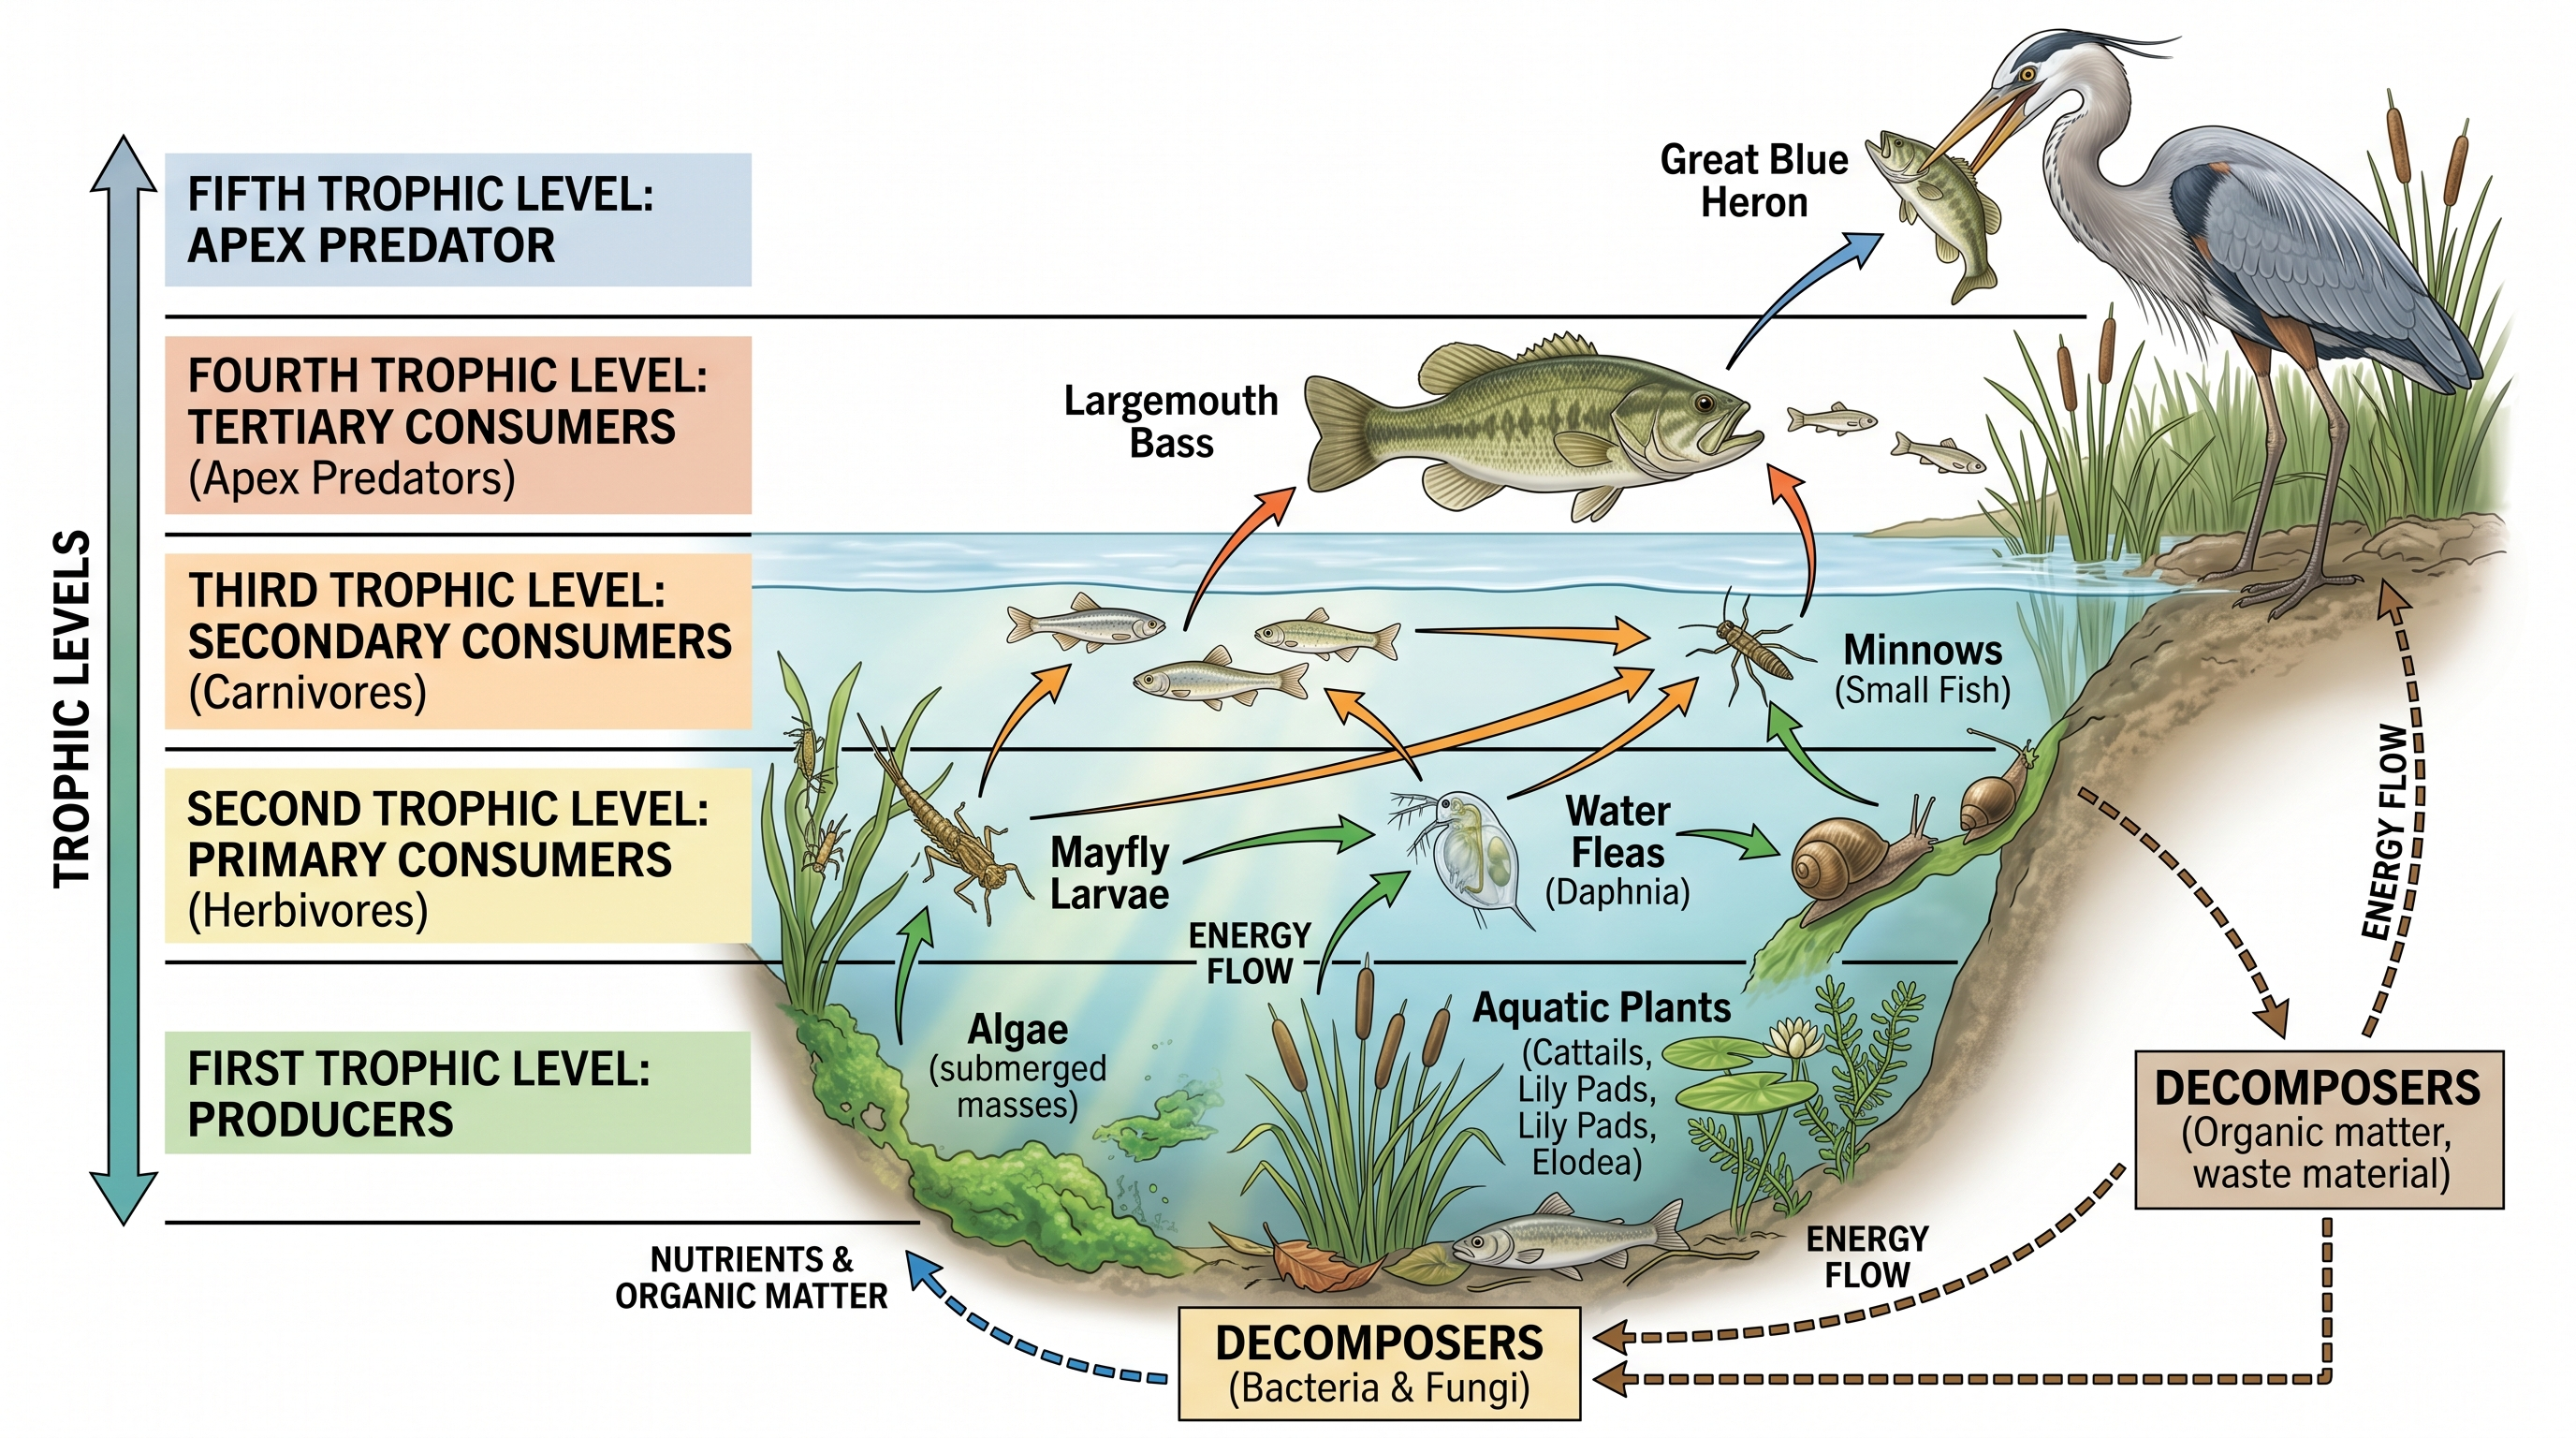
A food chain is a single linear path that follows energy from one producer up through a series of consumers, while a food web is a network of many interconnected food chains that shows all the feeding relationships in an ecosystem at once. Use a food chain diagram to teach a simple, step-by-step sequence, and a food web when you need to show how multiple chains overlap and connect.
Can it show ocean, forest, and other habitats?
Yes. You can generate a food chain for almost any habitat — an ocean food chain from phytoplankton to fish to a predator, a forest food chain with producers and herbivores, or a grassland, desert, or pond chain. Just name the habitat and the organisms you want, and the tool draws the sequence with arrows and labels.
Is the food chain diagram generator free?
Yes, you can start for free. Create an account and you receive free credits to generate food chain diagrams right away, with paid plans available if you need to make many ecology and biology diagrams on a regular basis.
Is it suitable for biology or ecology class?
Absolutely. The diagrams are well suited to biology and ecology classes, as well as worksheets, flashcards, lesson slides, and study guides. Generate a labeled food chain diagram or a blank version for students to complete, covering the exact organisms and trophic levels your lesson needs.
Draw your food chain diagram now
Describe the organisms and habitat you need and get a clean, labeled food chain diagram in seconds. Start free with SciDraw AI.