CONSORT-Flussdiagramm-Generator
Die Einschlusszahlen deiner Studie in eine publikationsreife Abbildung verwandeln
Beschreibe den Teilnehmerfluss deiner klinischen Studie — gescreent, ausgeschlossen, randomisiert, zugeteilt, aus der Nachbeobachtung ausgeschieden und ausgewertet — und die KI zeichnet ein sauberes CONSORT-2010-Flussdiagramm mit beschrifteten Kästchen und n=-Zählungen, fertig für Manuskripte und Vorträge.
CONSORT-Diagramm-Beispiele
Klicke auf ein Beispiel, um den zugehörigen Prompt zu laden, oder nutze es als Ausgangspunkt für dein eigenes CONSORT-Flussdiagramm.
Was leistet dieser CONSORT-Flussdiagramm-Generator?
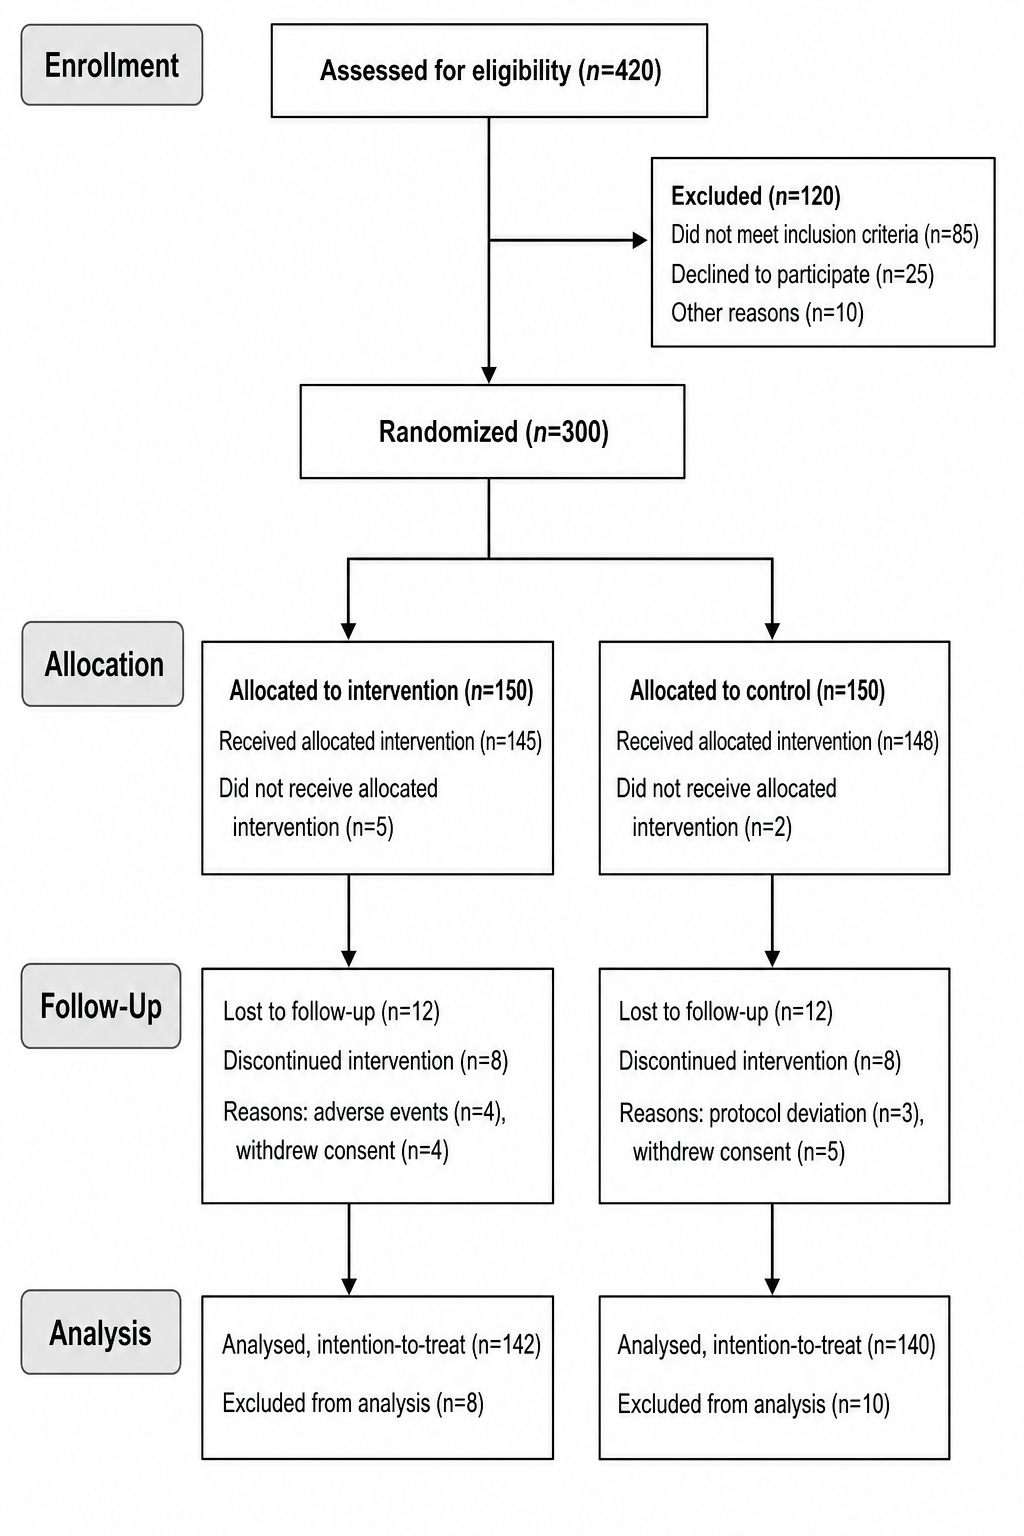
Er verwandelt die Beschreibung des Teilnehmerflusses deiner klinischen Studie in ein sauberes CONSORT-2010-Flussdiagramm — das übliche Top-down-Flussdiagramm, das Teilnehmende durch Einschluss, Zuteilung, Nachbeobachtung und Auswertung verfolgt. Du beschreibst, wie viele auf Eignung gescreent, mit Begründung ausgeschlossen, randomisiert, den einzelnen Interventionsarmen zugeteilt, aus der Nachbeobachtung ausgeschieden und ausgewertet wurden, und die KI zeichnet die beschrifteten Kästchen, vertikalen Pfeile und Ausschluss-Seitenäste mit Teilnehmerzahlen (n=) in jedem Kästchen — ganz ohne Diagramm-Software oder manuelles Ausrichten.
Warum einen CONSORT-Flussdiagramm-Generator nutzen
- Das CONSORT-Flussdiagramm wird von den meisten Zeitschriften verlangt, die über randomisierte kontrollierte Studien berichten.
- Kästchen, Pfeile und parallele Arme von Hand in Zeichenprogrammen auszurichten ist langsam und fummelig.
- Ausschlüsse, aus der Nachbeobachtung Ausgeschiedene und Auswertungszahlen zu zeigen macht den Teilnehmerfluss für Gutachter transparent.
- Forschende brauchen schnell eine saubere, konsistente Abbildung für Manuskripte, Poster und Vorträge.
- Aus einer Beschreibung neu zu generieren ist schneller, als das Diagramm bei jeder geänderten Zahl neu zu zeichnen.
So erstellst du ein CONSORT-Flussdiagramm
Liste deine Zahlen für jede Phase auf: wie viele auf Eignung gescreent, wie viele mit welchen Gründen ausgeschlossen und wie viele randomisiert wurden; wie viele jeder Intervention zugeteilt wurden und sie erhielten; wie viele aus der Nachbeobachtung ausschieden oder die Intervention abbrachen; und wie viele unter Intention-to-Treat ausgewertet oder von der Auswertung ausgeschlossen wurden. Generiere das Diagramm, prüfe dann, dass jedes Kästchen die richtige n=-Zahl trägt und die Arme ausgewogen sind, und verfeinere es, bis es zu deiner Studie passt.
Bestandteile eines CONSORT-Flussdiagramms
- Einschluss (Enrollment) — auf Eignung gescreent, mit Begründung ausgeschlossen und randomisiert.
- Zuteilung (Allocation) — den einzelnen Interventionsarmen Zugeteilte und wie viele die Intervention erhielten.
- Nachbeobachtung (Follow-Up) — aus der Nachbeobachtung Ausgeschiedene und Interventionsabbrüche, mit Zahlen und Gründen.
- Auswertung (Analysis) — Ausgewertete und von der Auswertung Ausgeschlossene, typischerweise Intention-to-Treat.
- Teilnehmerzahlen — eine n=-Zahl in jedem Kästchen.
- Flusspfeile — vertikale Pfeile für den Hauptfluss und Seitenäste für Ausschlüsse.
Häufige Fragen zum CONSORT-Flussdiagramm-Generator
Was ist ein CONSORT-Flussdiagramm?
Ein CONSORT-Flussdiagramm ist das übliche Top-down-Flussdiagramm, das Teilnehmende durch die vier Phasen einer randomisierten kontrollierten Studie verfolgt — Einschluss, Zuteilung, Nachbeobachtung und Auswertung. Es folgt dem CONSORT-2010-Statement und zeigt, wie viele Teilnehmende gescreent, ausgeschlossen, randomisiert, zugeteilt, aus der Nachbeobachtung ausgeschieden und ausgewertet wurden, mit Zahlen in jedem Kästchen.
Welche Informationen brauche ich dafür?
Du brauchst die Teilnehmerzahlen für jede Phase: die Anzahl der auf Eignung Gescreenten und Ausgeschlossenen (mit Gründen), die Anzahl der Randomisierten, wie viele jeder Intervention zugeteilt wurden und sie erhielten, wie viele aus der Nachbeobachtung ausschieden oder abbrachen und wie viele ausgewertet wurden. Beschreibe diese, und der Generator setzt jedes n= ins richtige Kästchen.
Wie unterscheidet sich ein CONSORT-Diagramm von einem PRISMA-Diagramm?
Es sind unterschiedliche Standards für unterschiedliche Studien. Ein CONSORT-Diagramm zeigt den Teilnehmerfluss durch eine randomisierte klinische Studie (Einschluss, Zuteilung, Nachbeobachtung, Auswertung), während ein PRISMA-Diagramm die Studienauswahl in einem systematischen Review oder einer Metaanalyse zeigt (identifizierte, gescreente und eingeschlossene Datensätze). Verwende CONSORT für Studien und PRISMA für Reviews.
Kann er mehr als zwei Arme oder ein Crossover-Design abbilden?
Ja. Beschreibe die Anzahl der Arme — zweiarmig parallel, dreiarmig multizentrisch oder ein Crossover mit randomisierten Sequenzen und einer Auswaschphase — samt den zugehörigen Zahlen, und der Generator legt entsprechend ausgewogene parallele Spalten oder Sequenzpfade an.
Kann ich Ausschlussgründe und aus der Nachbeobachtung Ausgeschiedene zeigen?
Ja. Liste die Ausschlussgründe mit Zahlen sowie die aus der Nachbeobachtung Ausgeschiedenen oder die Intervention Abbrechenden in jedem Arm auf, und das Diagramm ergänzt die Seitenäste und Nachbeobachtungskästchen, sodass Gutachter genau sehen, wo Teilnehmende die Studie verließen.
Kann ich eine bearbeitbare Abbildung exportieren?
SciDraw AI kann in Vektorformate exportieren, sodass du Kästchen, Zahlen und Beschriftungen nachträglich anpassen kannst. Prüfe jedes n= vor dem Einreichen stets gegen deine Studienunterlagen.
Weitere Tools entdecken
Medizinischer Illustrations-Generator
Erstellen Sie Anatomiegrafiken, klinische Schemata und Lehrillustrationen
Kostenlos testen
Klinischer Illustrations-Generator
Anatomie-Diagramme und OP-Schemata erstellen
Kostenlos testen
Medizinische Infografiken
Erstellen Sie medizinische Infografiken und Patientenaufklärungsmaterialien
Kostenlos testenBrauchst du weitere wissenschaftliche Abbildungen?
Erstelle PRISMA-Flussdiagramme, Forest-Plots, Überlebenskurven und weitere wissenschaftliche Abbildungen mit SciDraw AI.