KI-Generator für wissenschaftliche Abbildungen & Illustrationen
Erstellen Sie in Sekundenschnelle Abbildungen, Diagramme und Graphical Abstracts mit KI – für Paper, Abschlussarbeiten, Poster und Lehre. 3 KI-Modi + SVG-Vektorexport. Über 35.000 Forschende, Studierende und Lehrende vertrauen darauf.
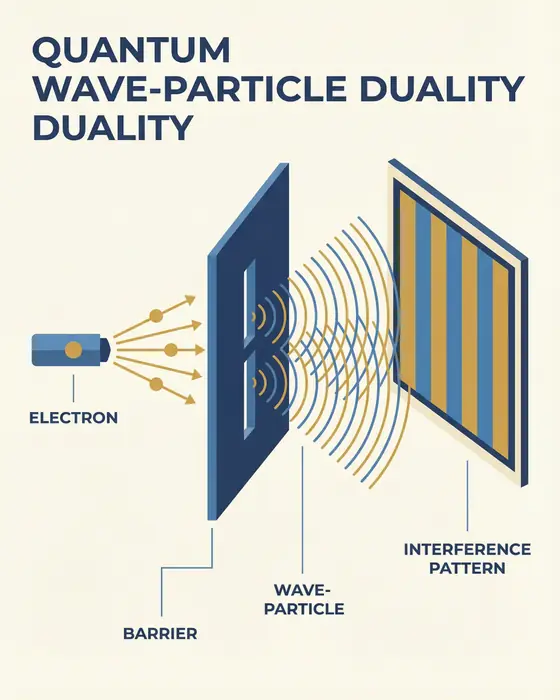
Physics concept visualization: Quantum wave-particle duality, electron passing through double-slit experiment
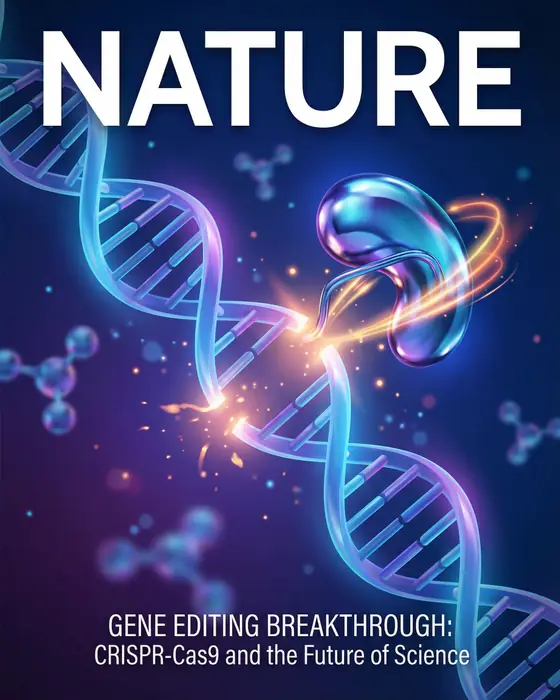
DNA CRISPR gene editing visualization
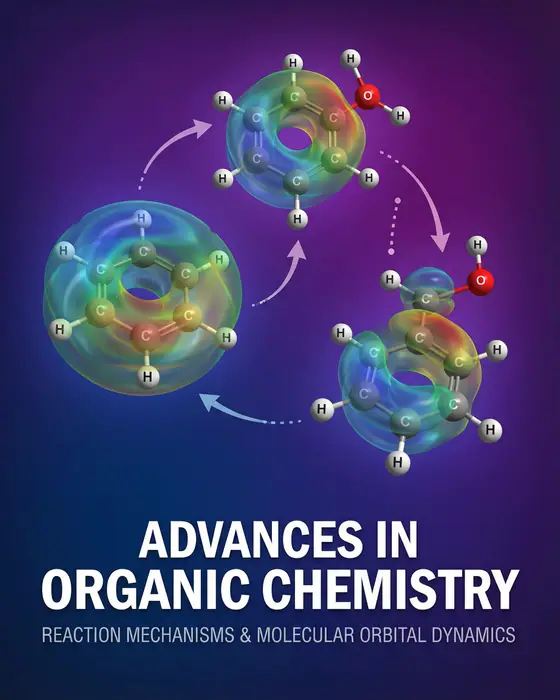
Organic chemistry molecular orbital visualization
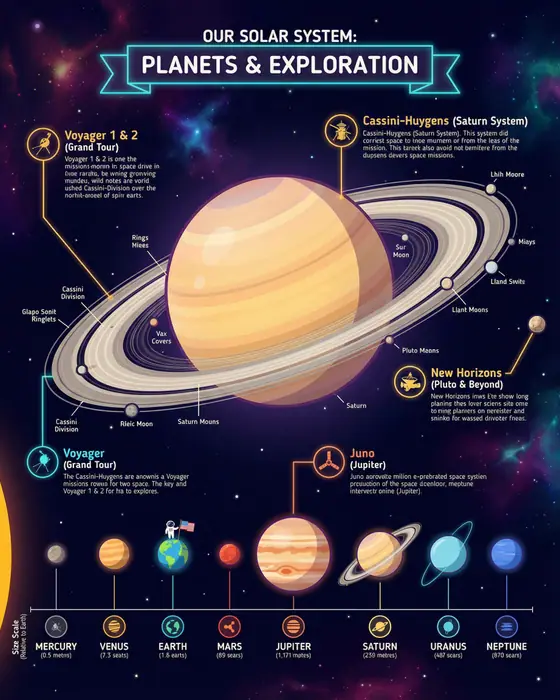
Solar system planets comparison with size scales
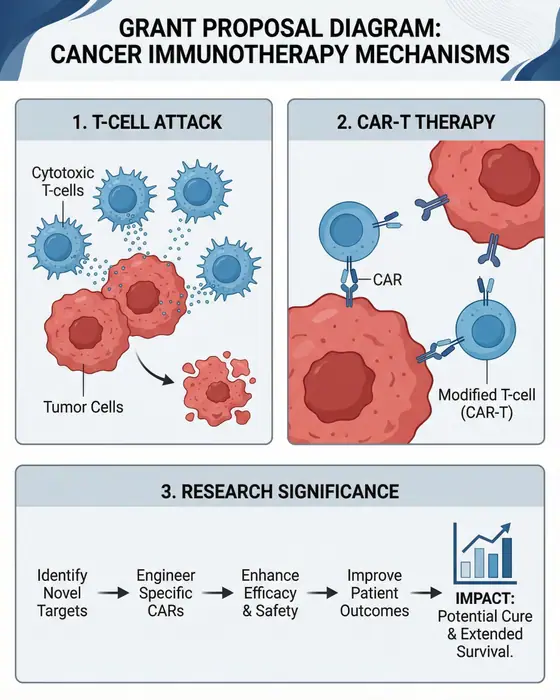
Cancer immunotherapy CAR-T therapy mechanism
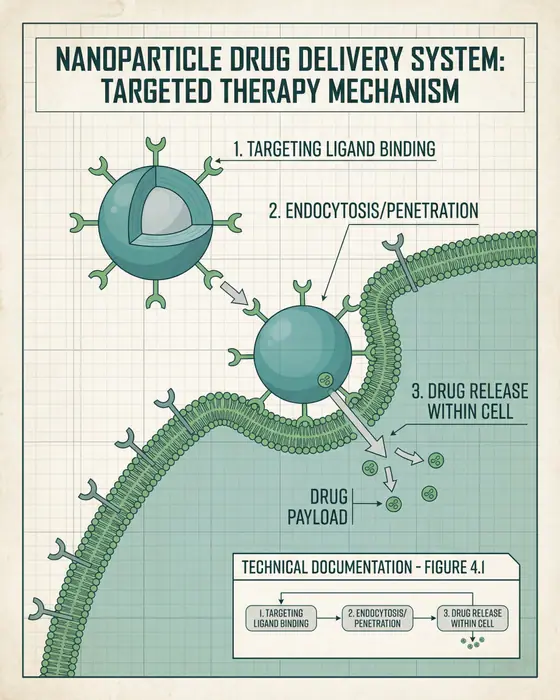
Nanoparticle drug delivery system visualization
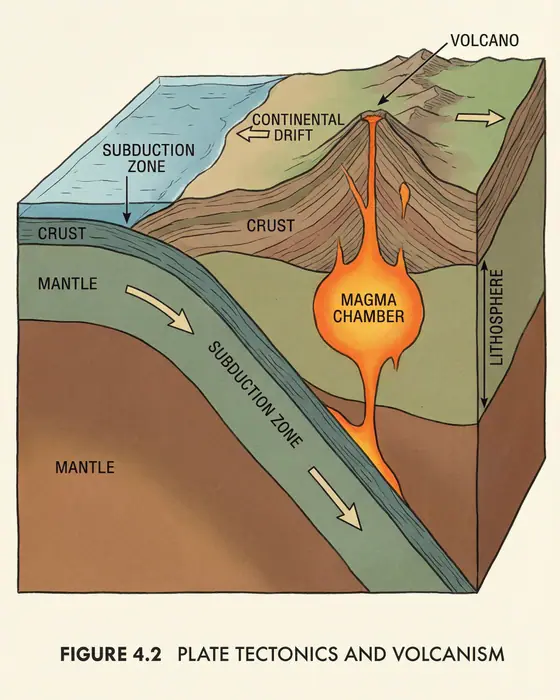
Plate tectonics and volcanic formation cross-section
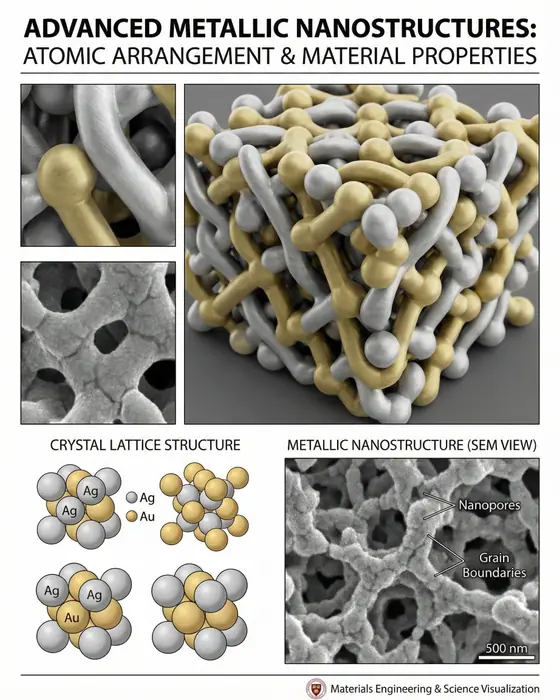
Crystal lattice structure and metallic nanostructure
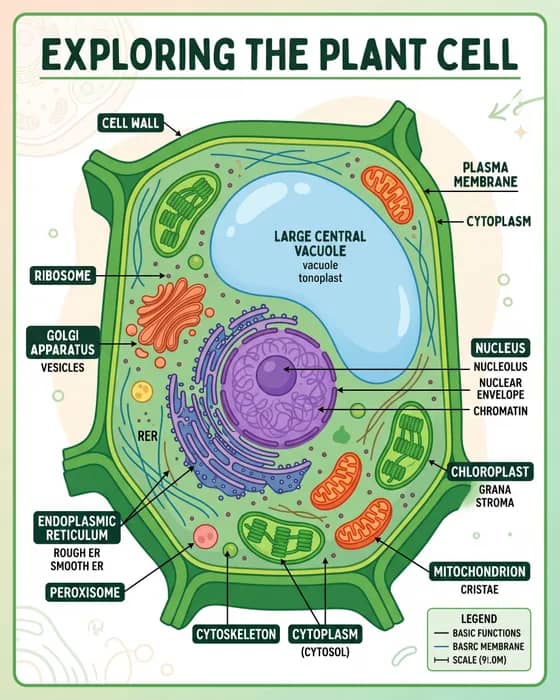
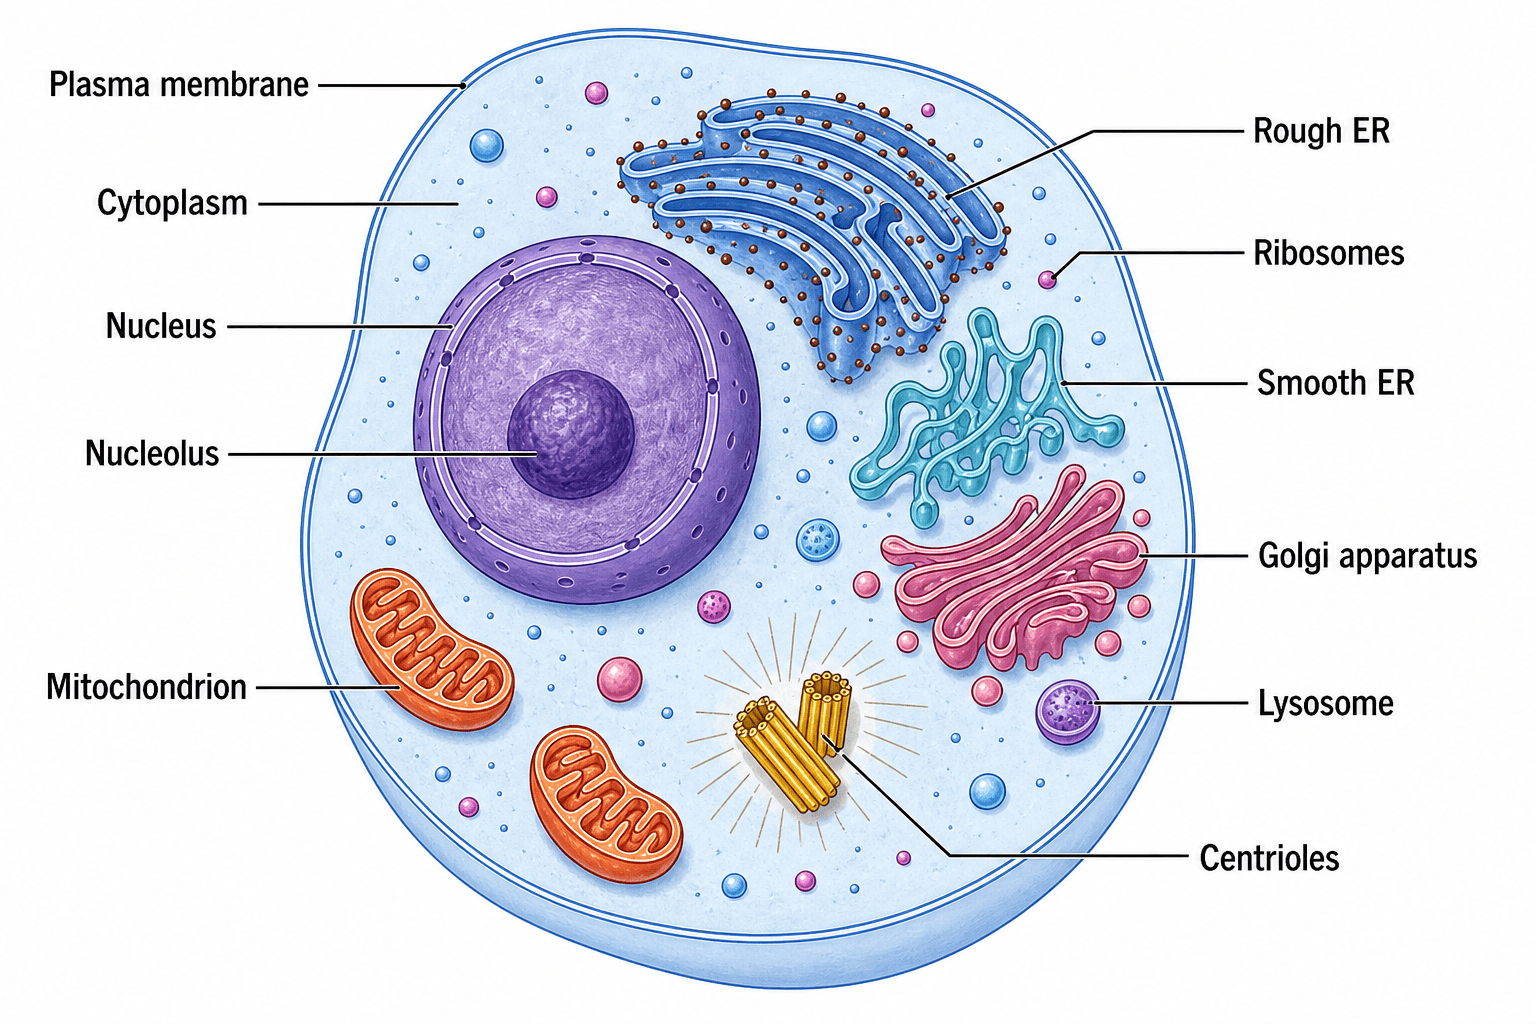
Labeled plant cell cross-section, biology classroom teaching poster
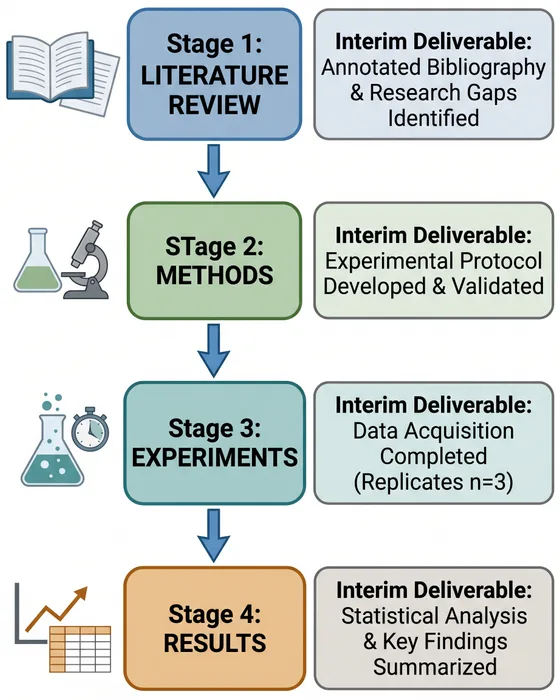
Graduate thesis research roadmap with four labeled stages
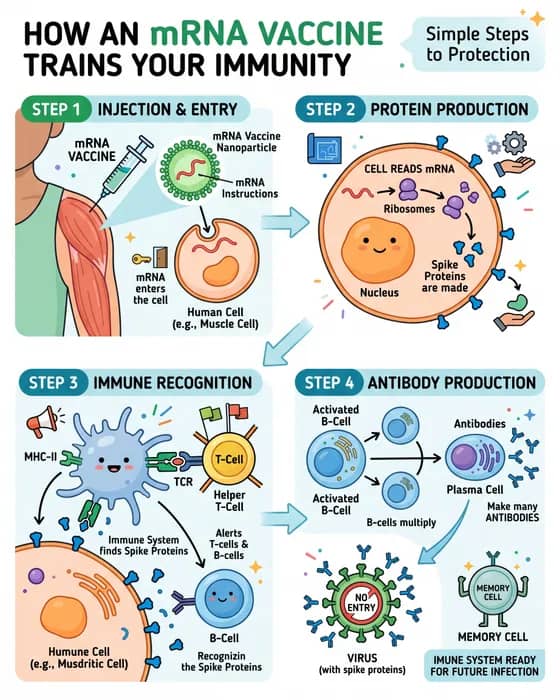
How an mRNA vaccine trains the immune system, science communication infographic
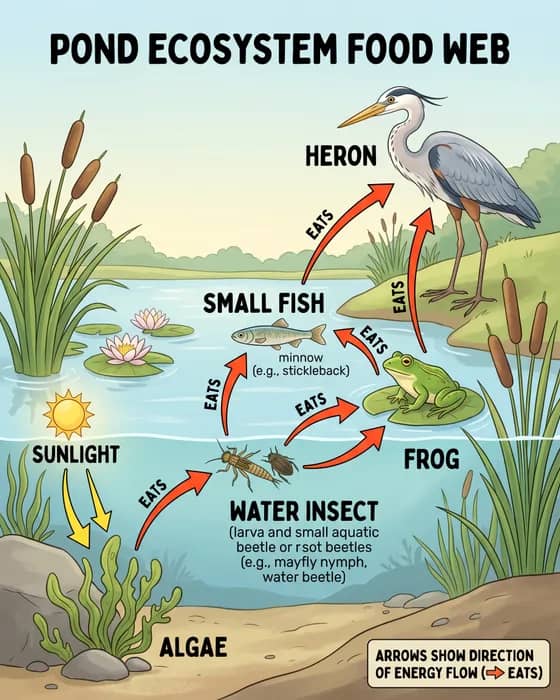
Pond ecosystem food web with energy-flow arrows, K-12 science diagram
Physics concept visualization: Quantum wave-particle duality, electron passing through double-slit experiment
DNA CRISPR gene editing visualization
Organic chemistry molecular orbital visualization
Solar system planets comparison with size scales
Cancer immunotherapy CAR-T therapy mechanism
Nanoparticle drug delivery system visualization
Plate tectonics and volcanic formation cross-section
Crystal lattice structure and metallic nanostructure
Labeled plant cell cross-section, biology classroom teaching poster
Graduate thesis research roadmap with four labeled stages
How an mRNA vaccine trains the immune system, science communication infographic
Pond ecosystem food web with energy-flow arrows, K-12 science diagram
KI-Wissenschaftsillustrationen · editierbarer SVG- und PPTX-Export
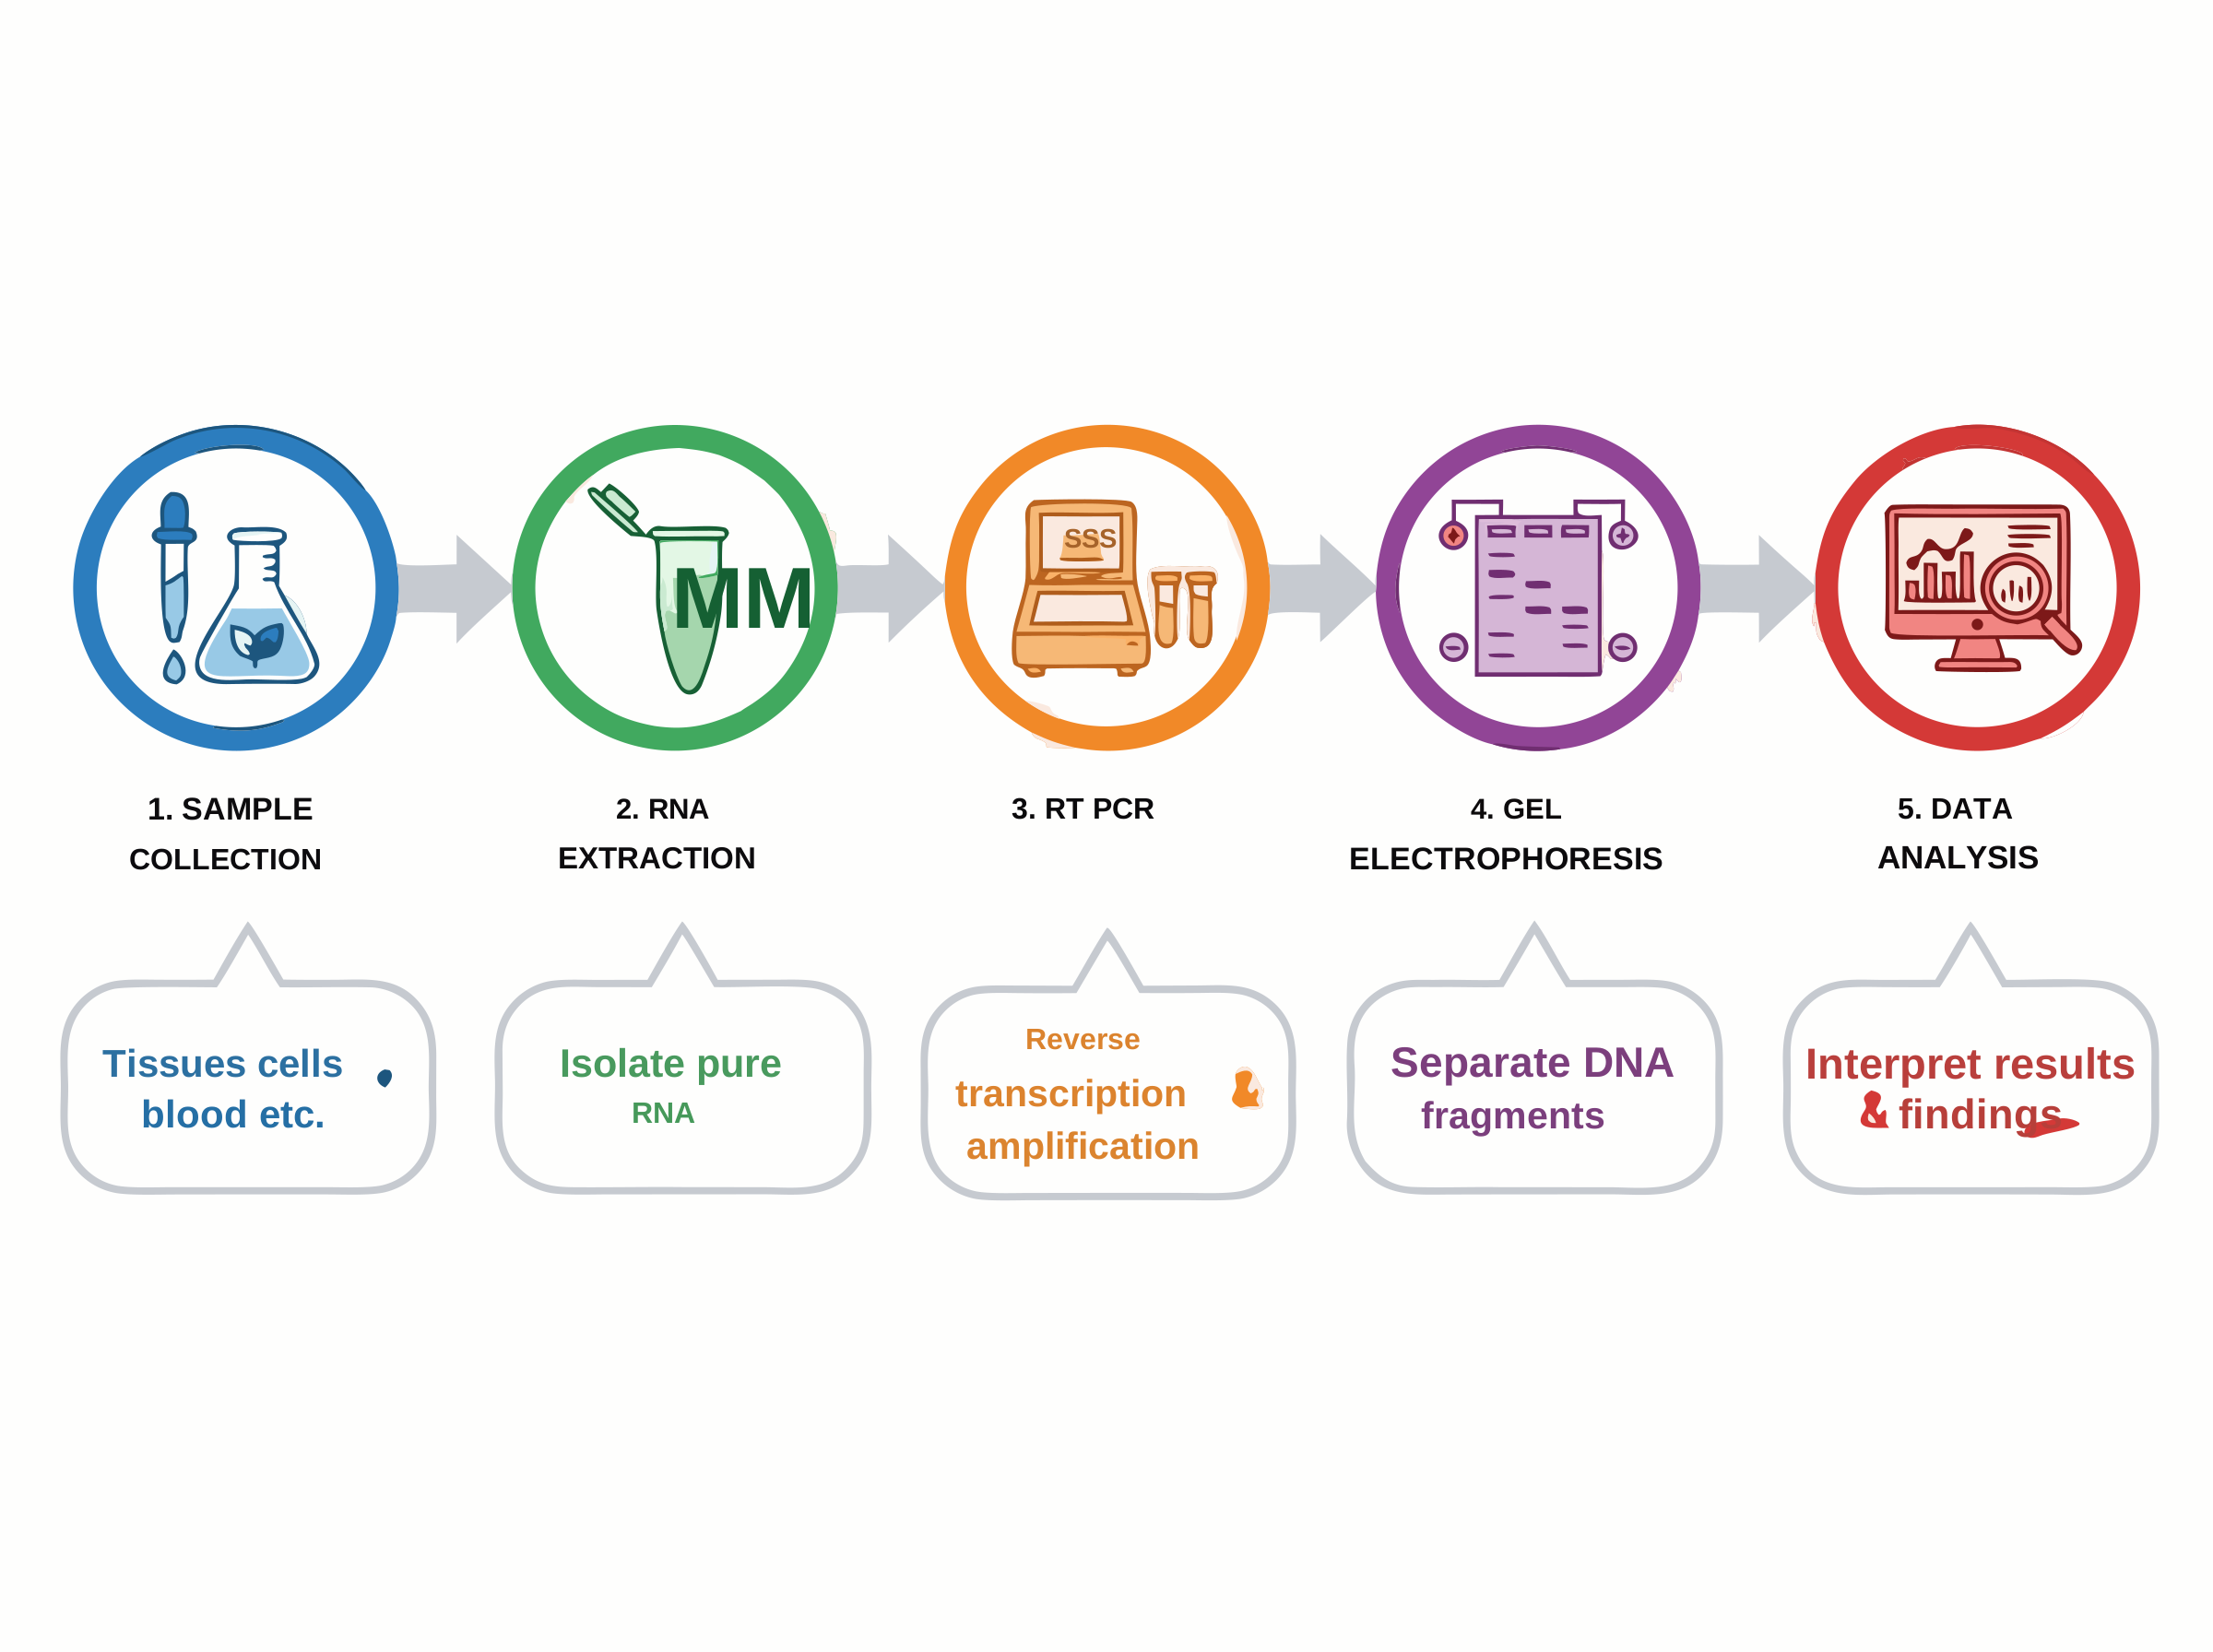
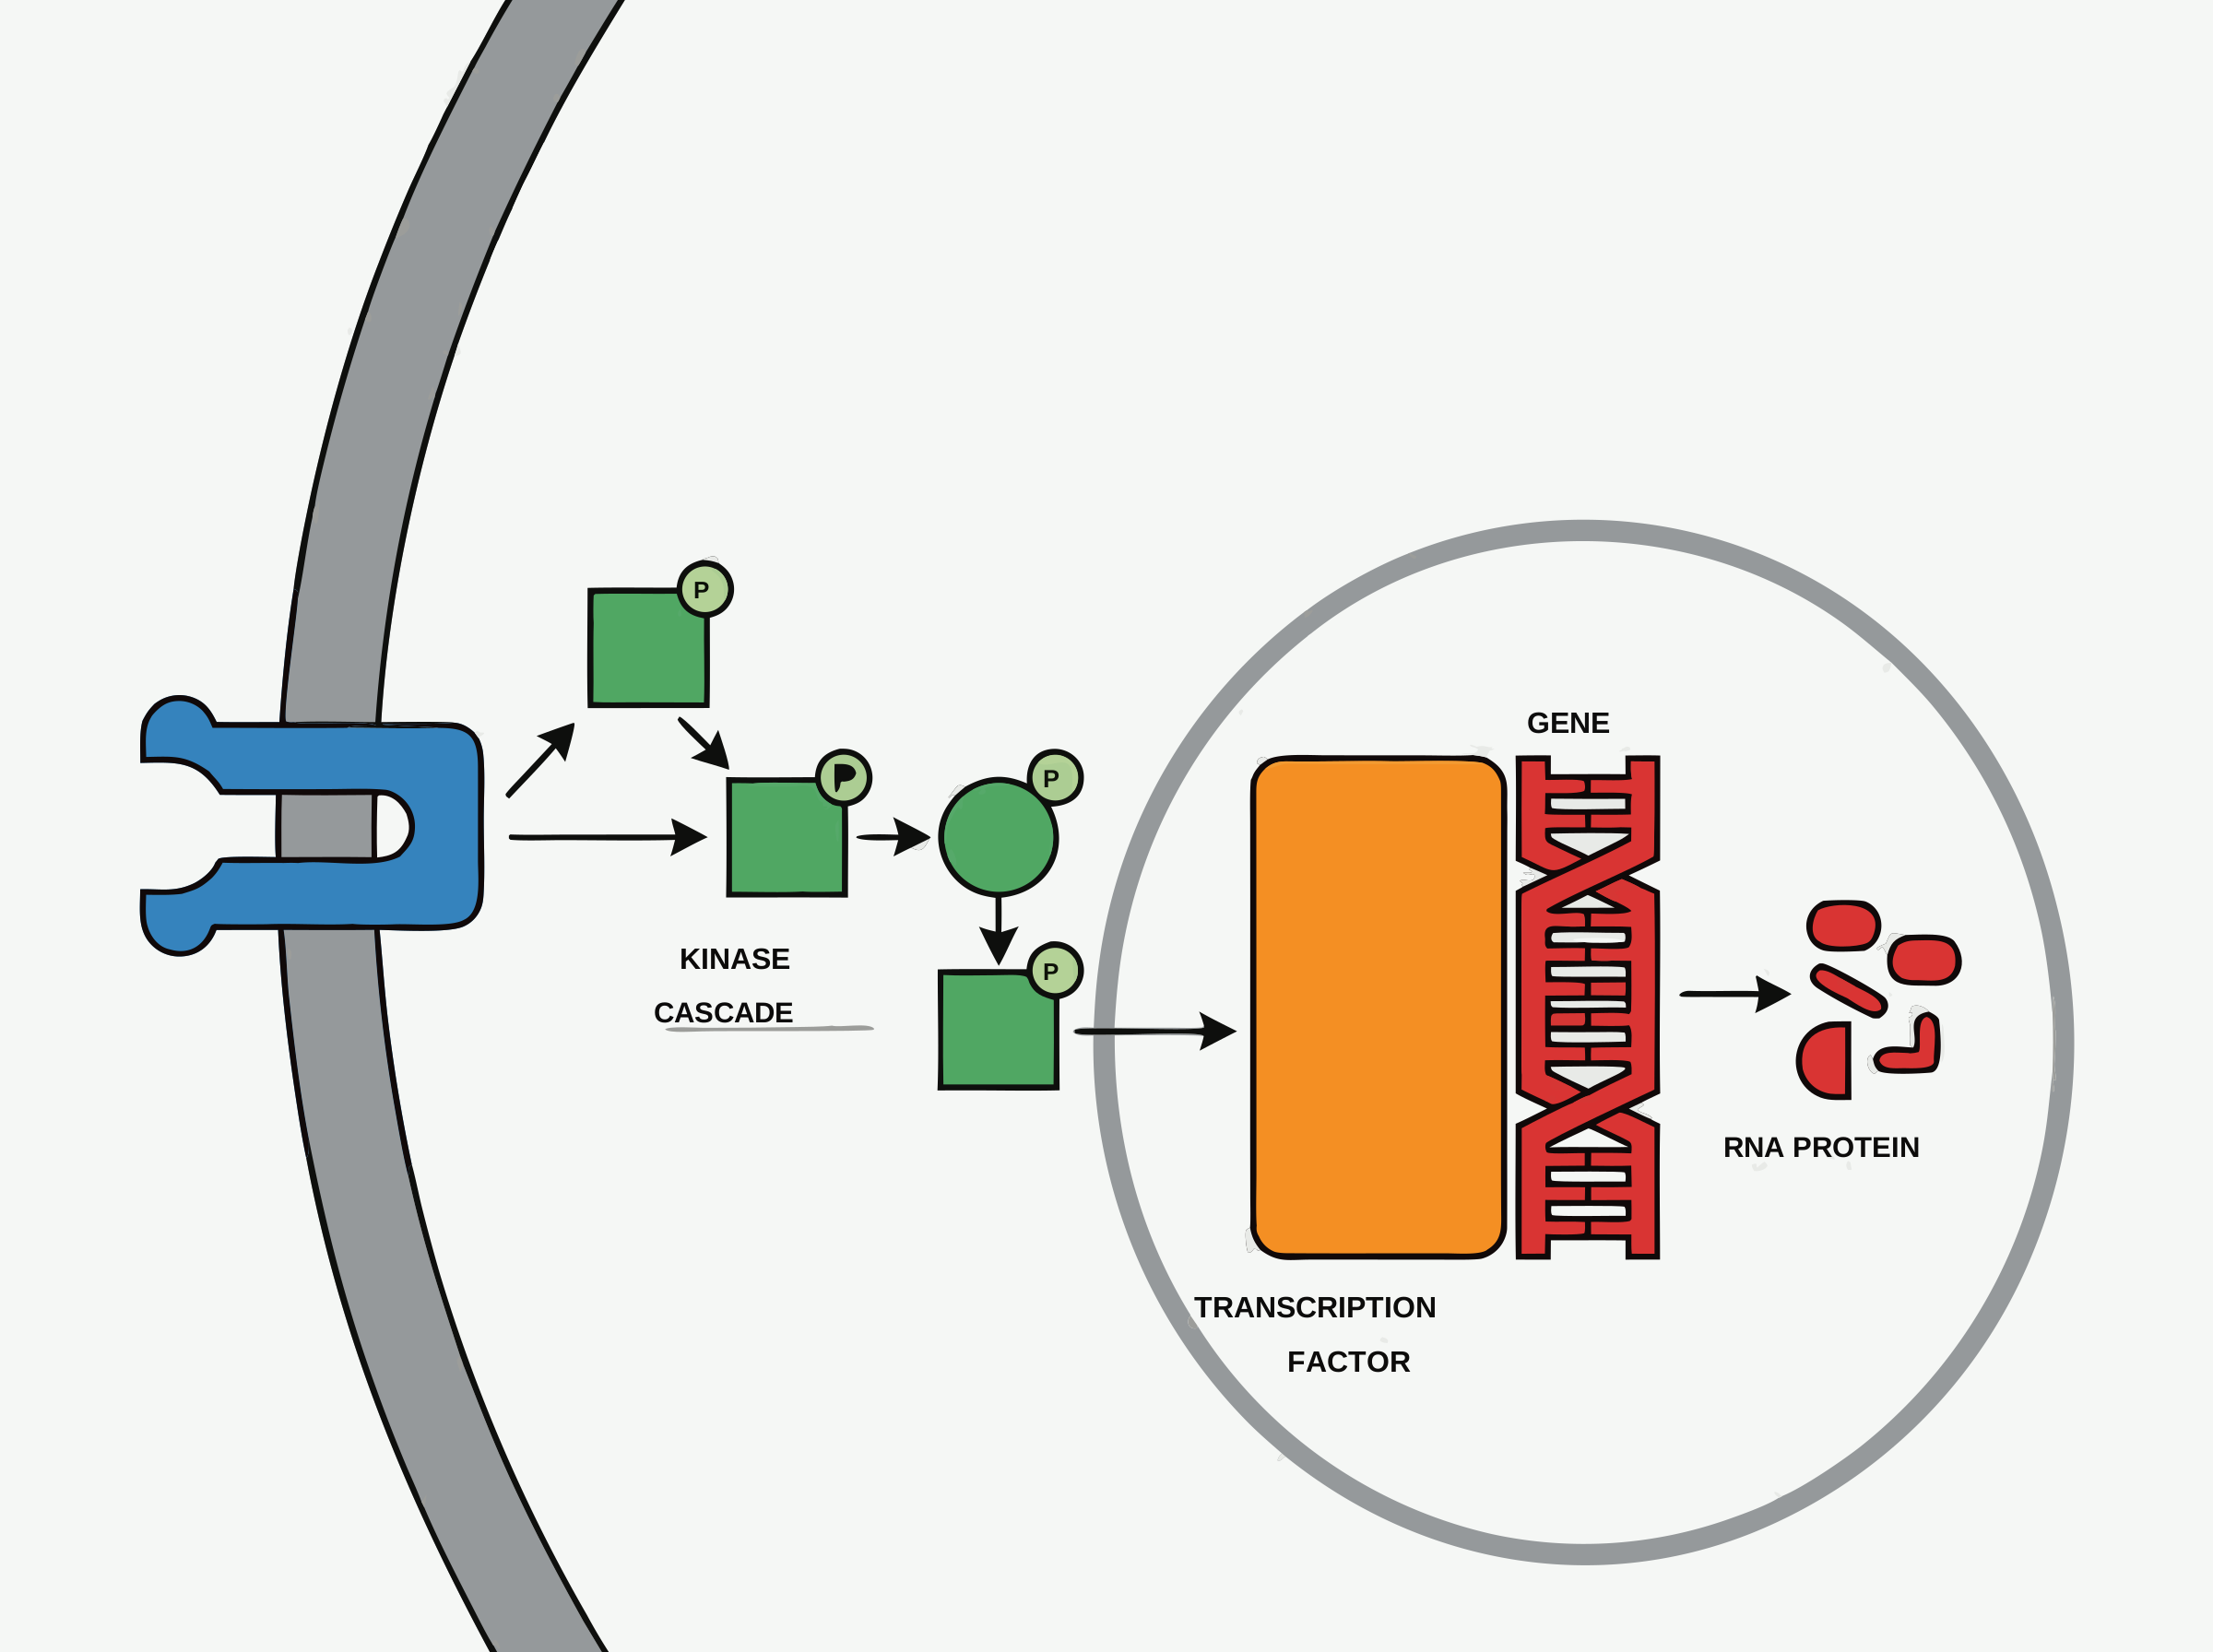
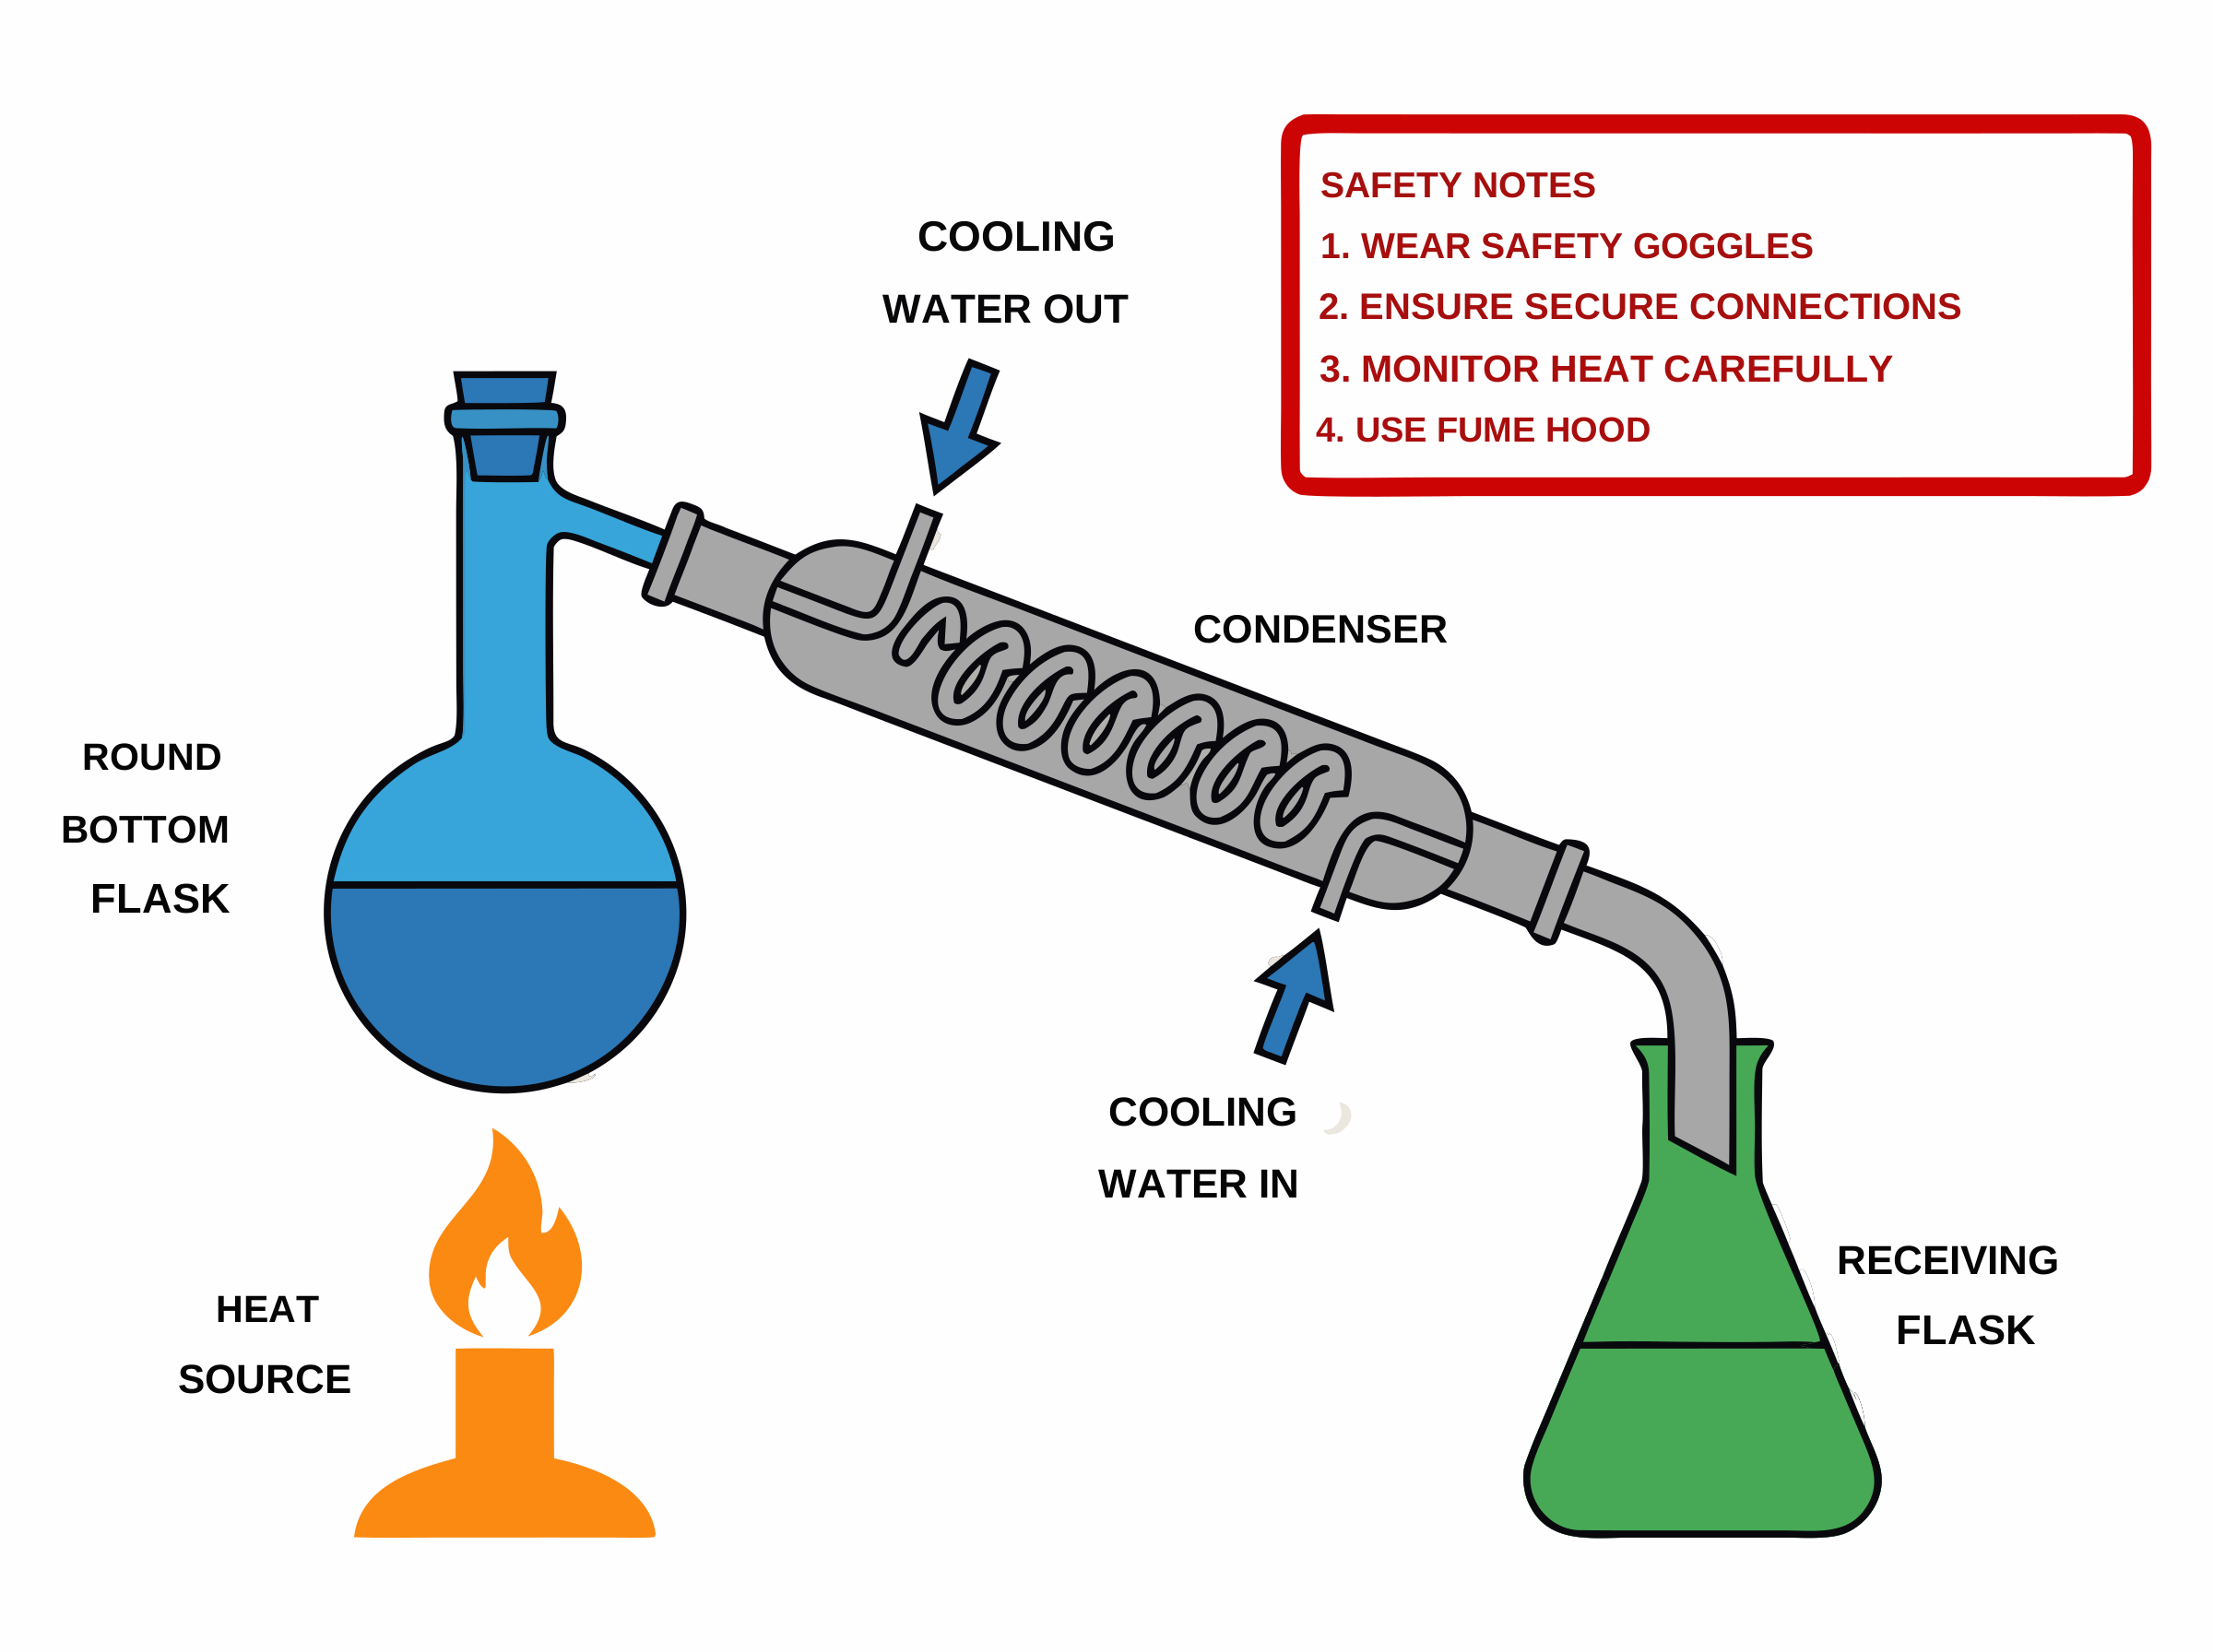
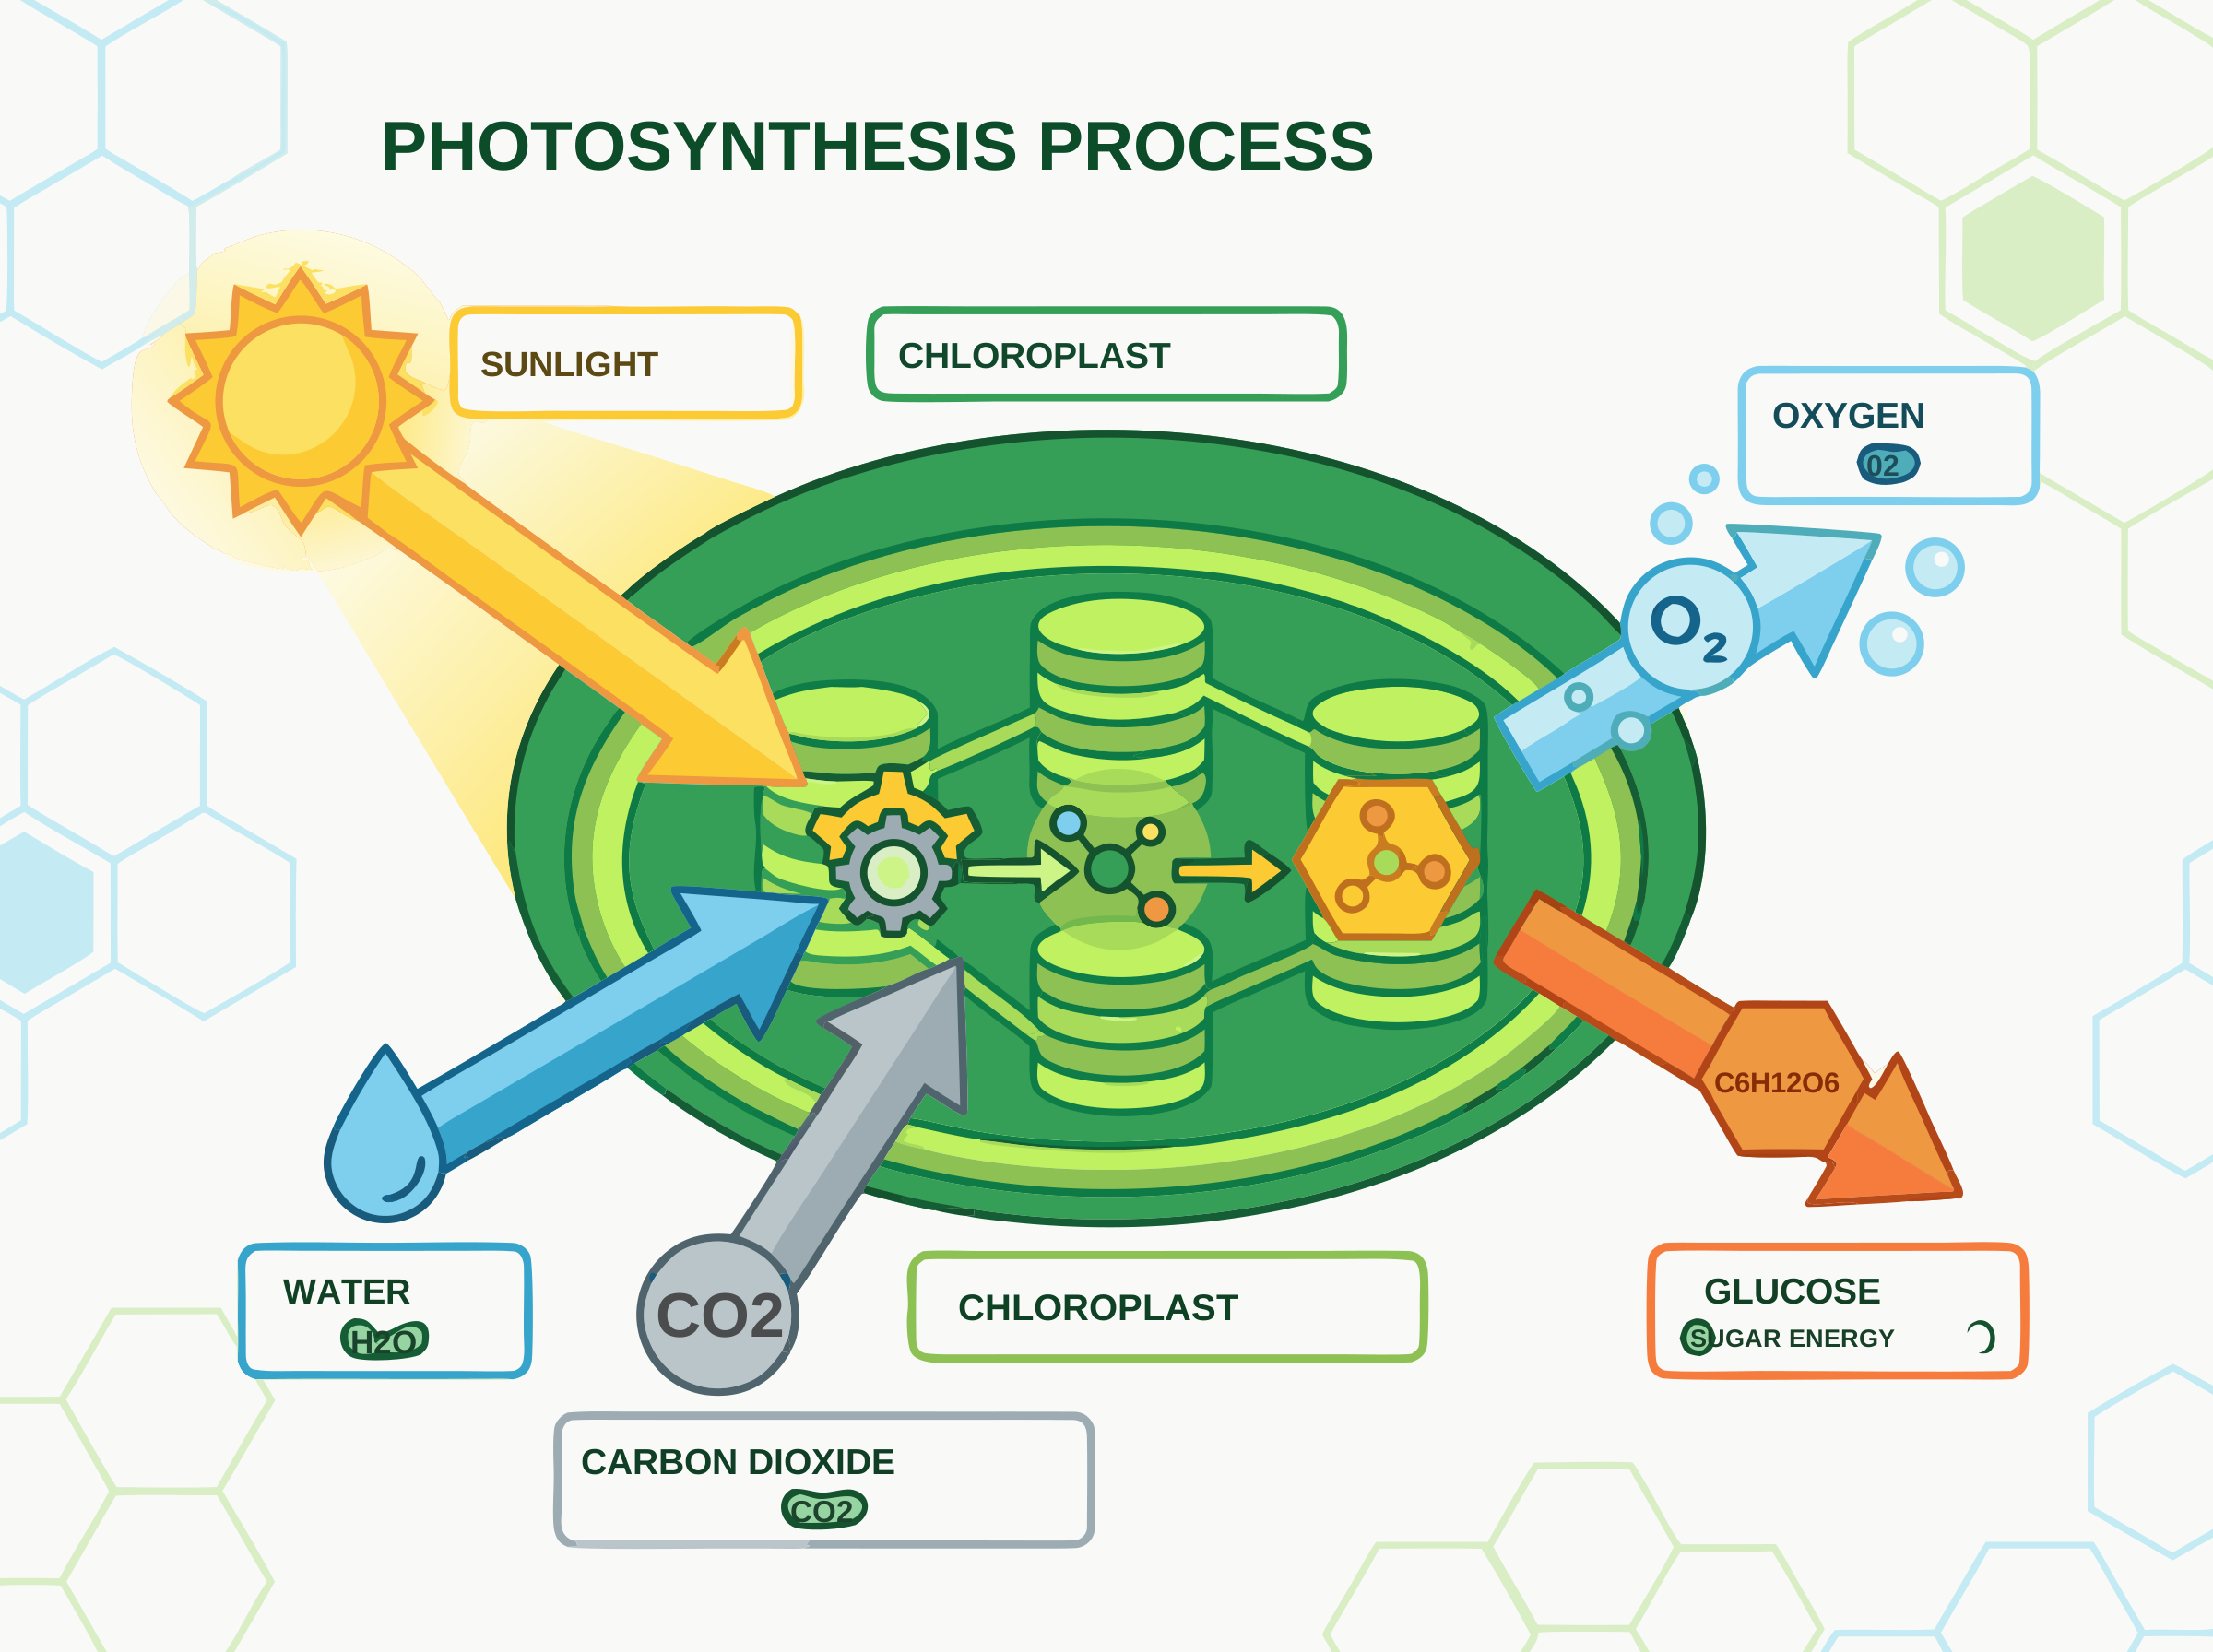
3 KI-Generierungsmodi + editierbarer SVG-/PPTX-Export — für Journal-Einreichungen, Abschlussarbeiten und Folien
- 01
Erstellen
Beschreiben Sie die Abbildung in Worten oder laden Sie eine Skizze oder ein Referenzbild hoch – die KI erzeugt sie.
- 02
Bearbeiten
In mehreren Runden per Dialog verfeinern, dann Beschriftungen, Farben und Layout direkt in der SVG- oder PPTX-Datei anpassen.
- 03
Teilen
Als SVG, PPTX oder PNG exportieren – für Einreichungen, Abschlussarbeiten, Folien und Poster.
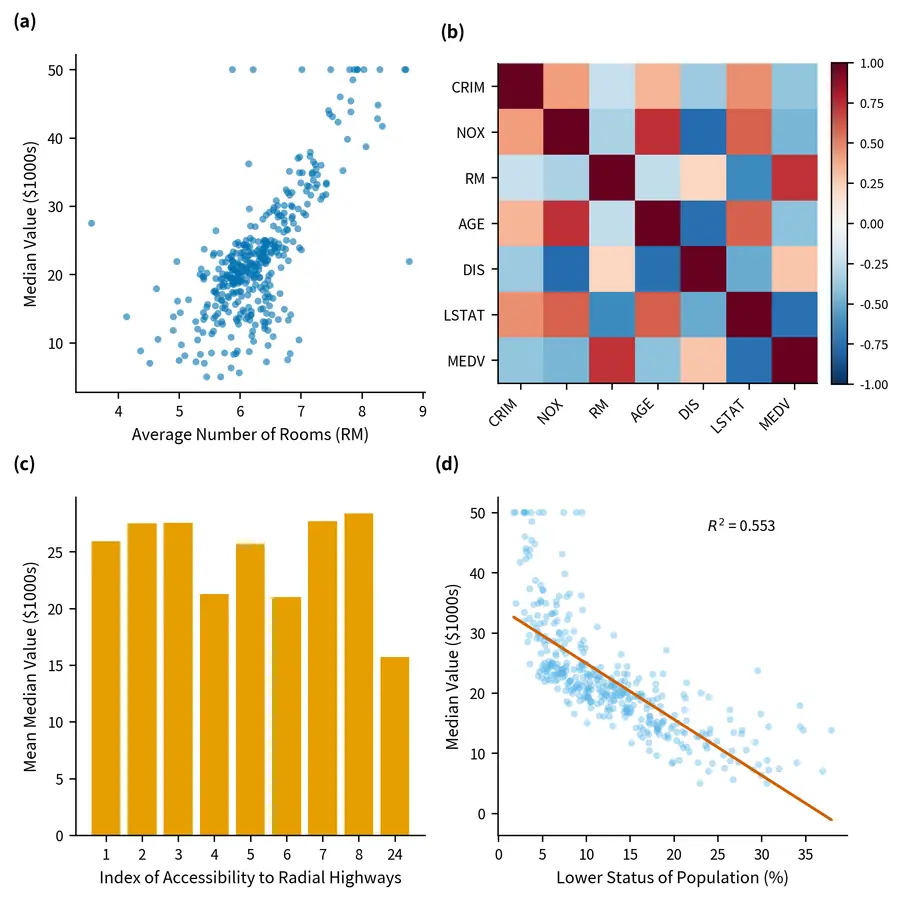
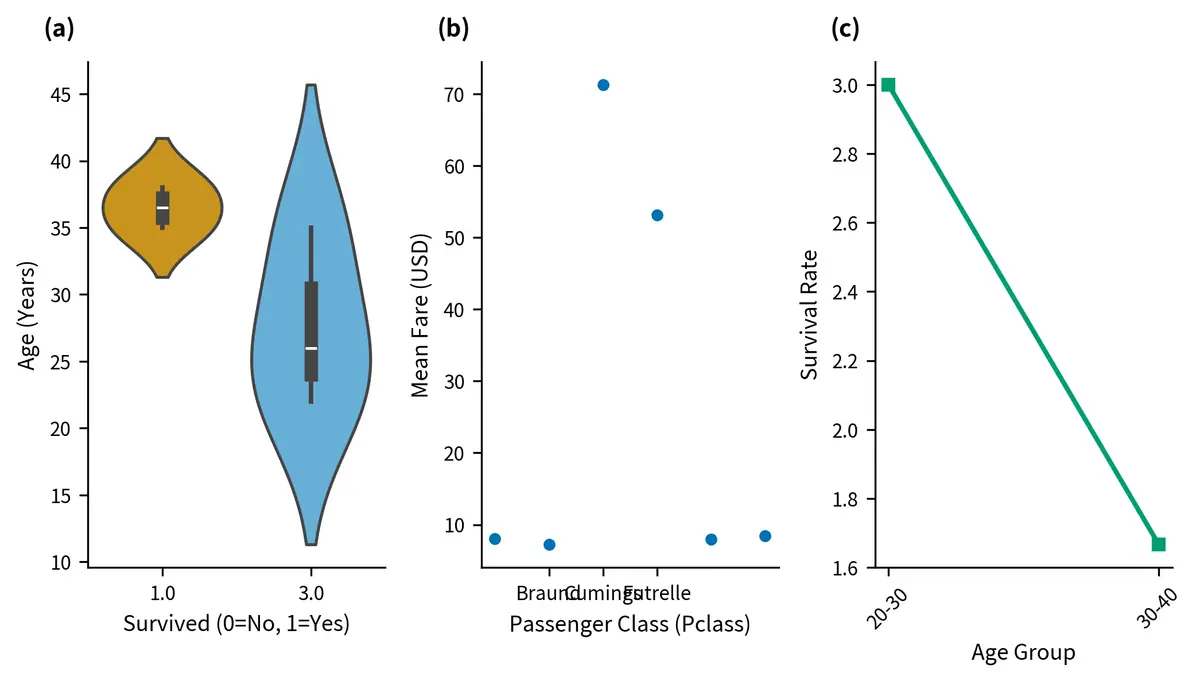
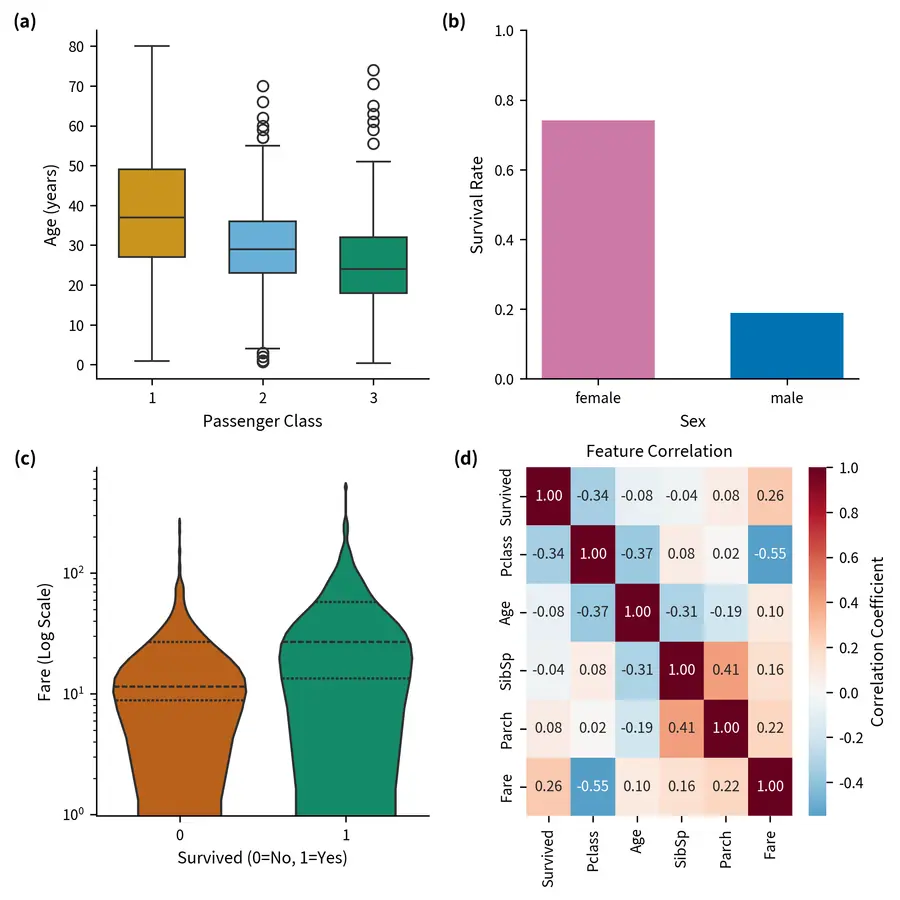
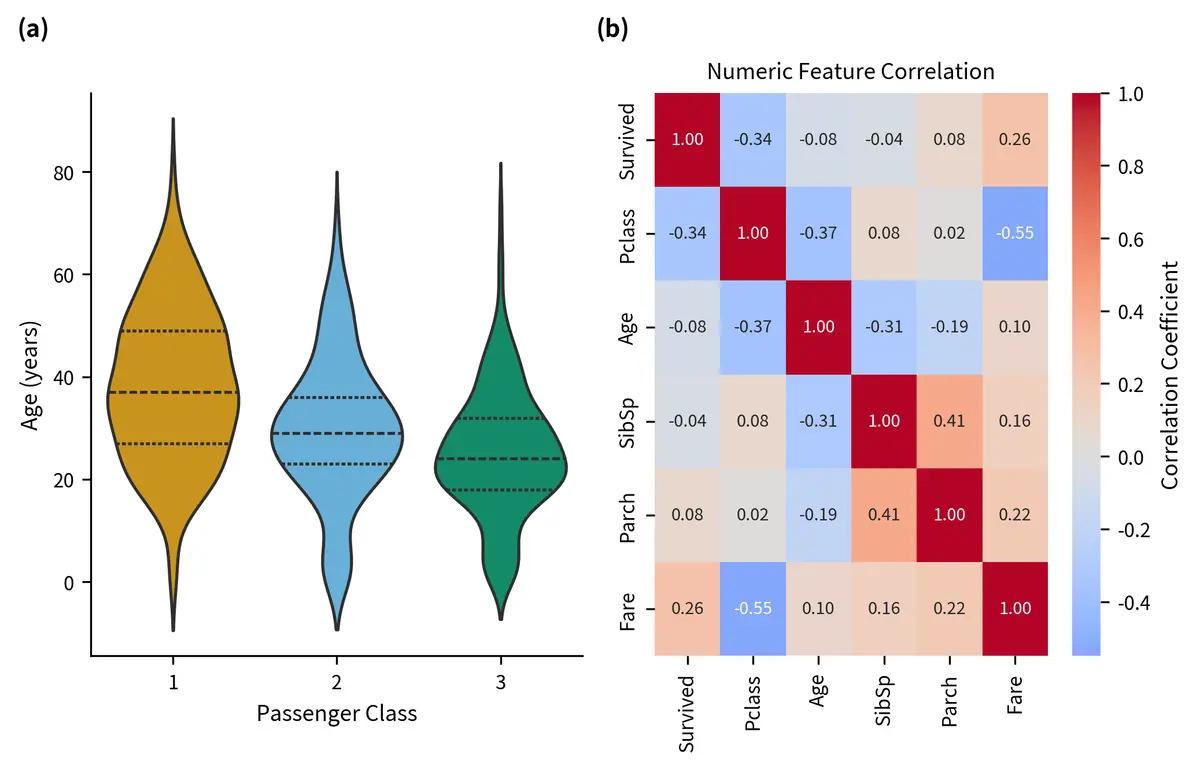
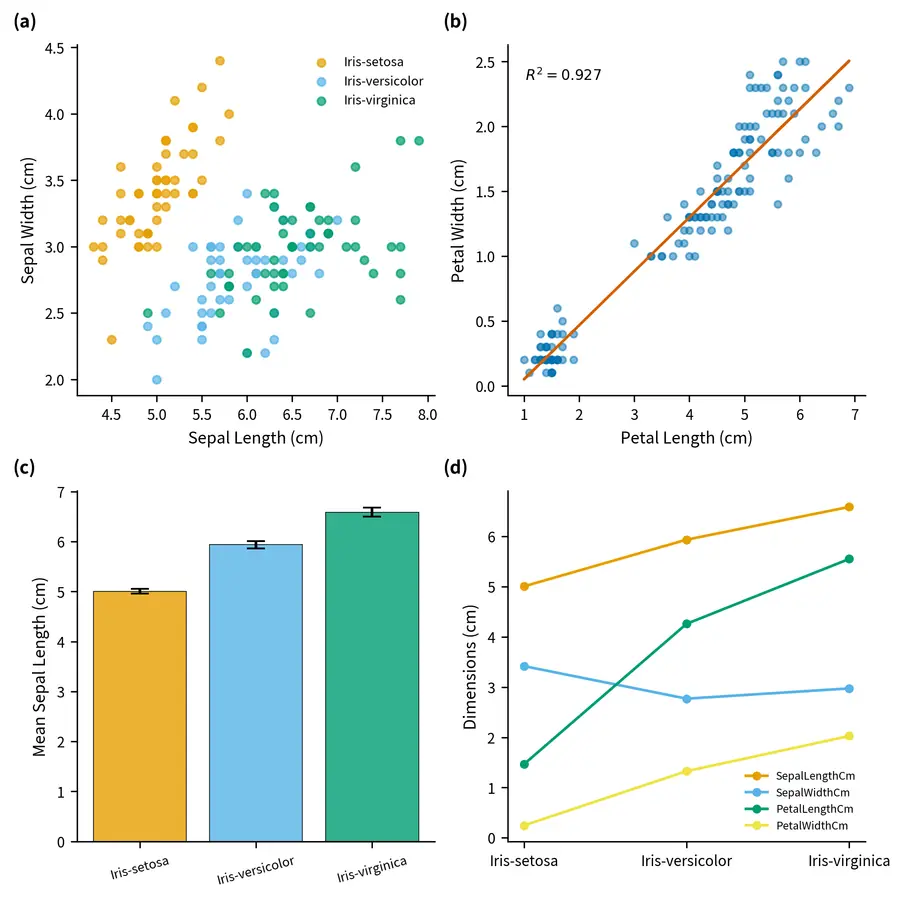
Publikationsfertige Datendiagramme
Verwandeln Sie Ihre CSV/Excel-Daten mit AI in publikationsreife Abbildungen. Generieren Sie automatisch Python matplotlib/seaborn-Code.
- 01
Daten hochladen
CSV oder Excel hochladen. Die KI wählt aus über 10 Diagrammtypen: Boxplot, Violinplot, Streudiagramm, Heatmap, Regression und mehr.
- 02
Journalstil wählen
Vorlagen für Nature, Science, Cell, PLOS oder ACS mit einem Klick, inklusive farbenblindfreundlicher Paletten wie Okabe-Ito.
- 03
Exportieren
Als PNG, PDF, EPS oder TIFF herunterladen – zusammen mit dem matplotlib/seaborn-Code, der das Diagramm reproduziert.
Mit SciDraw AI veröffentlicht
35.000+ Forschende an 1.500+ Einrichtungen in 179 Ländern und Regionen nutzen SciDraw AI
















Veröffentlichte Arbeiten
Begutachtete Fachartikel, die SciDraw AI ausdrücklich für die Erstellung oder Aufbereitung ihrer Abbildungen nennen.
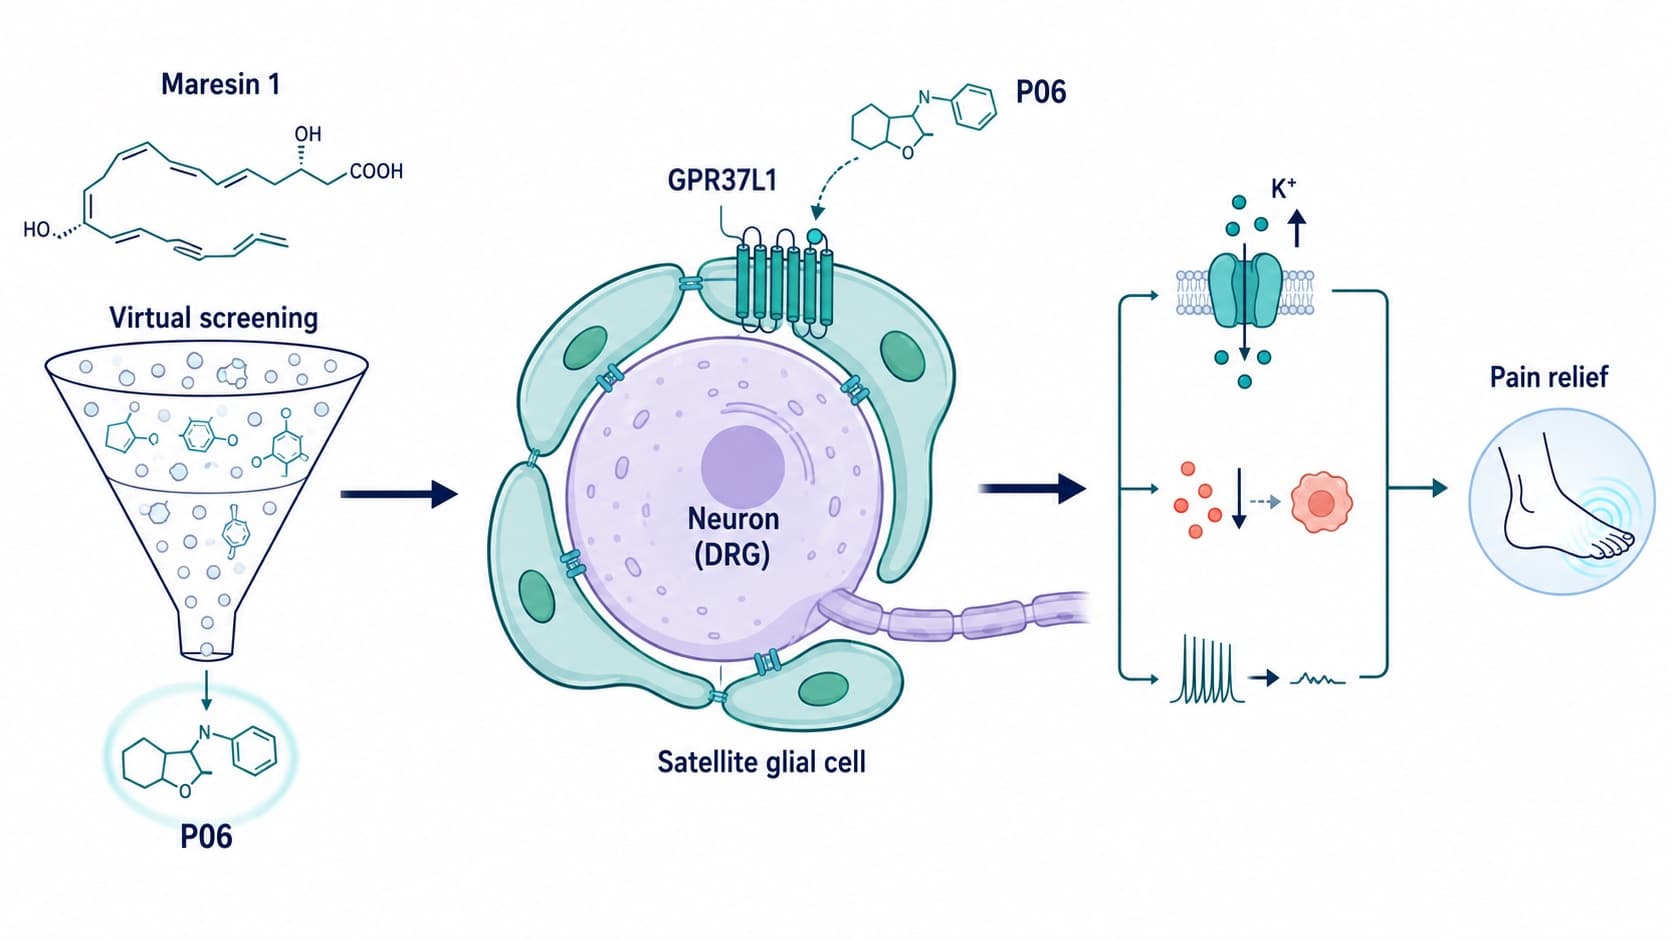 PAINIF 5.8Activating glial GPR37L1 to resolve neuropathic painBegutachtete Publikation · 2026
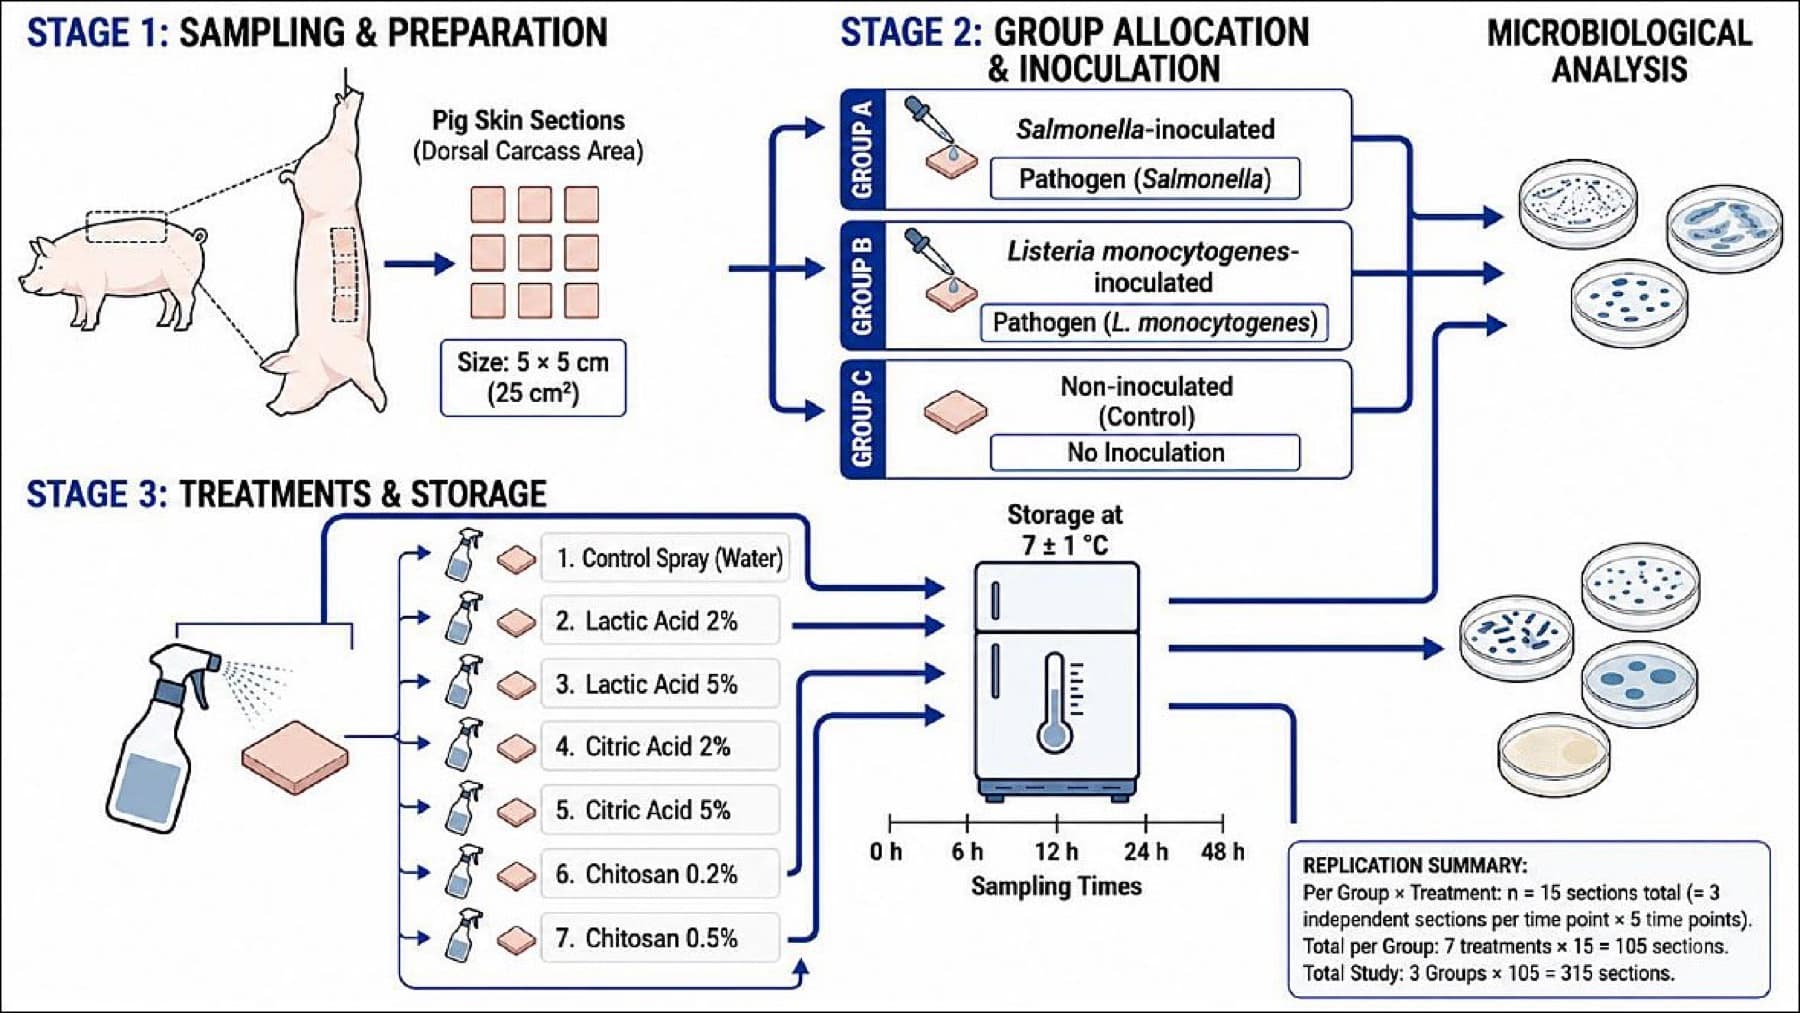 Veterinary WorldIF 2.3Chitosan as a sustainable decontamination strategy against Salmonella and Listeria monocytogenes on pig carcass surfaces: Comparative efficacy with organic acidsAus der Publikation · Figure 1 · 2026
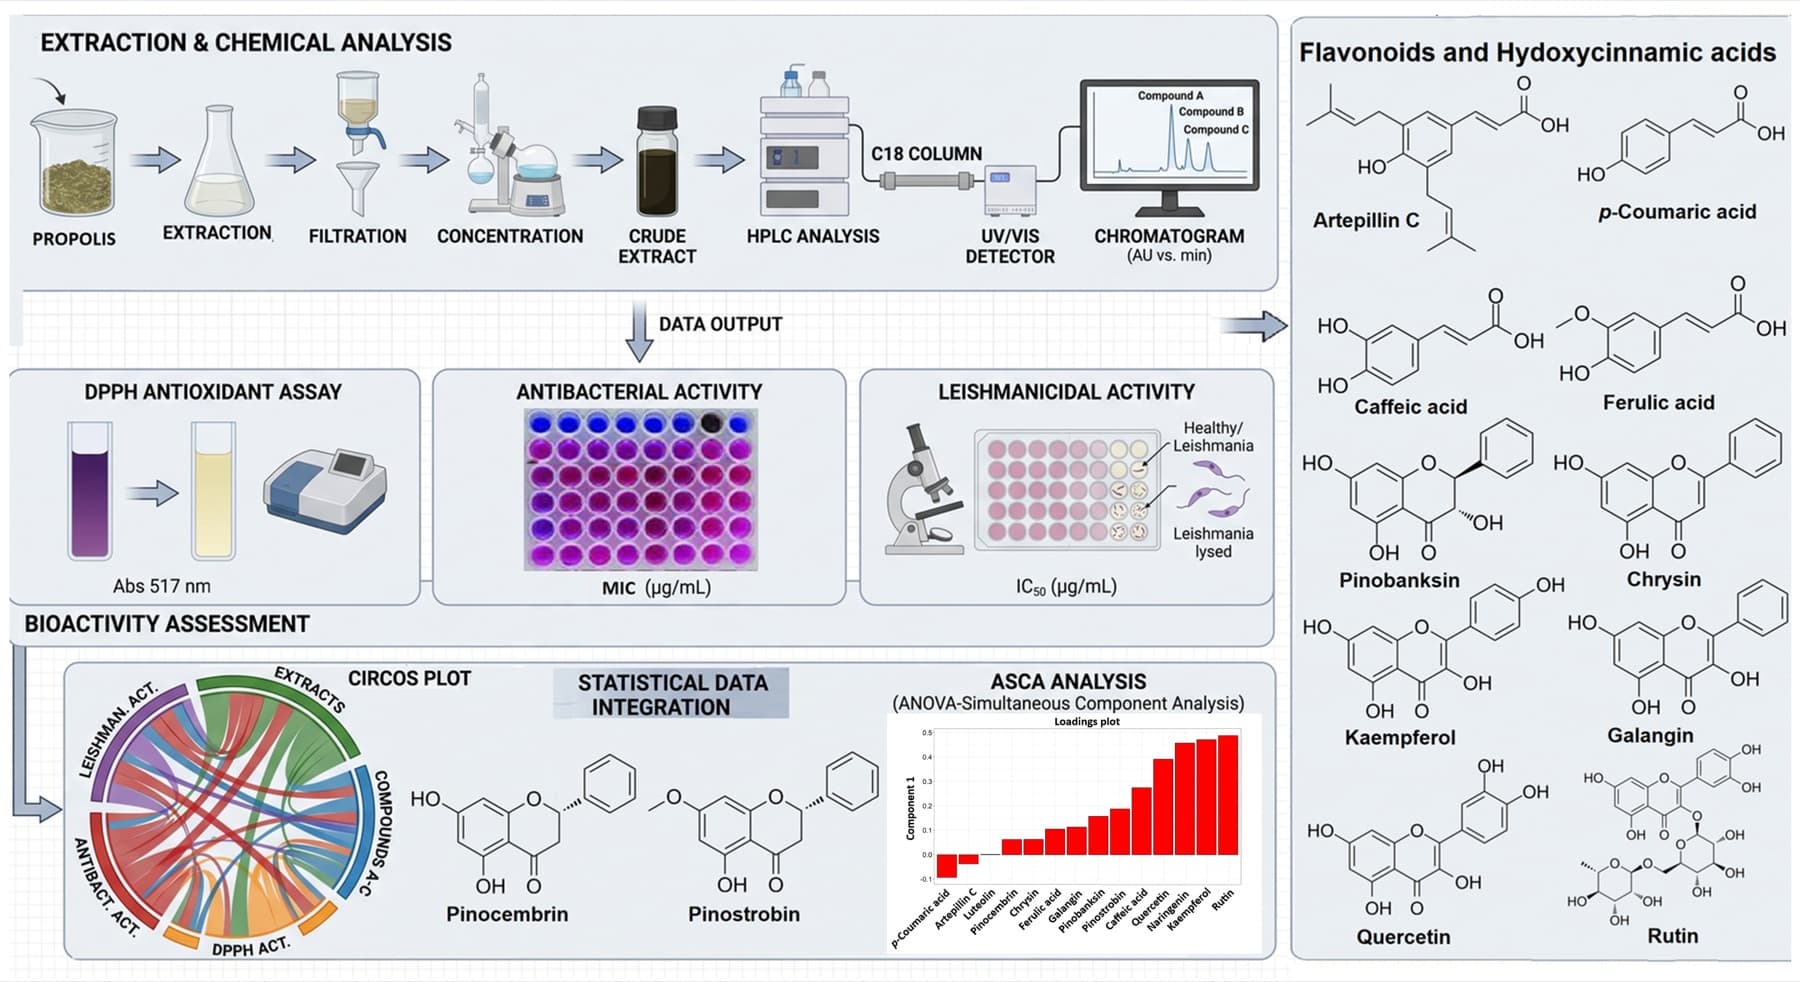 MoleculesIF 5.1Seasonal Variation of a New Brazilian Greenish-Brown Propolis Type: Chemical Composition and Antioxidant, Antimicrobial, and Antileishmanial ActivitiesAus der Publikation · Graphical abstract (partially created with SciDraw) · 2026
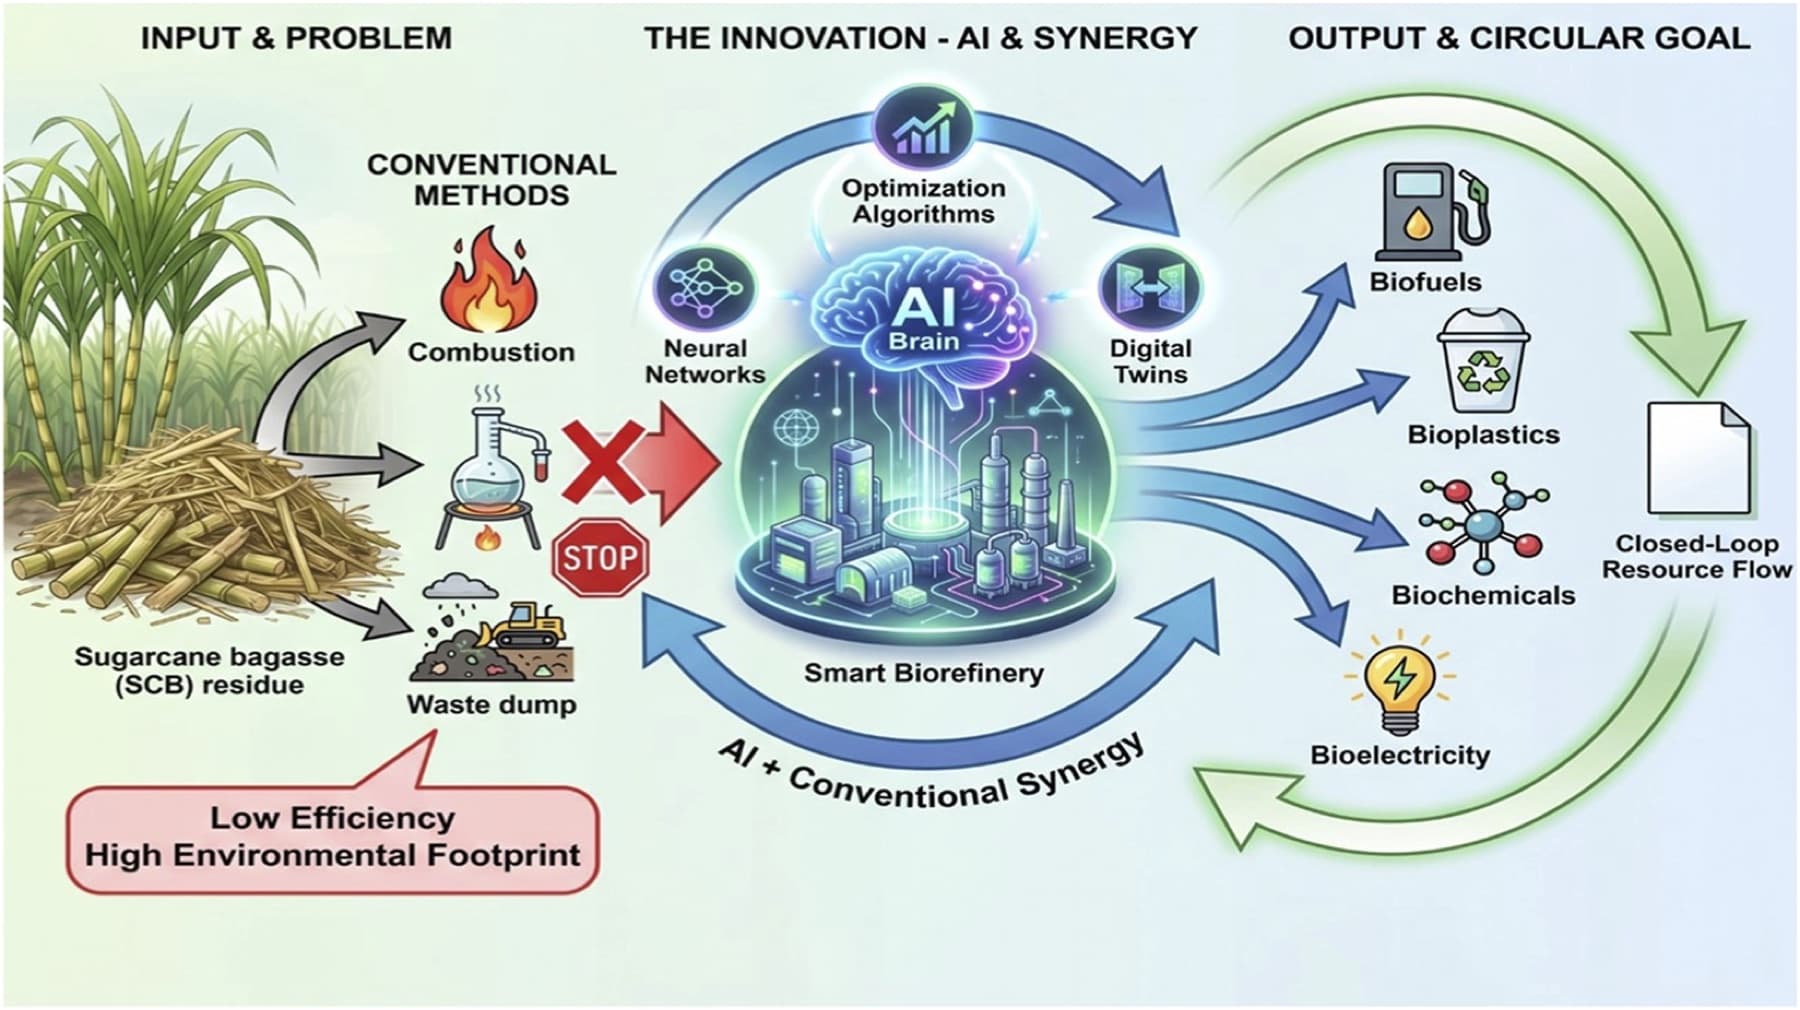 Frontiers in Bioengineering and BiotechnologyIF 5.8Integrating artificial intelligence and conventional approaches in sugarcane bagasse biorefineries: a review towards a circular bioeconomyAus der Publikation · Figure 1 · 2026
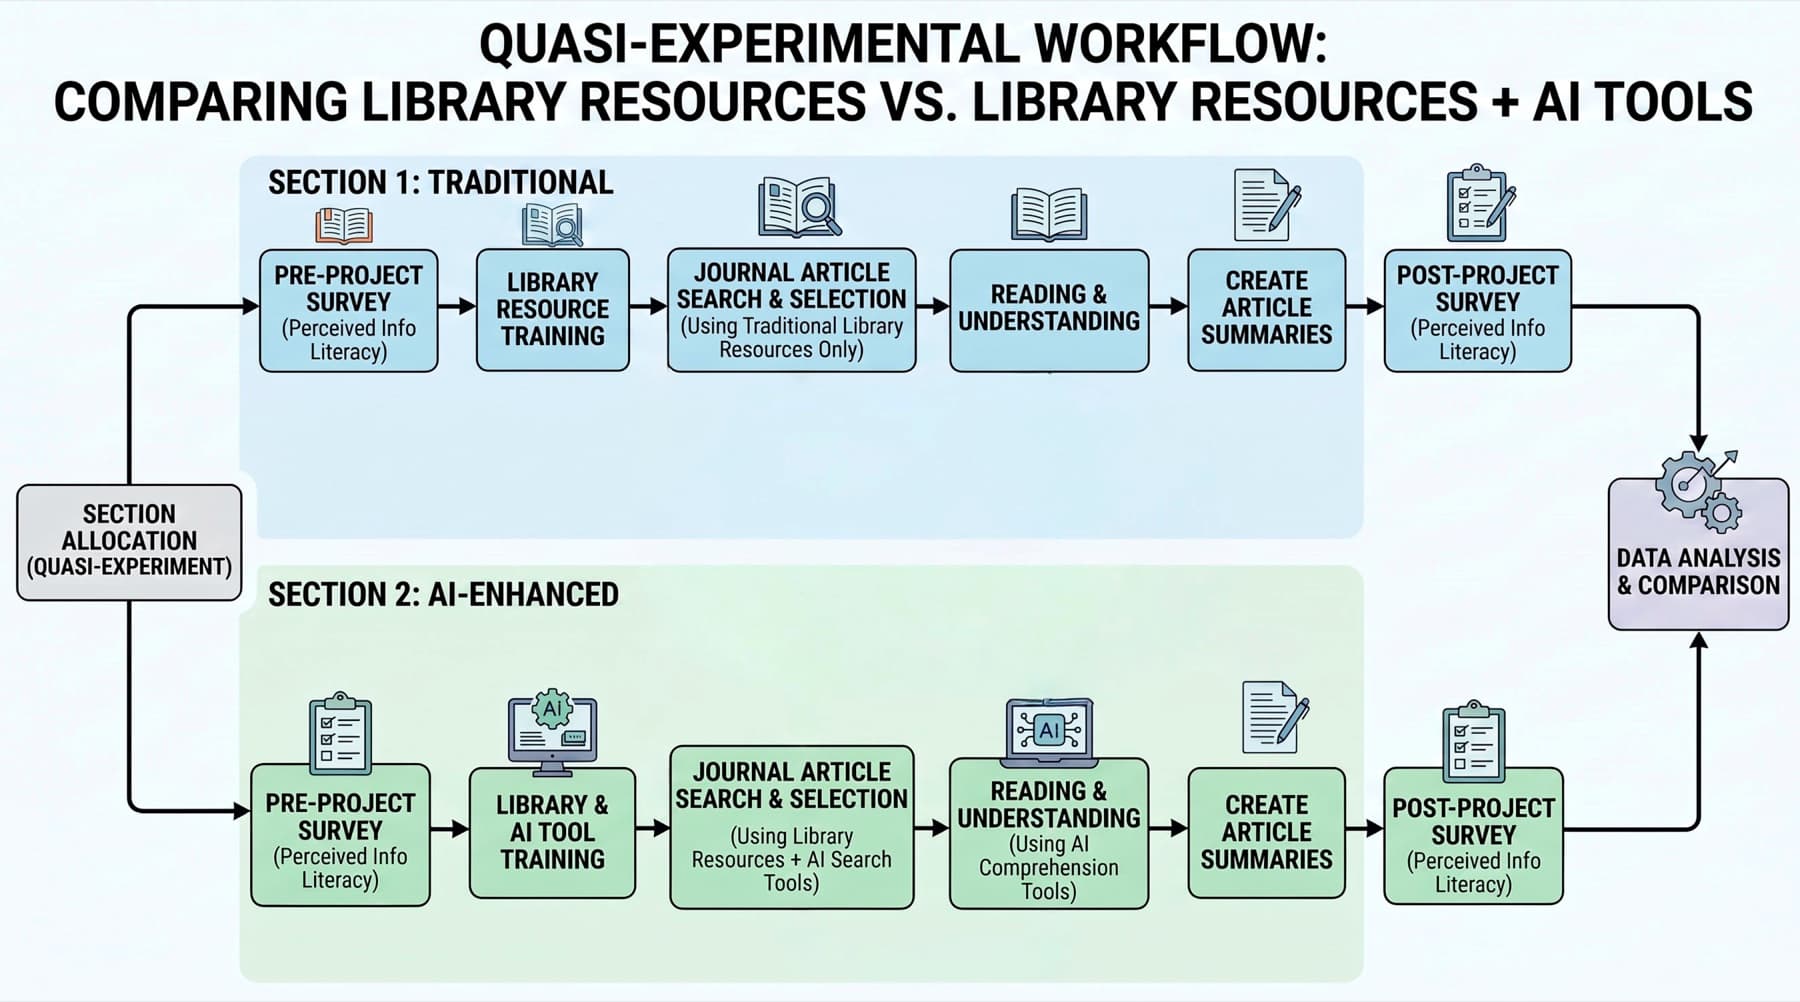 SustainabilityIF 4.1Information Literacy Through Open Pedagogy: What’s the Role of AI Tools?Aus der Publikation · Figure 1 · 2026
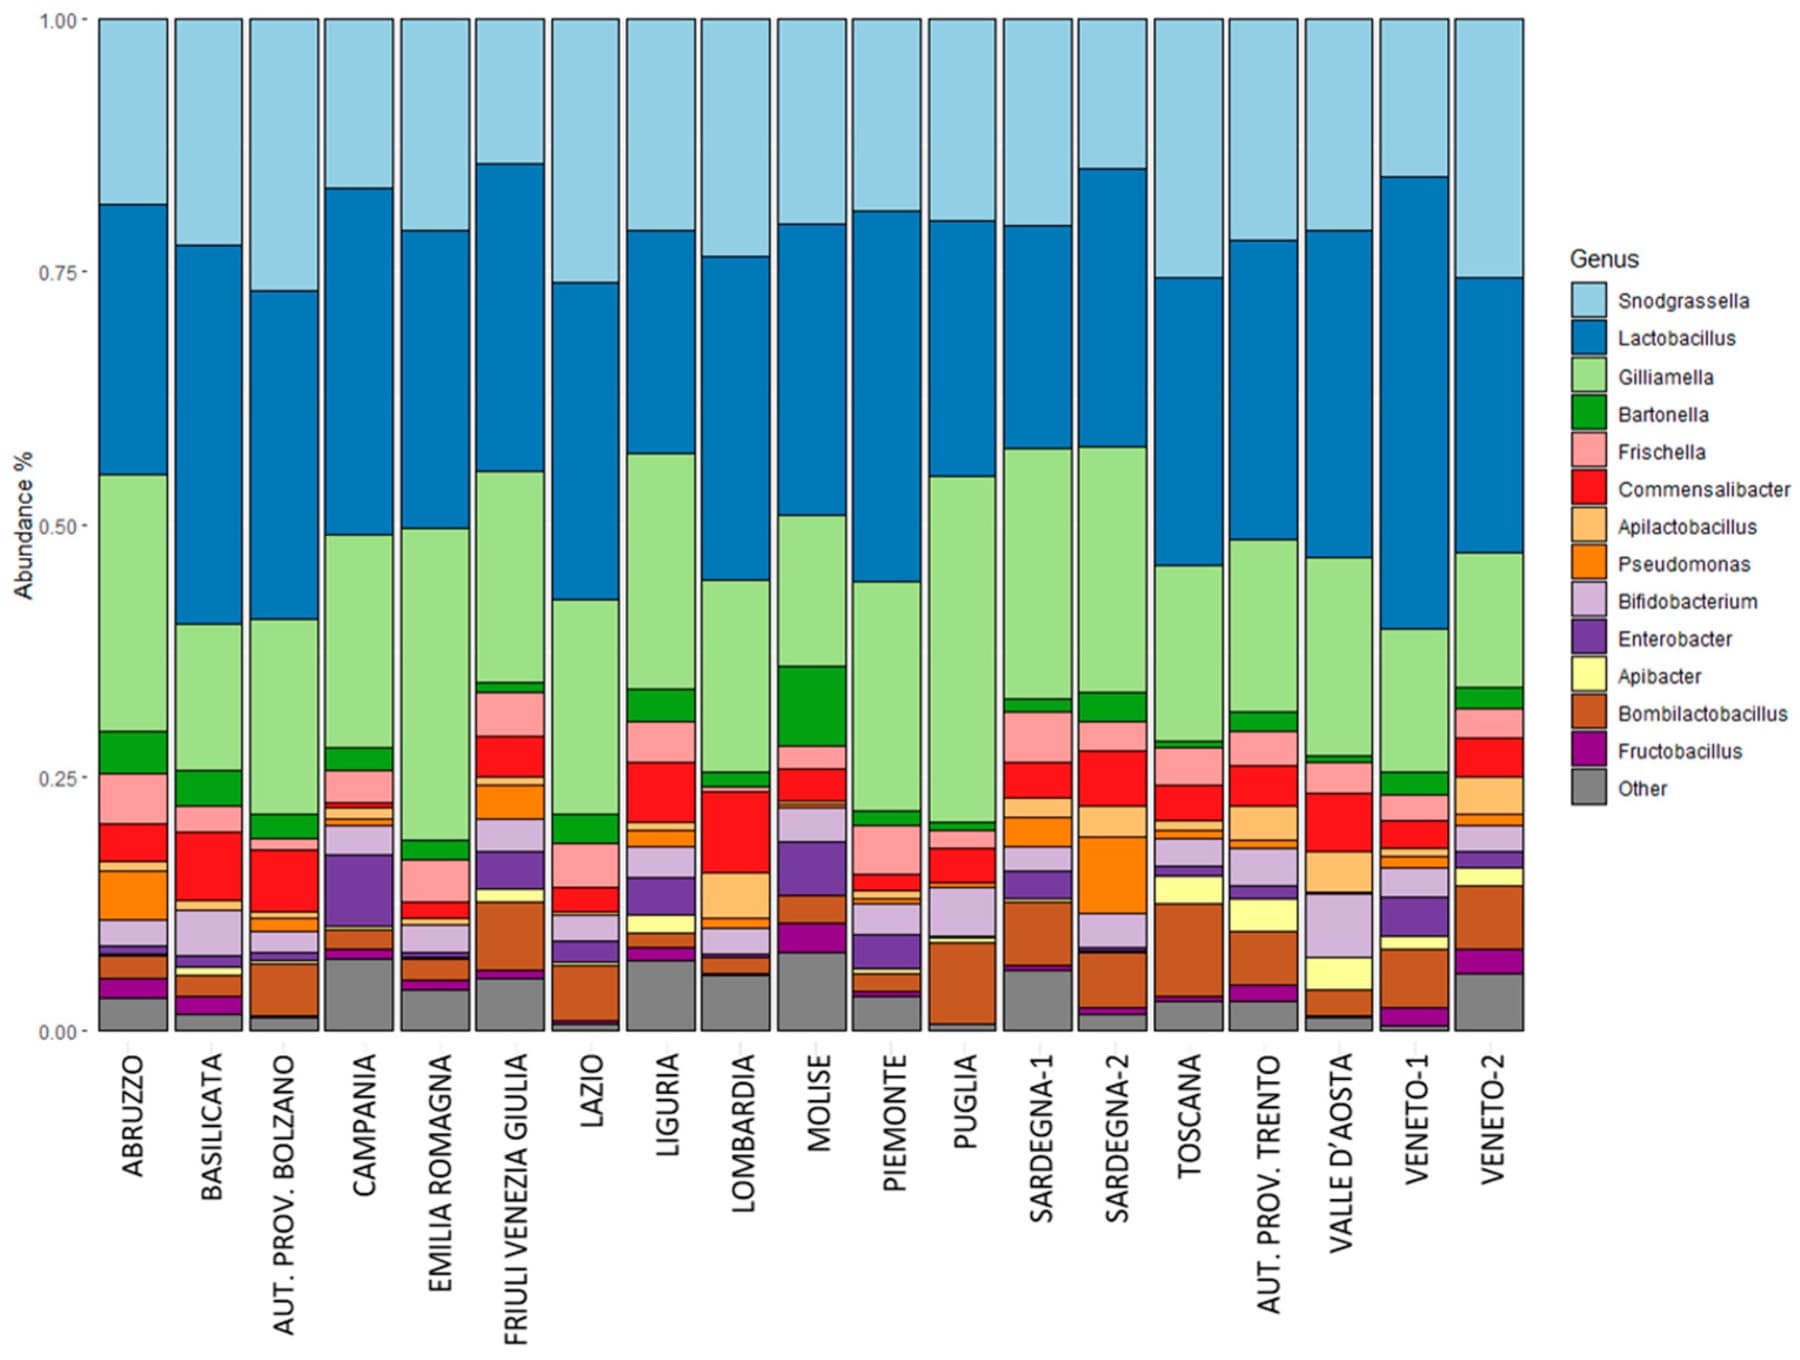 Applied SciencesIF 2.9First Molecular and Metagenomic Investigation of the Italian Honey Bee (Apis mellifera) MicrobiomeAus der Publikation · Figure 3 · 2026
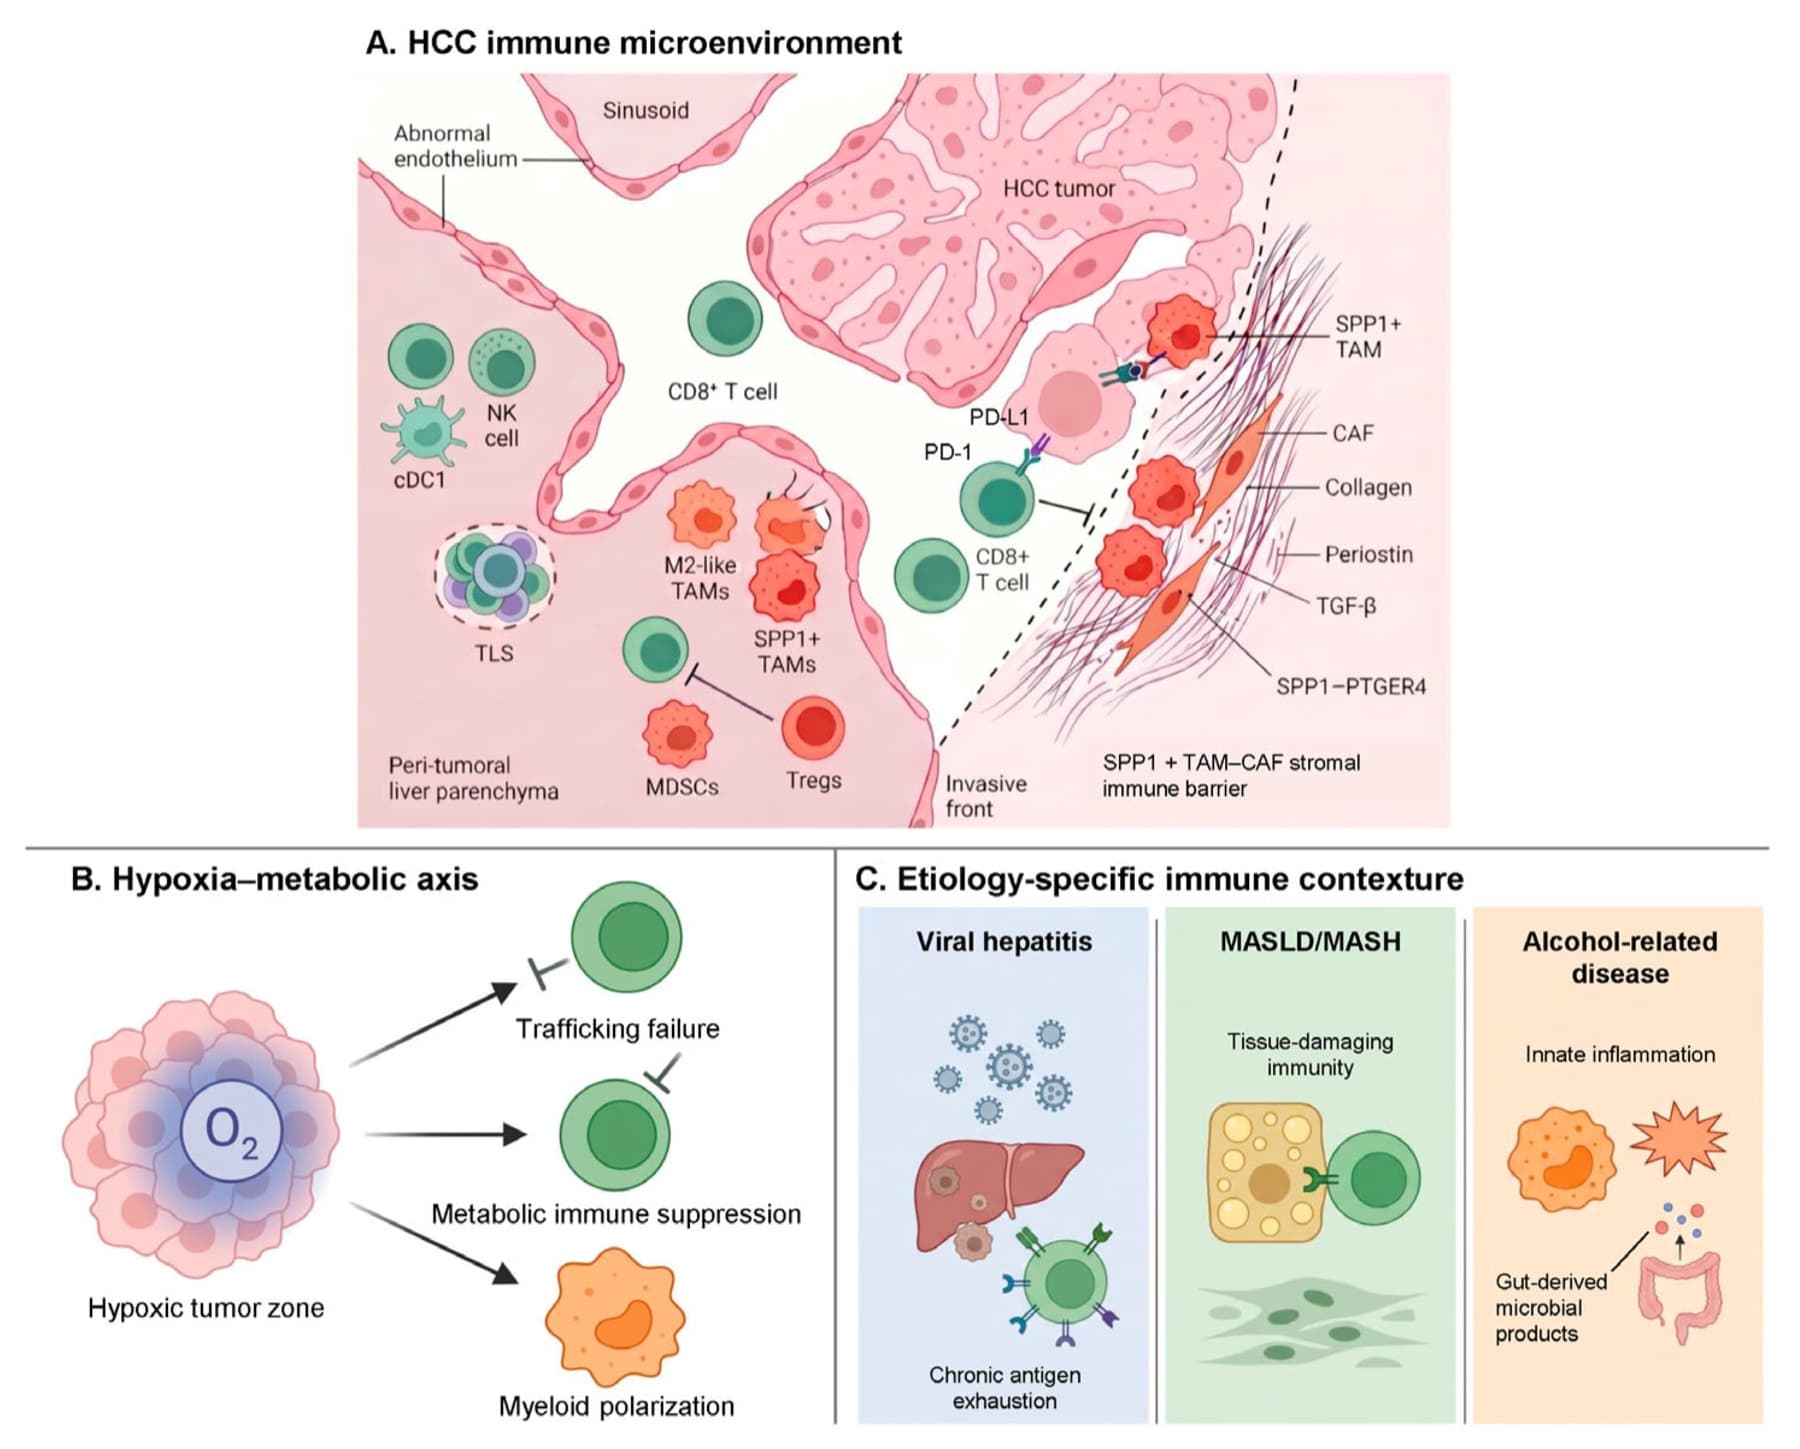 CellsIF 6.0Immunotherapy and Hepatocellular Carcinoma: From Tumor-Immune Cell Interactions to Rational Therapeutic StrategiesAus der Publikation · Figure 1 · 2026
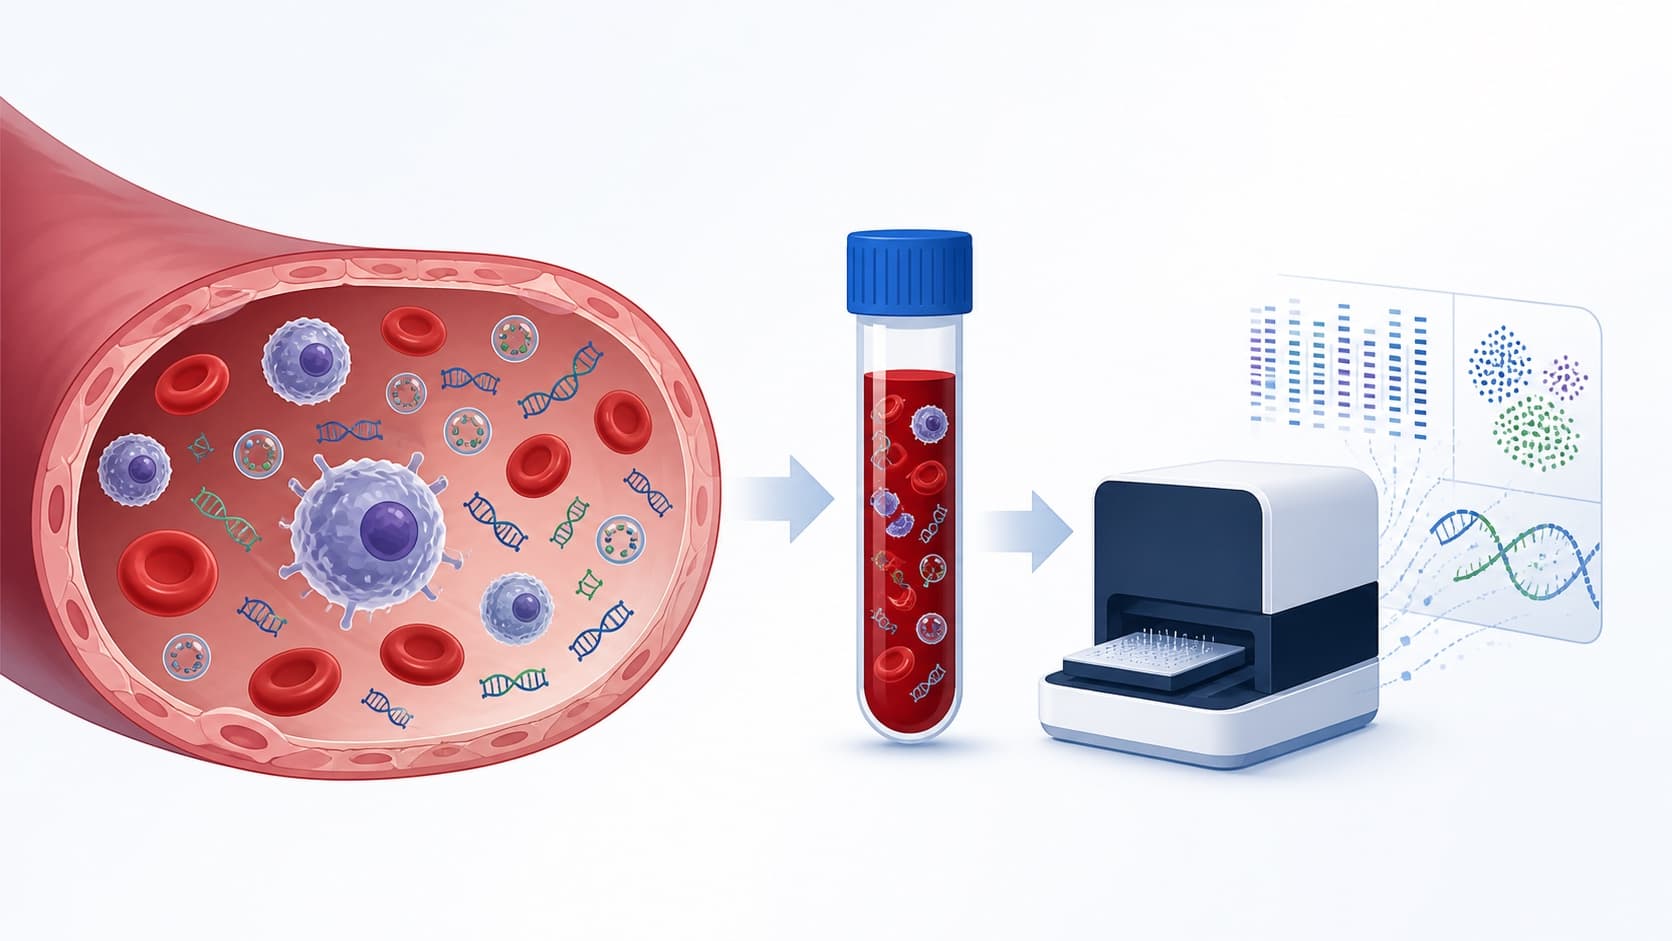 Oncology in Clinical PracticeIF 0.4Liquid biopsy in precision oncology: from biological basis to clinical translation across the cancer continuumBegutachtete Publikation · 2026PAINIF 5.8Activating glial GPR37L1 to resolve neuropathic painBegutachtete Publikation · 2026Veterinary WorldIF 2.3Chitosan as a sustainable decontamination strategy against Salmonella and Listeria monocytogenes on pig carcass surfaces: Comparative efficacy with organic acidsAus der Publikation · Figure 1 · 2026MoleculesIF 5.1Seasonal Variation of a New Brazilian Greenish-Brown Propolis Type: Chemical Composition and Antioxidant, Antimicrobial, and Antileishmanial ActivitiesAus der Publikation · Graphical abstract (partially created with SciDraw) · 2026Frontiers in Bioengineering and BiotechnologyIF 5.8Integrating artificial intelligence and conventional approaches in sugarcane bagasse biorefineries: a review towards a circular bioeconomyAus der Publikation · Figure 1 · 2026SustainabilityIF 4.1Information Literacy Through Open Pedagogy: What’s the Role of AI Tools?Aus der Publikation · Figure 1 · 2026Applied SciencesIF 2.9First Molecular and Metagenomic Investigation of the Italian Honey Bee (Apis mellifera) MicrobiomeAus der Publikation · Figure 3 · 2026CellsIF 6.0Immunotherapy and Hepatocellular Carcinoma: From Tumor-Immune Cell Interactions to Rational Therapeutic StrategiesAus der Publikation · Figure 1 · 2026Oncology in Clinical PracticeIF 0.4Liquid biopsy in precision oncology: from biological basis to clinical translation across the cancer continuumBegutachtete Publikation · 2026
Veröffentlichte Arbeiten ansehen, die SciDraw AI genutzt haben
Was unsere Nutzer sagen
Echtes Feedback von Forschenden, Studierenden und Lehrenden
SciDraw AI helps me turn research ideas into scientific illustrations with AI.
SciDraw's approach of generating editable SVGs is genuinely useful because it lets you fine-tune the output in Illustrator or PowerPoint.
Creating a graphical abstract or science figure? SciDraw AI makes it fast with AI.
Recently I started using SciDraw AI, and honestly? It's been a total game-changer for my workflow.
What is SciDraw AI? 4 Key Features That Make It Stand Out: Sketch & Text-to-Image Generation; Editable PPTX and SVG Exports; One-Click Top-Tier Journal Standards; Academic-Grade Data Visualization.
SciDraw AI helps researchers, students, and educators turn a sketch or text description into a publication-grade figure in minutes.
SciDraw AI helps me turn research ideas into scientific illustrations with AI.
SciDraw's approach of generating editable SVGs is genuinely useful because it lets you fine-tune the output in Illustrator or PowerPoint.
Creating a graphical abstract or science figure? SciDraw AI makes it fast with AI.
Recently I started using SciDraw AI, and honestly? It's been a total game-changer for my workflow.
What is SciDraw AI? 4 Key Features That Make It Stand Out: Sketch & Text-to-Image Generation; Editable PPTX and SVG Exports; One-Click Top-Tier Journal Standards; Academic-Grade Data Visualization.
SciDraw AI helps researchers, students, and educators turn a sketch or text description into a publication-grade figure in minutes.
A tool called SciDraw AI uses artificial intelligence to dramatically speed up the process. The platform can generate journal-quality figures based on a simple text prompt.
I'm using SciDraw AI to create publication-ready scientific figures in minutes. Just describe what you need or upload a rough sketch—the AI handles the rest.
还在为一张论文配图熬夜画 Illustrator?试试 SciDraw AI:手画一张草图,或者一句话描述,几分钟出 publication 级科研图。
它支持中文和英文描述,覆盖生物医学、化学、材料、物理等多个学科,能够显著缩短科研绘图时间。
Traditional illustration tools often consume valuable time that could be better spent on data analysis and writing.
No more juggling between BioRender, Illustrator, Excel, and Python—everything under one roof.
A tool called SciDraw AI uses artificial intelligence to dramatically speed up the process. The platform can generate journal-quality figures based on a simple text prompt.
I'm using SciDraw AI to create publication-ready scientific figures in minutes. Just describe what you need or upload a rough sketch—the AI handles the rest.
还在为一张论文配图熬夜画 Illustrator?试试 SciDraw AI:手画一张草图,或者一句话描述,几分钟出 publication 级科研图。
它支持中文和英文描述,覆盖生物医学、化学、材料、物理等多个学科,能够显著缩短科研绘图时间。
Traditional illustration tools often consume valuable time that could be better spent on data analysis and writing.
No more juggling between BioRender, Illustrator, Excel, and Python—everything under one roof.
Preise
Wählen Sie Tarife und Zugriffsebenen, die Ihren Anforderungen entsprechen
Credit-basiertes System für flexibles, verbrauchsabhängiges Bezahlen ohne Verschwendung. Neue Nutzer erhalten bei der Registrierung 10 Credits sowie täglich 5 kostenlose Credits.
Kostenlos
- 10 kostenlose Credits bei der Registrierung
- Publikationslizenz-Zertifikat
- 5 kostenlose Credits jeden Tag
- 7+ professionelle Vorlagen
- 6+ visuelle Stile
- 30 Tage Aufbewahrung des Verlaufs
- SVG-Vektorumwandlung
- Journal-Publikation / Kommerzielle Nutzung
Standard
- 300 Credits/Monat (~60 Bilder)
- Publikationslizenz-Zertifikat
- Alle AI-Generierungsmodi
- 7+ professionelle Vorlagen
- 6+ visuelle Stile
- SVG-Vektorkonvertierung
- Dauerhafte Speicherung des Verlaufs
- Journal-Veröffentlichung / Kommerzielle Nutzung
- Prioritärer technischer Support
- 3x schnellere Bildgenerierung
Premium
- 800 Credits/Monat (~160 Bilder)
- Publikationslizenz-Zertifikat
- Alle AI-Generierungsmodi
- 7+ professionelle Vorlagen
- 6+ visuelle Stile
- SVG-Vektorkonvertierung
- Dauerhafte Speicherung des Verlaufs
- Journal-Veröffentlichung / Kommerzielle Nutzung
- Prioritärer technischer Support
- 3x schnellere Bildgenerierung
Enterprise
- 2,000 Credits/Monat (~400 Bilder)
- Publikationslizenz-Zertifikat
- Alle AI-Generierungsmodi
- 7+ professionelle Vorlagen
- 6+ visuelle Stile
- SVG-Vektorkonvertierung
- Dauerhafte Speicherung des Verlaufs
- Journal-Veröffentlichung / Kommerzielle Nutzung
- Dedizierter Account Manager
- 5x schnellere Bildgenerierung
Brauchen Sie Hilfe?
Häufig gestellte Fragen zu unserer AI-Plattform für wissenschaftliche Illustrationen
Ein Werkzeug für jede wissenschaftliche Abbildung
Eine Engine — von publikationsreifen Forschungsabbildungen bis zu unterrichtsfertigen Lehrdiagrammen. Beschreibe, was du brauchst; SciDraw AI zeichnet es.
Für die Forschung
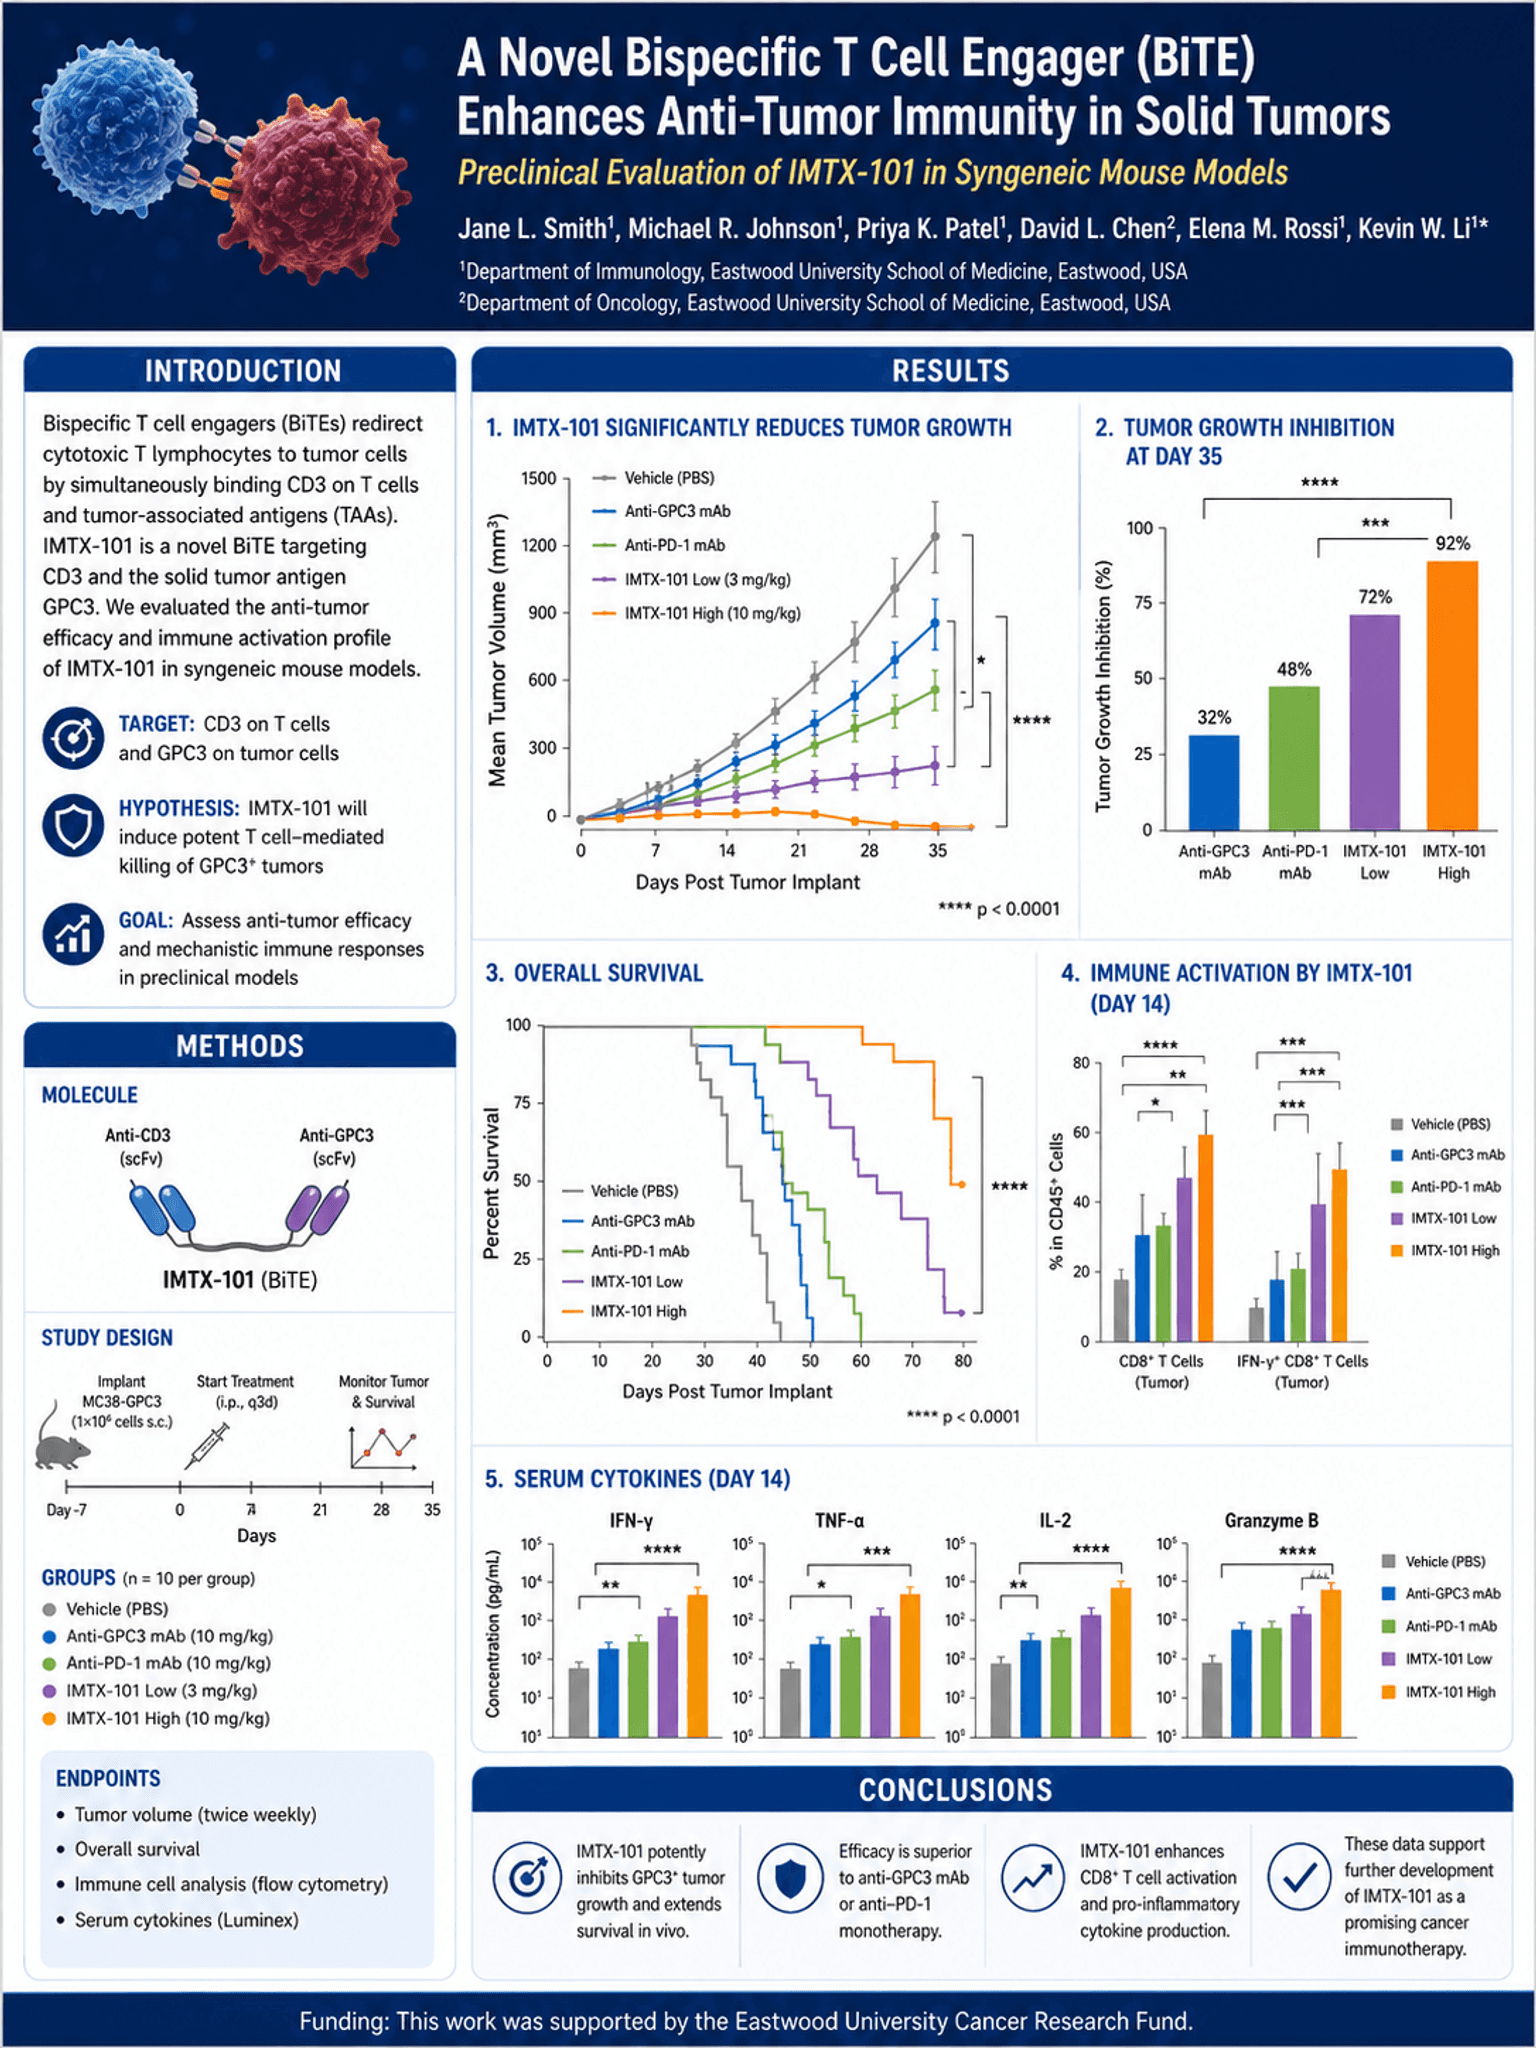
Publikationsreife Abbildungen, Abstracts & Datenvisualisierung
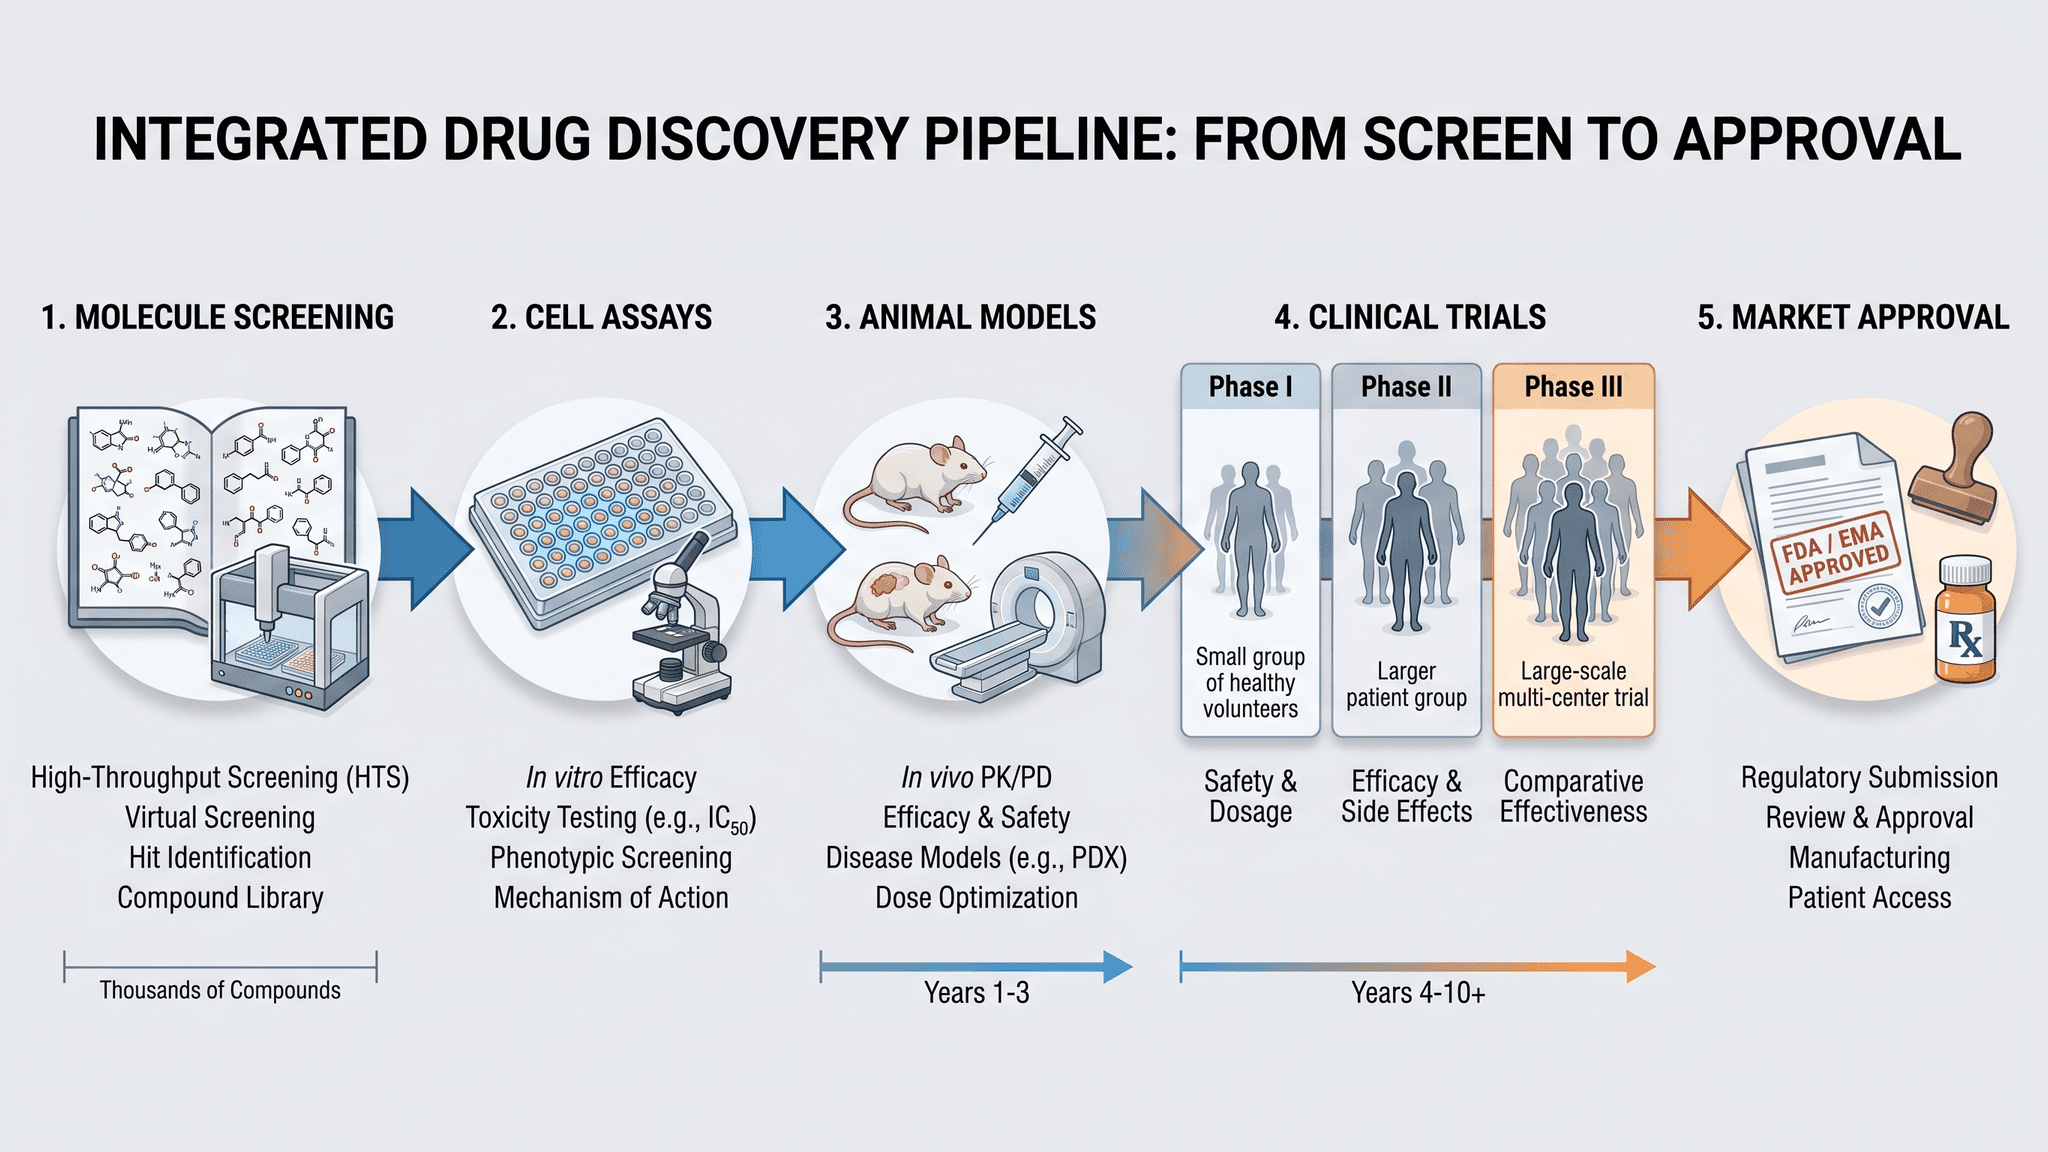
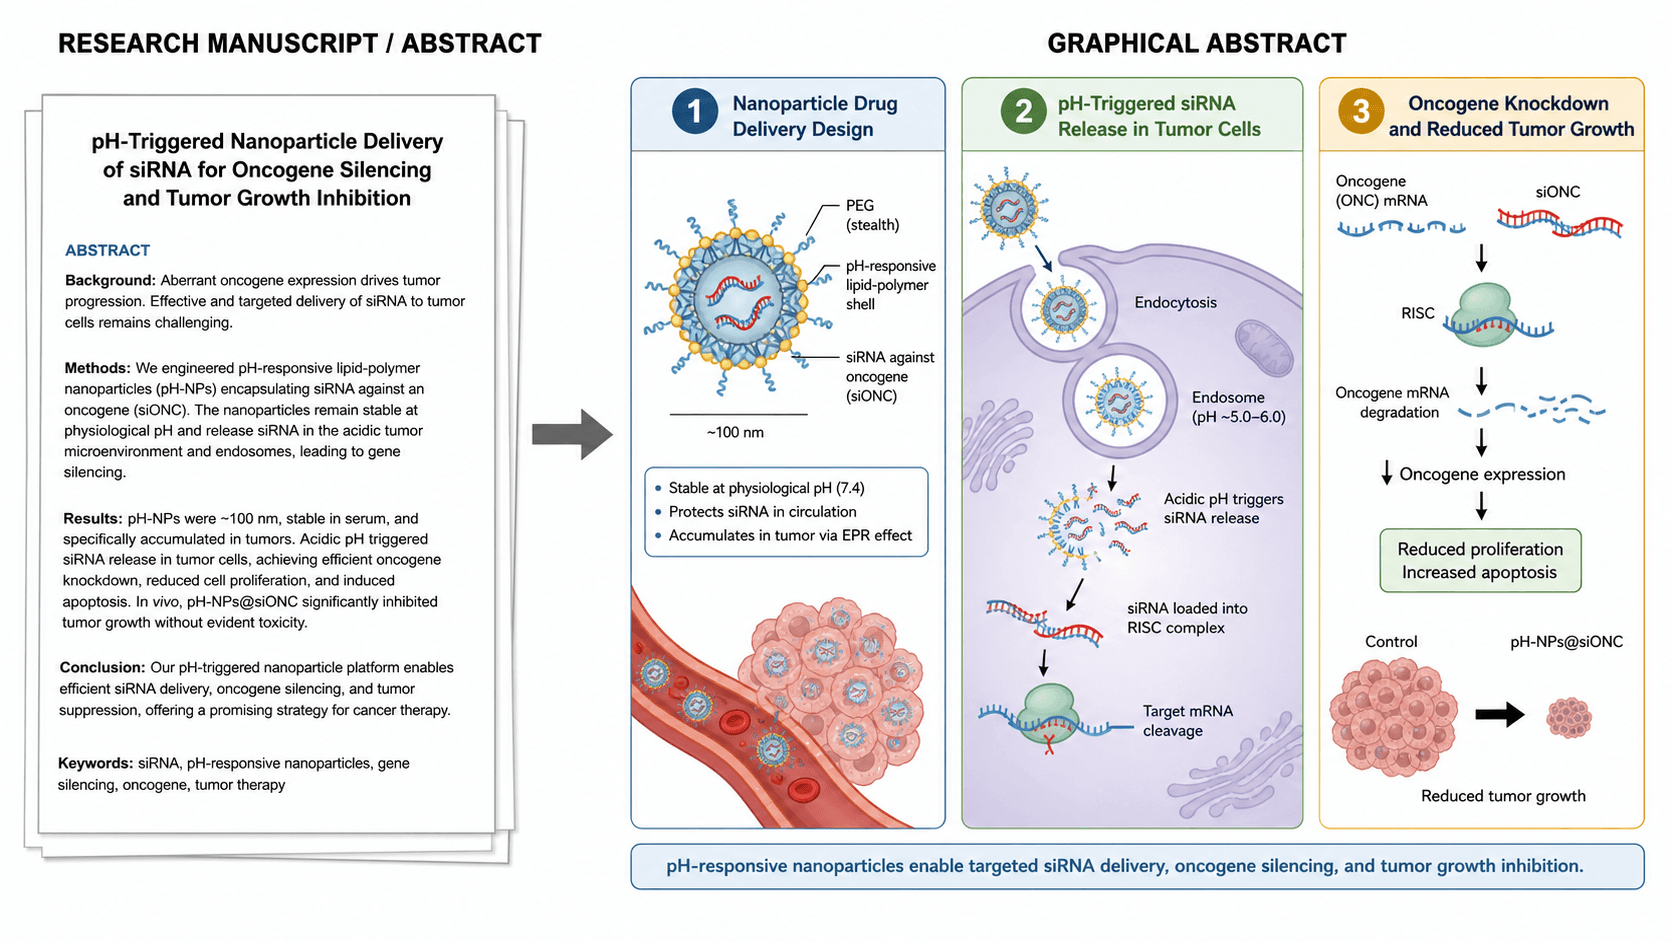
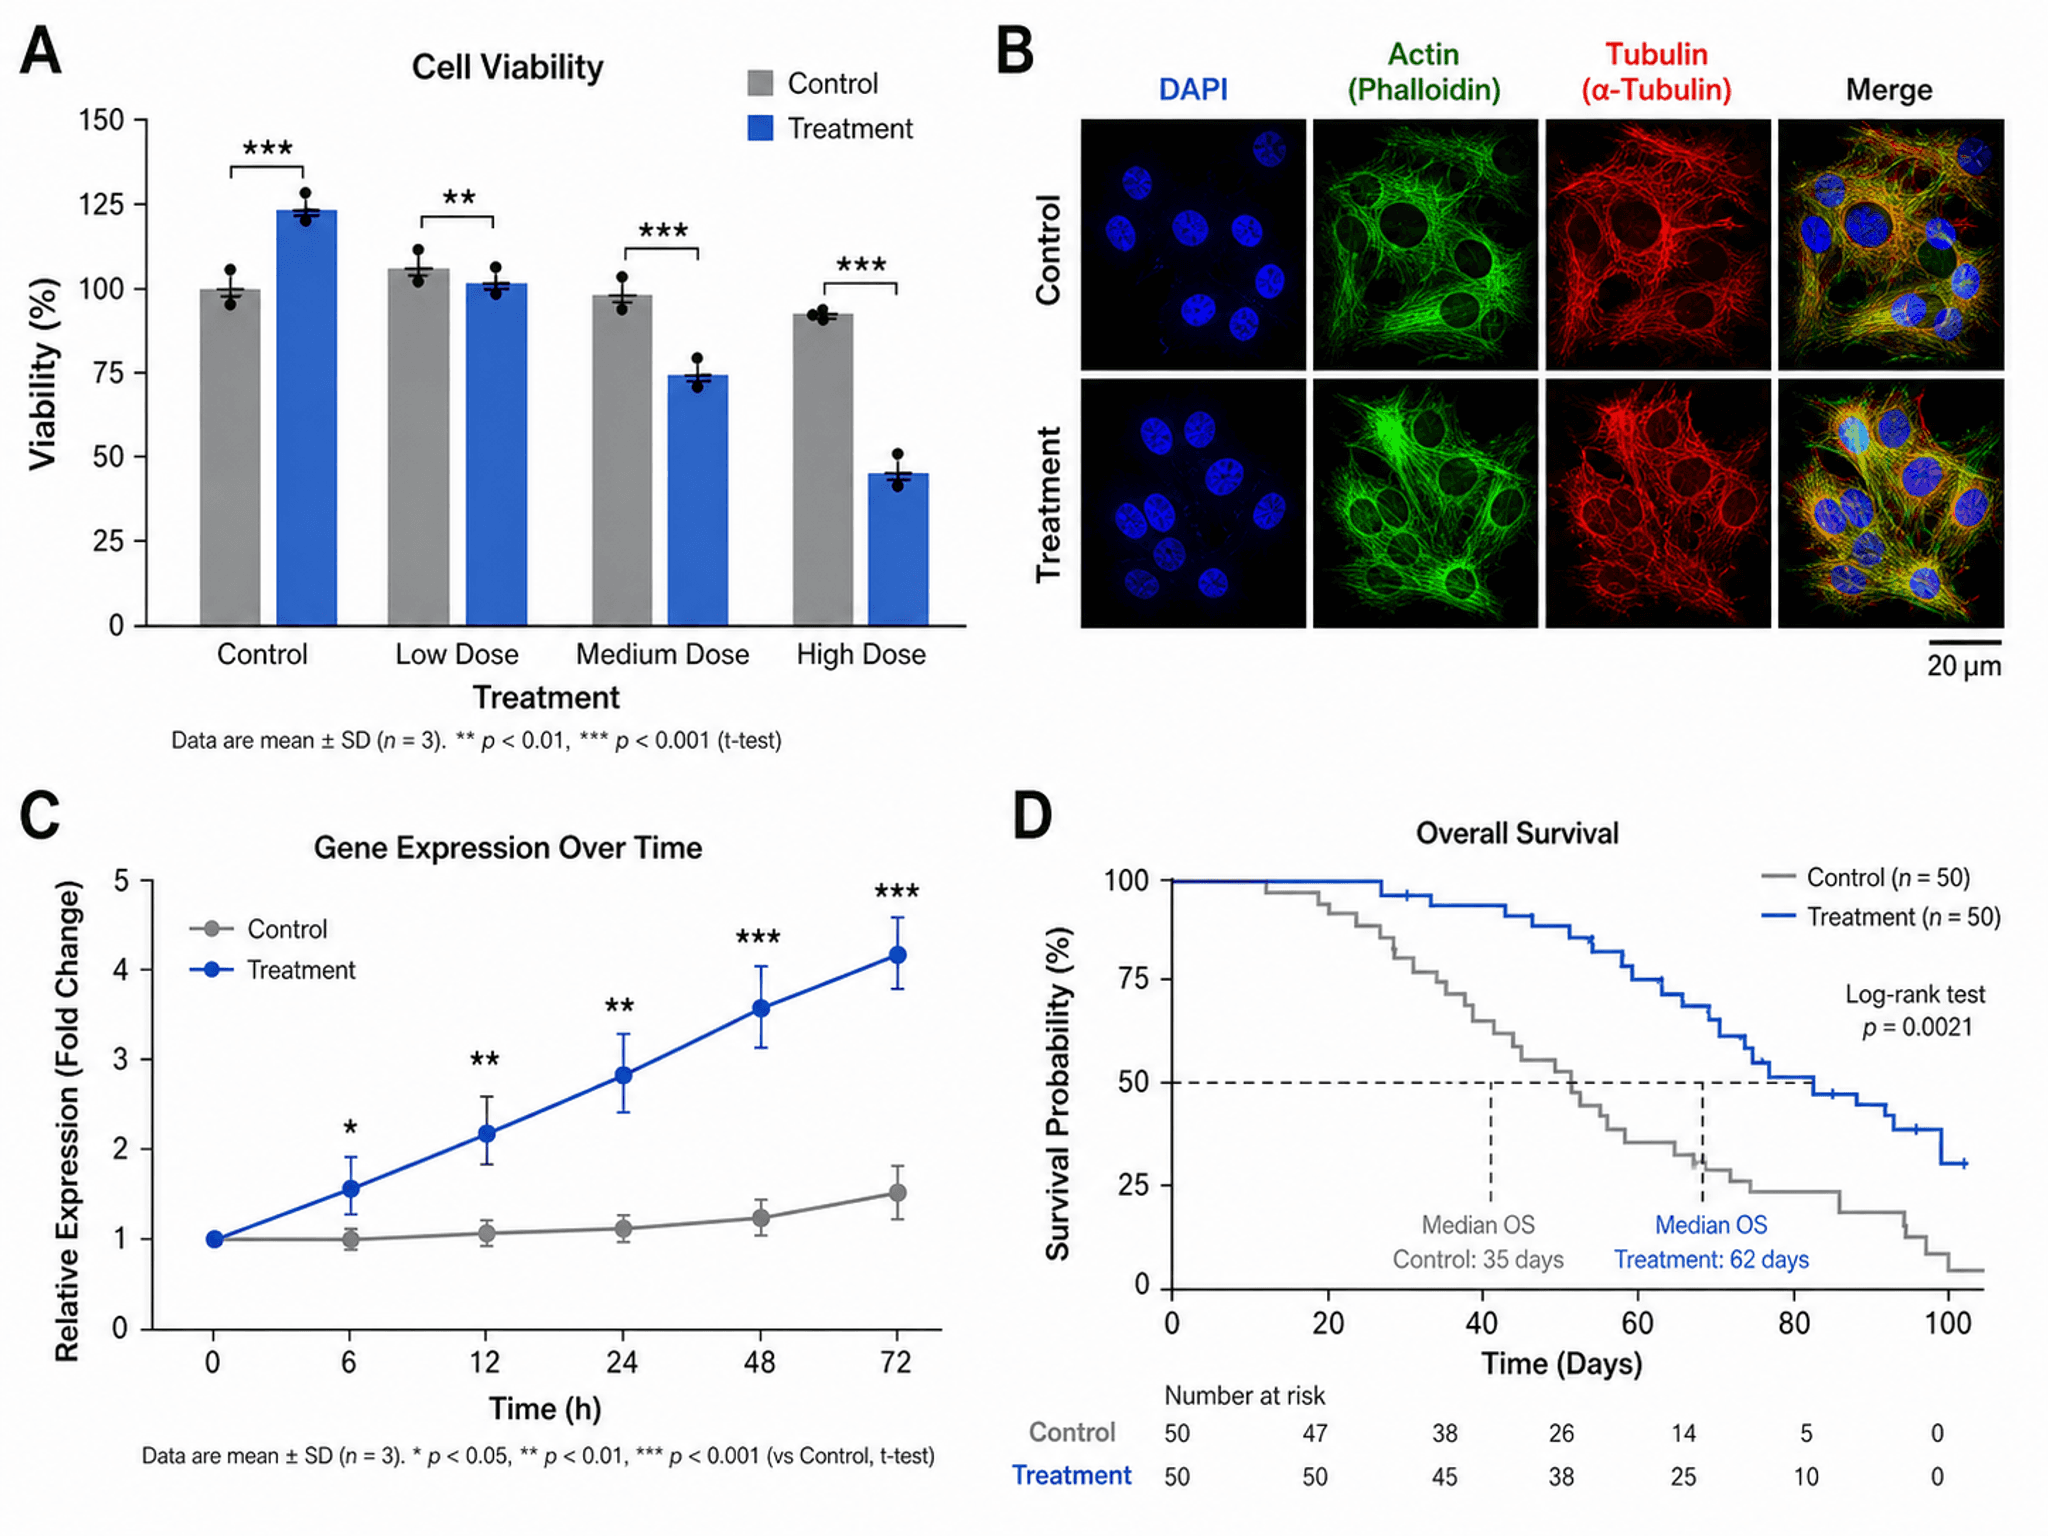
Für die Lehre
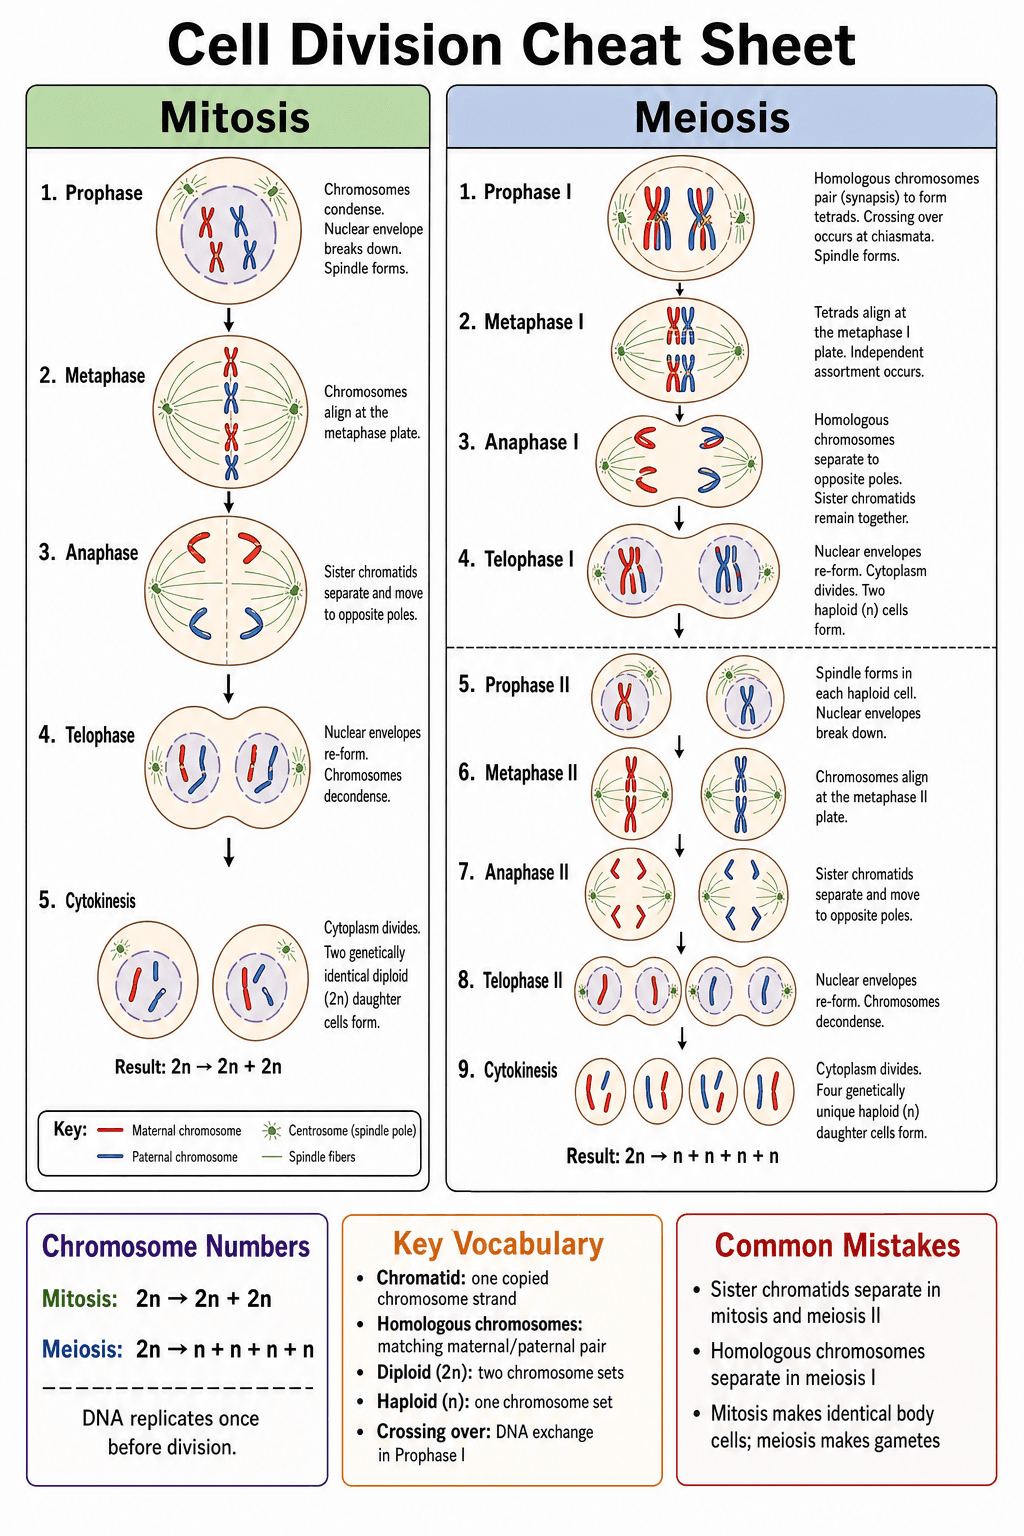
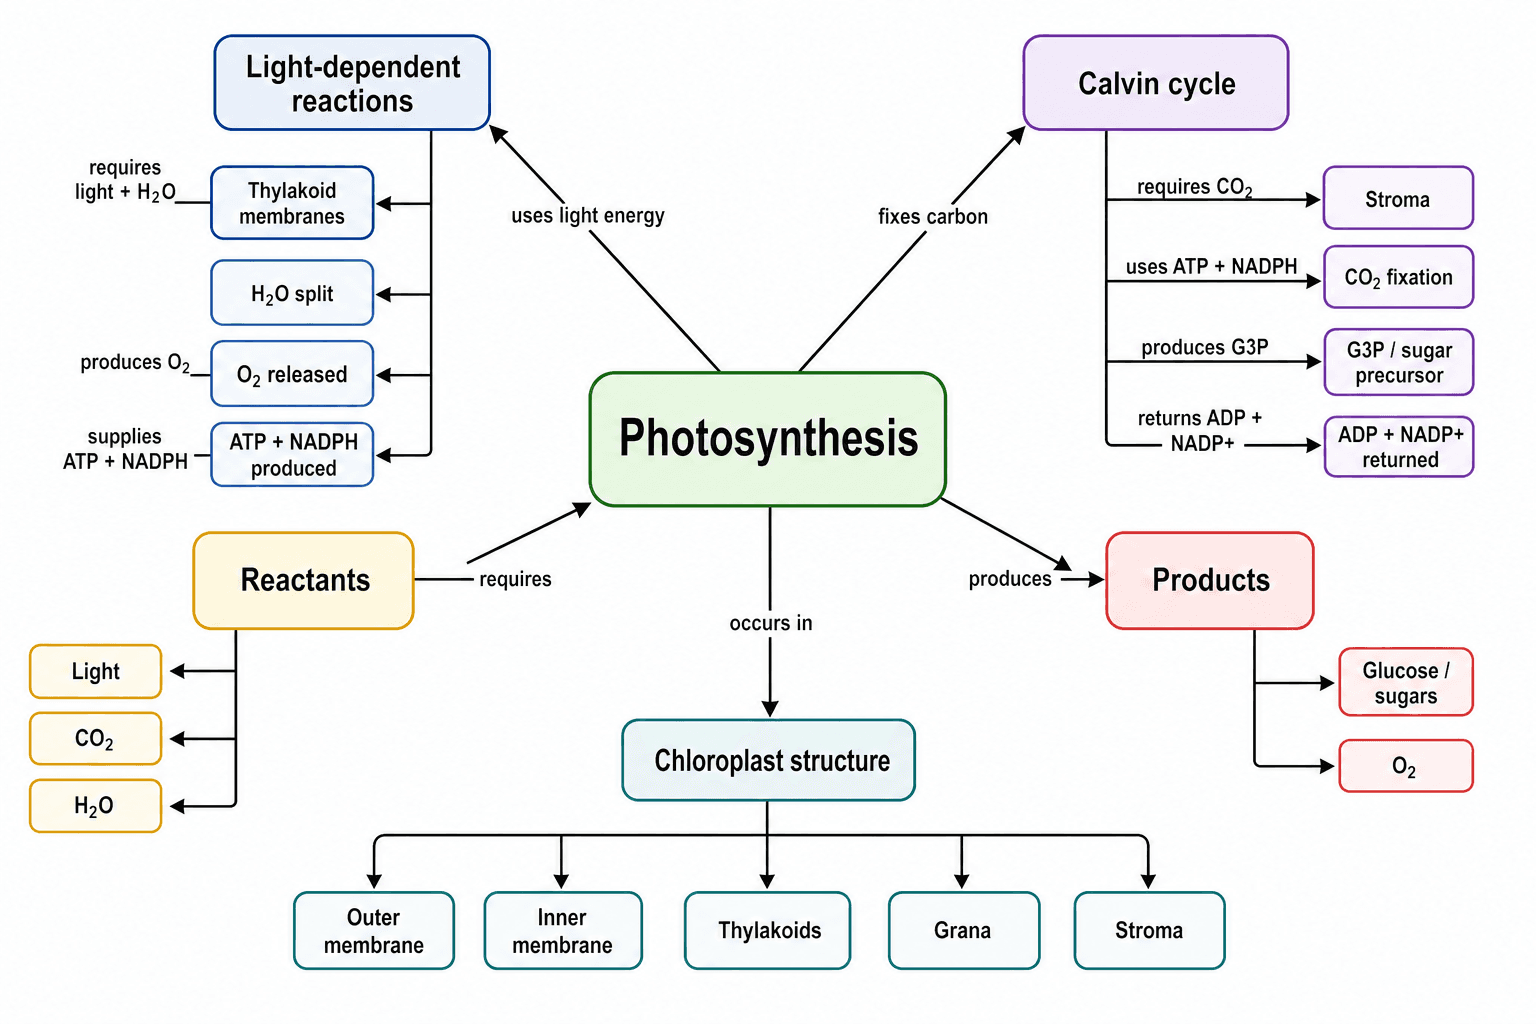
Beschriftete Diagramme für den Unterricht — aus einem Satz
Schließen Sie sich über 35.000 Forschenden, Studierenden & Lehrenden an, die SciDraw AI nutzen
Verbringen Sie keine Stunden mehr mit wissenschaftlichen Grafiken. Erstellen Sie Abbildungen für Paper, Abschlussarbeiten, Lehre und Vorträge mit KI. Kostenlose Credits verfügbar.