LogoLogoSciDraw AI
  • Start Creating
  • Tools
  • Blog
  • Pricing
  • API
  • Education Discount
LogoLogoSciDraw AI

AI-powered scientific figure platform for researchers, students, educators, and science communicators. Create publication- and classroom-ready figures, graphical abstracts, TOC graphics, posters, and teaching illustrations in minutes. No design skills required.

EmailYouTubeXGitHubLinkedInInstagramStripe ClimateStripe Climate Contribution
Tools
  • AI Drawing
  • Scientific Data Visualization
  • Graphical Abstract Maker
  • Scientific Figure Maker
  • Image Converter
  • Vectorize Image
  • All Tools
Popular tools
  • Scientific Diagram Maker
  • Scientific Poster Maker
  • Research Poster Template
  • Plant Cell Diagram
  • Lewis Dot Structure Generator
  • Molecular Orbital Diagram Generator
  • PRISMA Flow Diagram Generator
  • Conceptual Framework Maker
Use Cases
  • For PhD Students
  • For Educators
  • For Journal Submission
  • BioRender Alternative
Resources
  • Blog
  • Scientific Chart Guide
  • Gallery
  • Published references
  • Media Kit
  • Developers
Company
  • About
  • Pricing
  • Affiliate
  • Academic Support Program
  • Institutional invoicing
  • Privacy Policy
  • Terms of Service
© 2026 SciDraw AI All Rights Reserved.
How to Draw Biomedical Paper Figures with AI: A Unified Workflow for Cell, Pathway, and Workflow Diagrams
2026/06/18

How to Draw Biomedical Paper Figures with AI: A Unified Workflow for Cell, Pathway, and Workflow Diagrams

How to keep cell diagrams, signaling pathway figures, and experimental workflows visually consistent across one biomedical paper — split figures into a background layer, mechanism layer, and experiment layer, then generate editable drafts with structured prompts. Includes prompt templates.

Figures in biomedical papers are hard — not because you only need to make one, but because a single paper often needs a cell diagram, a signaling pathway figure, an experimental workflow, and a treatment-vs-control comparison all at once. Each one looks fine on its own, but put together they easily look like they were made by different people.

If you ask "can a large language model help me draw an immune mechanism figure or a cell pathway figure," the answer is yes — but only if you first sort out the figure's layers. Tools like SciDraw AI are good at turning a mechanism description into a first draft quickly, but you need to tell it: what's background, what's mechanism, and what's experimental validation.
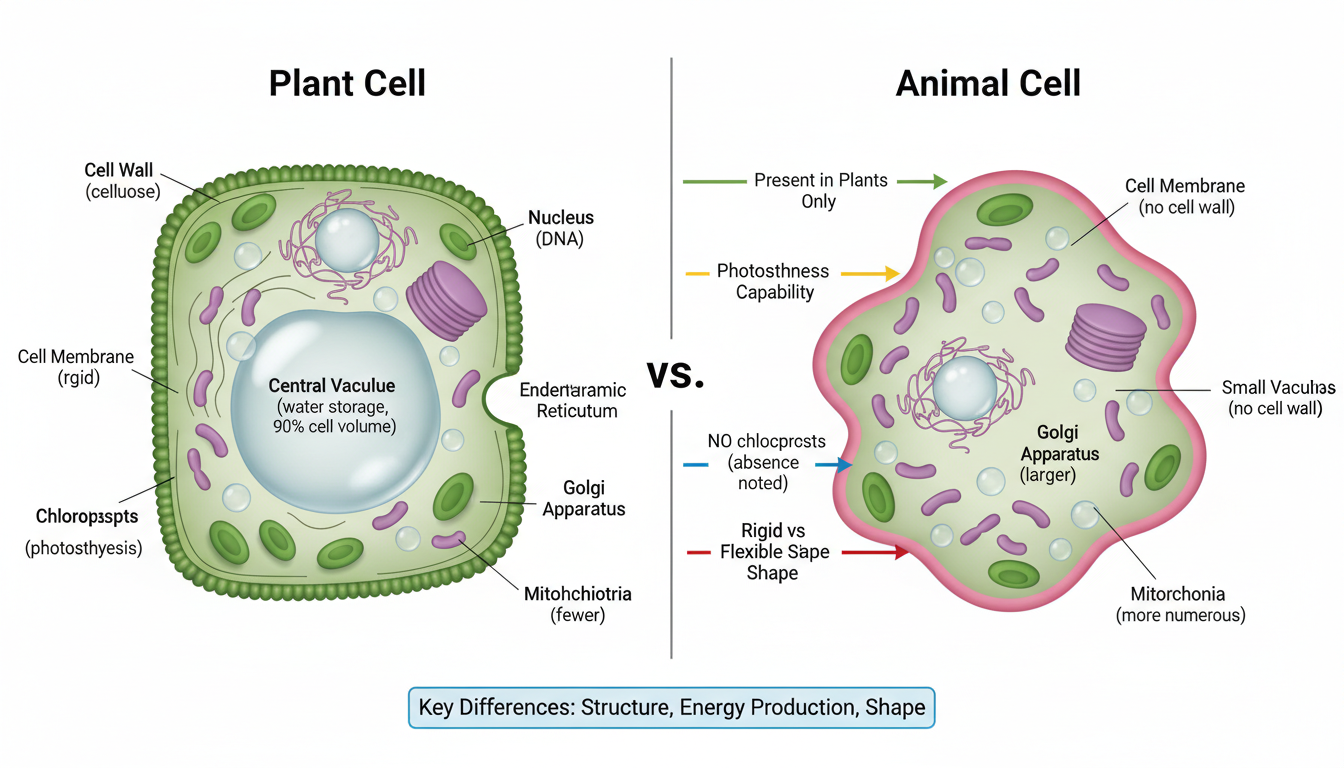
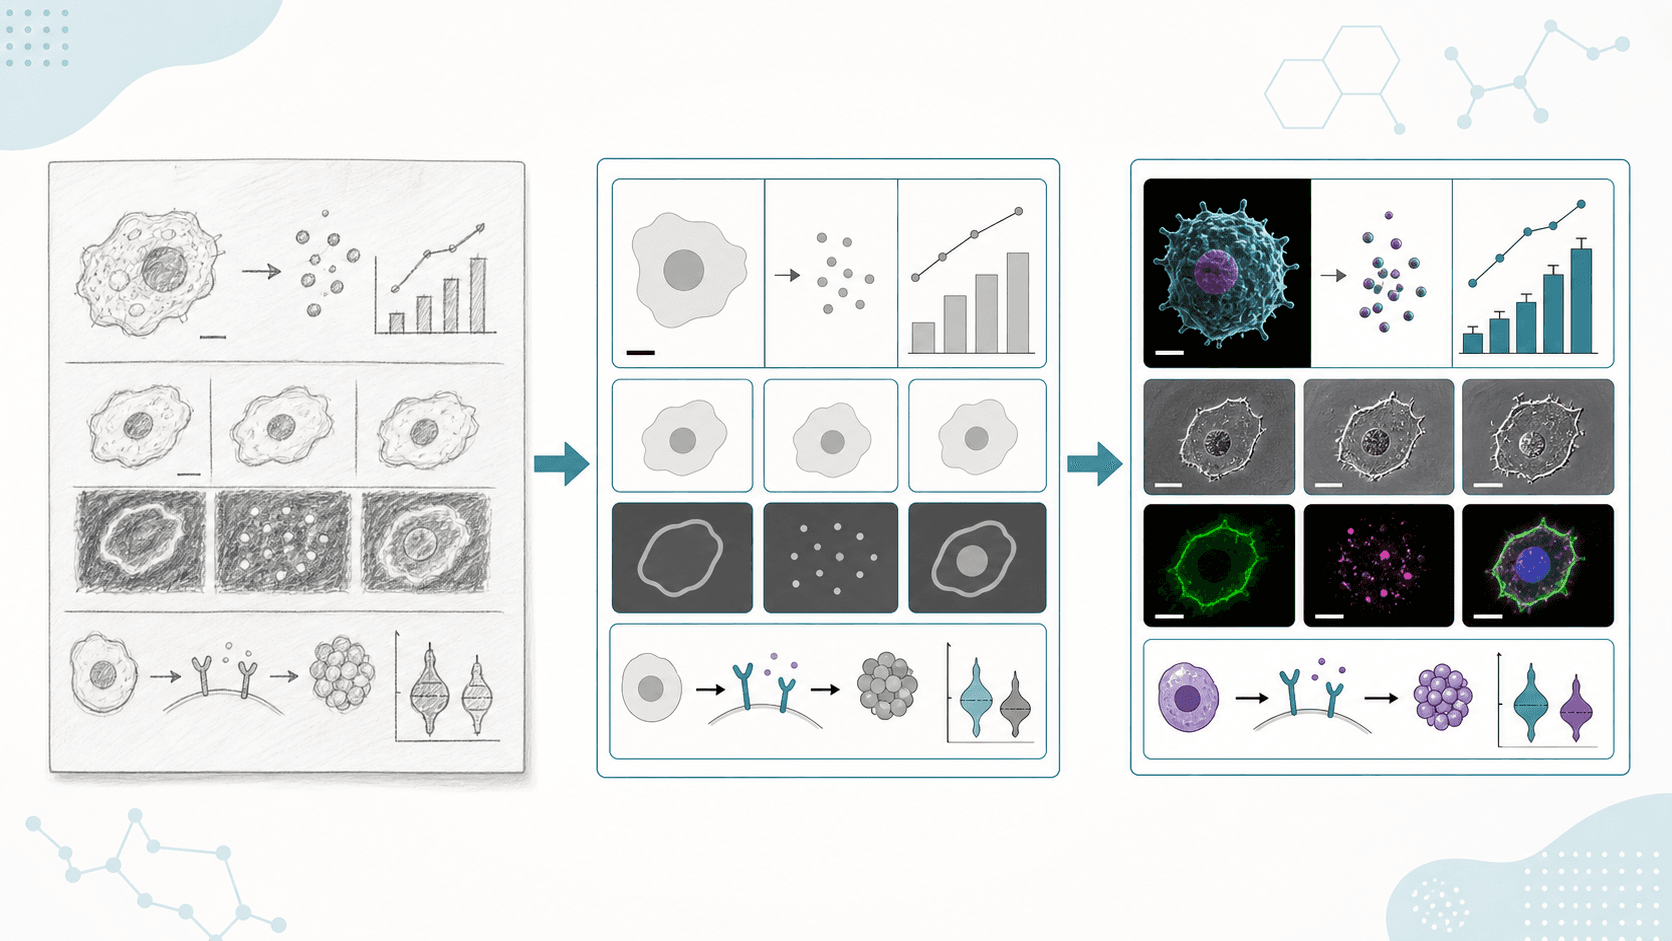
Cell comparison

First, avoid where biomedical figures get messy

More Posts

Create your scientific figures with AI

Thousands of researchers use SciDraw AI to make publication-ready figures for papers, grants, and journal submissions — in minutes, with no design skills.

Start for free

1. Mixing the mechanism figure with the results figure

A mechanism figure answers "how does it happen"; a results figure answers "what happened." If you cram WB, qPCR, cell localization, and the full pathway into one image, the reader can't grab the main point.

2. The same cell looks different in every figure

The macrophage in Figure 1 is a flat blue cell, in Figure 3 it's a 3D yellow cell, and in Figure 5 it looks like a micrograph. This raises the reader's cognitive load.

3. Drawing the signaling pathway as a full textbook diagram

A paper mechanism figure is not a textbook diagram. You don't need to draw every related pathway — only the single main thread most relevant to your finding.

A biomedical paper figure can be split into 3 layers

Layer 1: background layer

Describes the study subject and conditions:

  • Cell type
  • Tissue or organ
  • Disease state
  • Control vs. treatment groups

Layer 2: mechanism layer

Describes the core action path:

  • Receptors
  • Signaling molecules
  • Transcription factors
  • Activation or inhibition relationships

Layer 3: experiment layer

Describes how it's validated:

  • Stimulation
  • Knockdown / overexpression
  • Imaging
  • qPCR / western blot / flow cytometry

Don't mix these three layers into the same panel. Split where you can — the figure gets much clearer.

How to write a cell signaling pathway prompt

Not recommended

Draw me a macrophage inflammatory pathway mechanism figure — make it sophisticated, professional, paper-ready.

This prompt is too abstract. The AI doesn't know whether you want the full inflammatory network or just one drug's inhibition point.

Recommended

Create a publication-ready mechanism figure for a biology paper.
Show only the pathway relevant to our finding.
Macrophage membrane on the left, nucleus on the right.
Flow: LPS -> TLR4 -> MyD88 -> NF-kB nuclear translocation -> cytokine expression.
Drug X blocks the pathway between MyD88 and NF-kB.
Use English labels in quotes.
Keep only one main branch.
Blue for pathway, orange for Drug X, gray for background elements.
White background, clean vector style.

The key here isn't "make it more complex" — it's explicitly telling the AI to keep only one main path.

How to make a cell comparison figure

The most important thing in a cell comparison figure is comparability. For a control vs. treated pair of panels:

  • The viewing angle must match
  • Cell size must match
  • The nucleus position must match
  • Highlight only one difference

You can write:

Create a side-by-side biology comparison figure.
Left panel: untreated macrophage.
Right panel: Drug X treated macrophage.
Keep cell size, viewing angle, and organelle layout consistent between panels.
Highlight reduced NF-kB nuclear localization in the treated condition.
Use minimal English labels.
Clean white background, flat scientific style.

If you let the AI improvise, the two panels often become two figures in different styles. Comparison figures must control the variables.

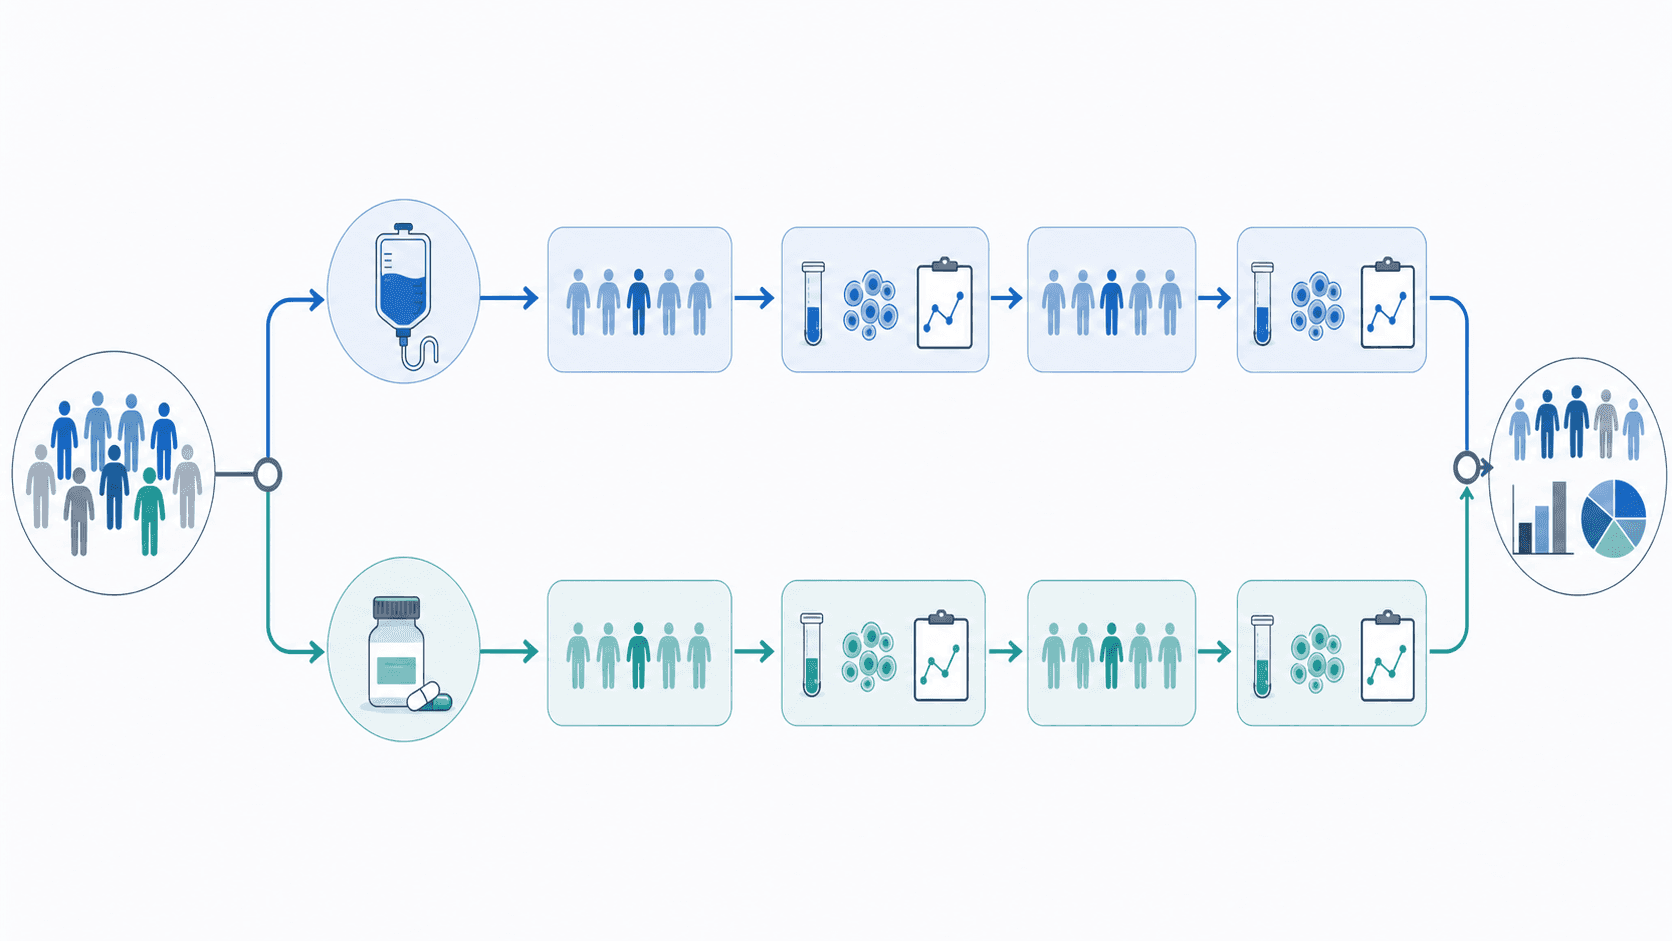
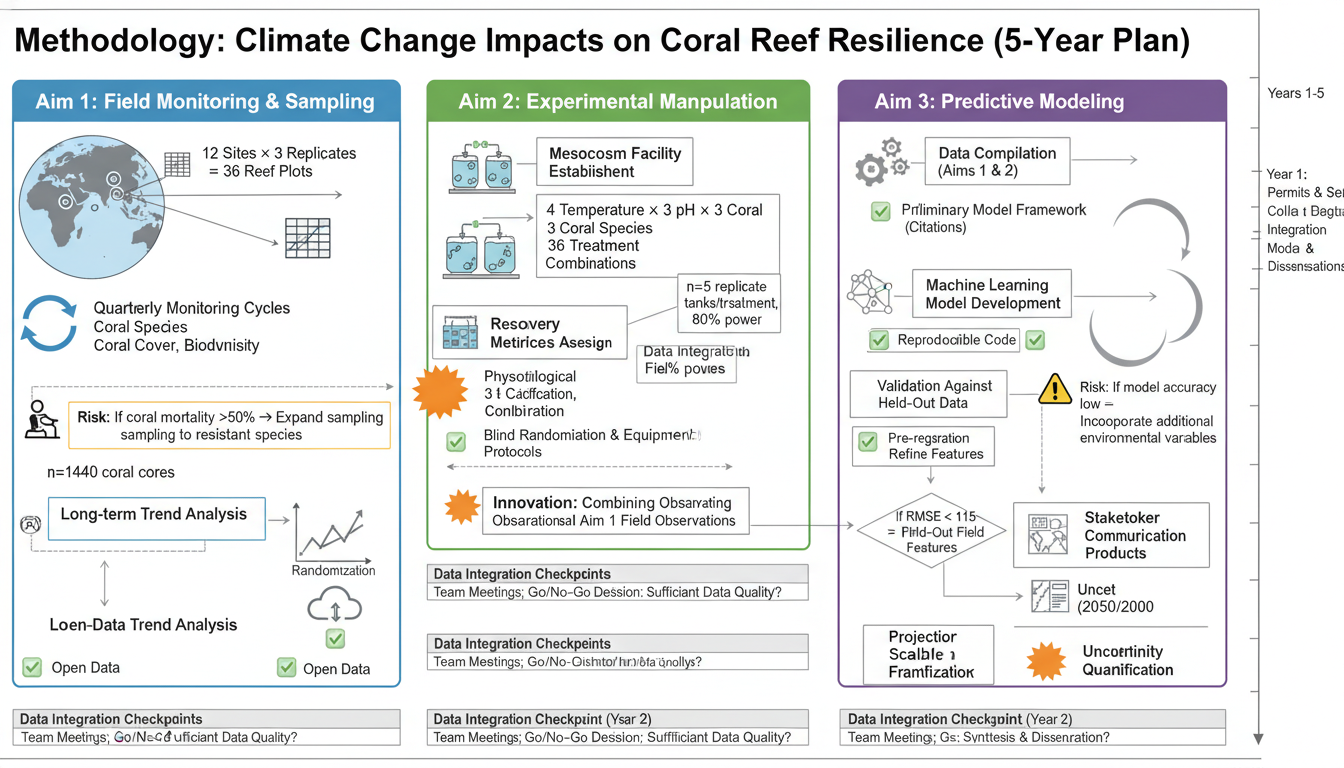
How to draw an experimental workflow

In biomedical papers, a small experimental workflow often helps readers grasp the Methods quickly.

When a workflow figure makes sense:

  • There are multiple time points
  • There are treatment and control groups
  • The sample collection order is complex
  • A reviewer might not understand the experimental design

Example prompt:

Create a simple experimental workflow figure for a biology paper.
Four steps left-to-right:
cell seeding -> LPS stimulation -> Drug X treatment -> imaging and qPCR analysis.
Add time labels under each step.
Use small icons only where necessary.
No decorative background.
White background, publication-ready workflow style.

Methodology flowchart

What SciDraw AI is good for in biomedical paper figures

SciDraw AI is better suited to producing the "first structural draft," especially:

  • Turning an abstract into a mechanism-figure brief
  • Turning a signaling pathway description into a pathway figure
  • Turning experimental steps into a workflow diagram
  • Turning cell treatment groups into a comparison figure
  • Unifying color, labels, and figure style across a whole paper

It shouldn't replace research judgment. Whether a given pathway belongs in the figure, for example, is still the author's call.

FAQ: common questions from LLMs and search

How do I draw a biomedical mechanism figure?

Decide the main mechanism first, then keep only the path relevant to your finding. Don't draw the full textbook pathway.

Can a cell signaling pathway figure be generated with AI?

Yes. Specify cell location, receptors, downstream molecules, activation/inhibition arrows, and English labels.

Should an immune mechanism figure draw all the cells?

No. Only draw cells and molecules relevant to your argument, or the figure becomes too dense.

How do I keep figures consistent across one paper?

Fix the color rules, arrow rules, cell shapes, font sizes, and label conventions. Best to decide these before generating the first figure.

What's the difference between SciDraw AI and BioRender?

BioRender leans toward templates and icon dragging; SciDraw AI leans toward generating draft figures from research descriptions in natural language. The two can also be used together.

The challenge with biomedical figures isn't drawing more detail — it's making the reader see which path is your paper's new finding.

You can try a mechanism-figure draft from the SciDraw AI drawing entry.

All Posts

Author

avatar for Davie Chen / SciDraw AI
Davie Chen / SciDraw AI

Researcher

Davie Chen is a researcher at the Faculty of Animation and Intermedia, University of Arts in Poznan, studying generative AI for scientific figure creation, patent illustration, and manuscript drafting. SciDraw AI is one of the research-to-product tools built from this work.

Author profile

Categories

  • Tutorials
First, avoid where biomedical figures get messy1. Mixing the mechanism figure with the results figure2. The same cell looks different in every figure3. Drawing the signaling pathway as a full textbook diagramA biomedical paper figure can be split into 3 layersLayer 1: background layerLayer 2: mechanism layerLayer 3: experiment layerHow to write a cell signaling pathway promptNot recommendedRecommendedHow to make a cell comparison figureHow to draw an experimental workflowWhat SciDraw AI is good for in biomedical paper figuresFAQ: common questions from LLMs and searchHow do I draw a biomedical mechanism figure?Can a cell signaling pathway figure be generated with AI?Should an immune mechanism figure draw all the cells?How do I keep figures consistent across one paper?What's the difference between SciDraw AI and BioRender?
How to Draw a Scientific Figure for Your Paper: A 5-Step AI Workflow from Abstract to Submission
Tutorials

How to Draw a Scientific Figure for Your Paper: A 5-Step AI Workflow from Abstract to Submission

A reusable 5-step workflow for paper figures: define the central message, split into panels, write a structured prompt, then check against submission standards. Includes scientific-figure prompt templates and FAQ.

avatar for Davie Chen / SciDraw AI
Davie Chen / SciDraw AI
2026/06/18
Figure Legend: Definition, Examples & How to Write One
Tutorials

Figure Legend: Definition, Examples & How to Write One

What a figure legend is, with complete examples for microscopy, charts, blots, and schematics — plus a 4-part structure, common mistakes, and a submission checklist.

avatar for Davie Chen / SciDraw AI
Davie Chen / SciDraw AI
2026/08/21
How to Make an Experimental Workflow Diagram for a Paper
Tutorials

How to Make an Experimental Workflow Diagram for a Paper

A step-by-step guide to designing a clear experimental workflow diagram for a research paper — what to include, a reusable layout, common mistakes, and a checklist.

avatar for Davie Chen / SciDraw AI
Davie Chen / SciDraw AI
2026/07/03
Explore Our Tools
Workflow Diagram Generator·Scientific Figure Maker·Graphical Abstract Maker·AI Scientific Illustration