LogoLogoSciDraw AI
  • Start Creating
  • Tools
  • Blog
  • Pricing
  • Education Discount
LogoLogoSciDraw AI

AI-powered scientific figure platform for researchers, students, educators, and science communicators. Create publication- and classroom-ready figures, graphical abstracts, TOC graphics, posters, and teaching illustrations in minutes. No design skills required.

EmailYouTubeXGitHubLinkedInInstagramStripe ClimateStripe Climate Contribution
Tools
  • AI Drawing
  • Graphical Abstract Maker
  • Scientific Figure Maker
  • Image Converter
  • Vectorize Image
  • All Tools
Popular tools
  • Scientific Diagram Maker
  • Scientific Poster Maker
  • Research Poster Template
  • Plant Cell Diagram
  • Lewis Dot Structure Generator
  • Molecular Orbital Diagram Generator
  • PRISMA Flow Diagram Generator
  • Conceptual Framework Maker
Use Cases
  • For PhD Students
  • For Educators
  • For Journal Submission
  • BioRender Alternative
Resources
  • Blog
  • Gallery
  • Published references
  • Media Kit
  • Developers
Company
  • About
  • Pricing
  • Affiliate
  • Institutional invoicing
  • Privacy Policy
  • Terms of Service
© 2026 SciDraw AI All Rights Reserved.
24 Neural Network Diagram Prompts for Paper-Ready Architectures (2026)
2026/06/17

24 Neural Network Diagram Prompts for Paper-Ready Architectures (2026)

Copy-paste neural network diagram prompts for deep learning architecture diagrams — CNN, Transformer, RNN/LSTM, MLP, U-Net, GANs, and ML pipelines — plus a reusable prompt template, real examples, and tips for labeled layers, tensor shapes, and clean data flow.

A good model architecture figure lets a reader understand your network at a glance: the layers in order, the tensor shapes flowing through, and where the interesting blocks live. But drawing them by hand is slow, and generic image AI garbles the labels. This guide gives you 24 ready-to-use neural network diagram prompts, a reusable prompt template, and real generated examples, so you can create clean, labeled, paper-ready architecture figures with AI in minutes — no vector software and no drawing skills required.

By the end of this guide you'll be able to:

  • Generate a CNN architecture diagram, transformer architecture diagram, RNN/LSTM diagram, MLP diagram, U-Net diagram, and ML pipeline diagram from a single sentence.
  • Adapt any prompt to your own model using a simple four-part template.
  • Avoid the common mistakes that make AI neural net diagrams look wrong.

Paste any prompt into the Neural Network Diagram Generator, then refine the result by asking to add a layer, annotate tensor shapes, recolor, or relabel — or open it in the SciDraw AI editor to keep iterating.

The anatomy of a great architecture prompt

Most weak results come from vague prompts. Strong neural network diagram generator prompts have four parts:

  1. Subject — what model or block (e.g. "a CNN image classifier", "a single LSTM cell").
  2. Layers/blocks in order — list every stage from input to output (conv, pool, attention, dense, softmax).
  3. Labels/tensor shapes — name each block and request feature-map or tensor sizes where reviewers expect them.
  4. Style & direction — "flat technical schematic, left-to-right data flow, labeled blocks, clean sans-serif text."
All Posts

Author

avatar for Davie Chen / SciDraw AI
Davie Chen / SciDraw AI

Researcher

Davie Chen is a researcher at the Faculty of Animation and Intermedia, University of Arts in Poznan, studying generative AI for scientific figure creation, patent illustration, and manuscript drafting. SciDraw AI is one of the research-to-product tools built from this work.

Author profile

Categories

The anatomy of a great architecture promptHow to get clean architecture figuresConvolutional networks (CNN, ResNet, U-Net)Transformers and attentionRecurrent and sequence models (RNN, LSTM, seq2seq)Classic and generative models (MLP, autoencoder, GAN, diffusion)End-to-end ML pipelinesCommon mistakes (and how to fix them)Export and use your architecture figuresFrequently asked questionsStart creating

More Posts

Create your scientific figures with AI

Thousands of researchers use SciDraw AI to make publication-ready figures for papers, grants, and journal submissions — in minutes, with no design skills.

Start for free

Template: "Draw [model] with [layers/blocks in order, input → output]. Label [block names and tensor shapes]. Use a clean flat technical schematic with left-to-right data flow."

Keep this one-liner handy — every prompt below follows it, and you can swap in your own model when you want to draw a neural network online.

How to get clean architecture figures

  • List layers in order, with explicit input and output, so the data flow is unambiguous.
  • Ask for tensor shapes (e.g. "label feature-map sizes" or "annotate output dimensions") when you need a rigorous model architecture figure.
  • Name the blocks — "multi-head attention", "residual block", "skip connection" — so each is drawn distinctly.
  • Specify direction. Left-to-right is the convention for an architecture diagram for papers; top-to-bottom keeps very deep stacks readable.
  • Keep in-figure text short. Put detail in the caption, not inside the diagram.
  • Iterate, don't restart. Refine with "add batch-norm after each conv" instead of rewriting the whole prompt.

Convolutional networks (CNN, ResNet, U-Net)

CNN figures are the most requested deep learning architecture diagram — and the easiest to get cluttered, because the conv/pool stack and changing feature-map sizes must be labeled cleanly. Start with the full classifier, then branch into residual blocks and segmentation nets.

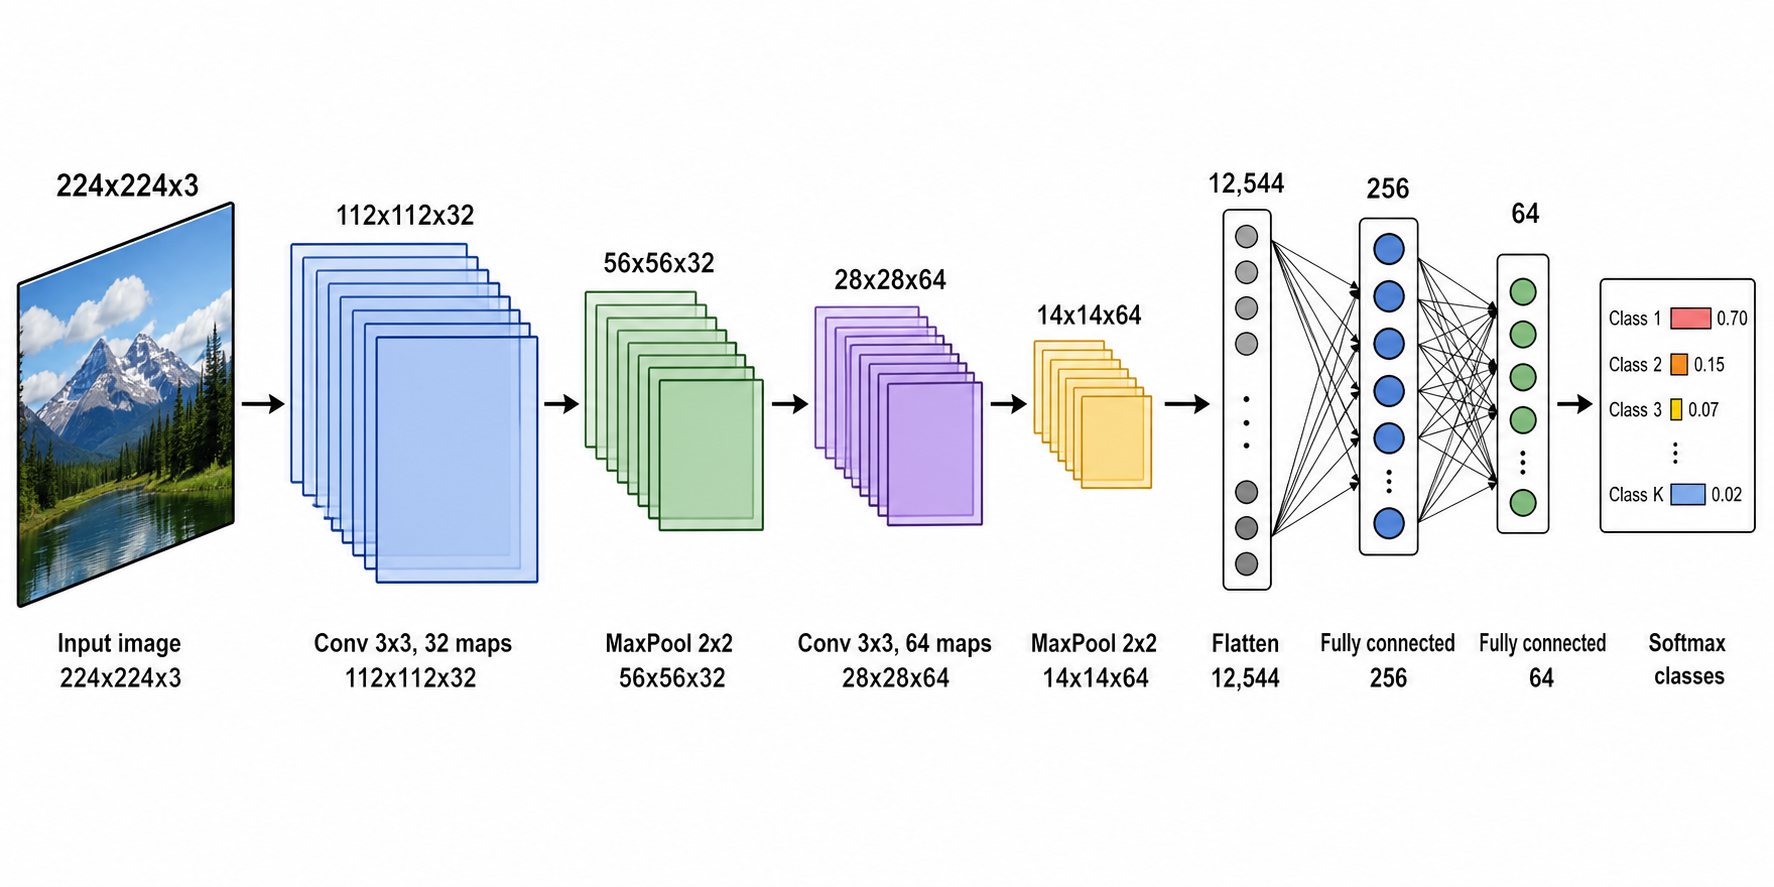
CNN architecture diagram showing input image through convolution and pooling layers to flatten, fully connected layers, and softmax classifier with labeled feature-map sizes

  1. Draw a CNN architecture diagram from an input image through stacked convolution and pooling layers to flattening, two fully connected layers, and a softmax classifier; label the feature-map size at each stage (e.g. 224×224×3 → 112×112×64) and the data flowing left to right.
  2. Draw a ResNet residual block showing the skip (identity) connection added back to the two-layer convolutional path, with the add operation, ReLU, and batch-norm labeled clearly.
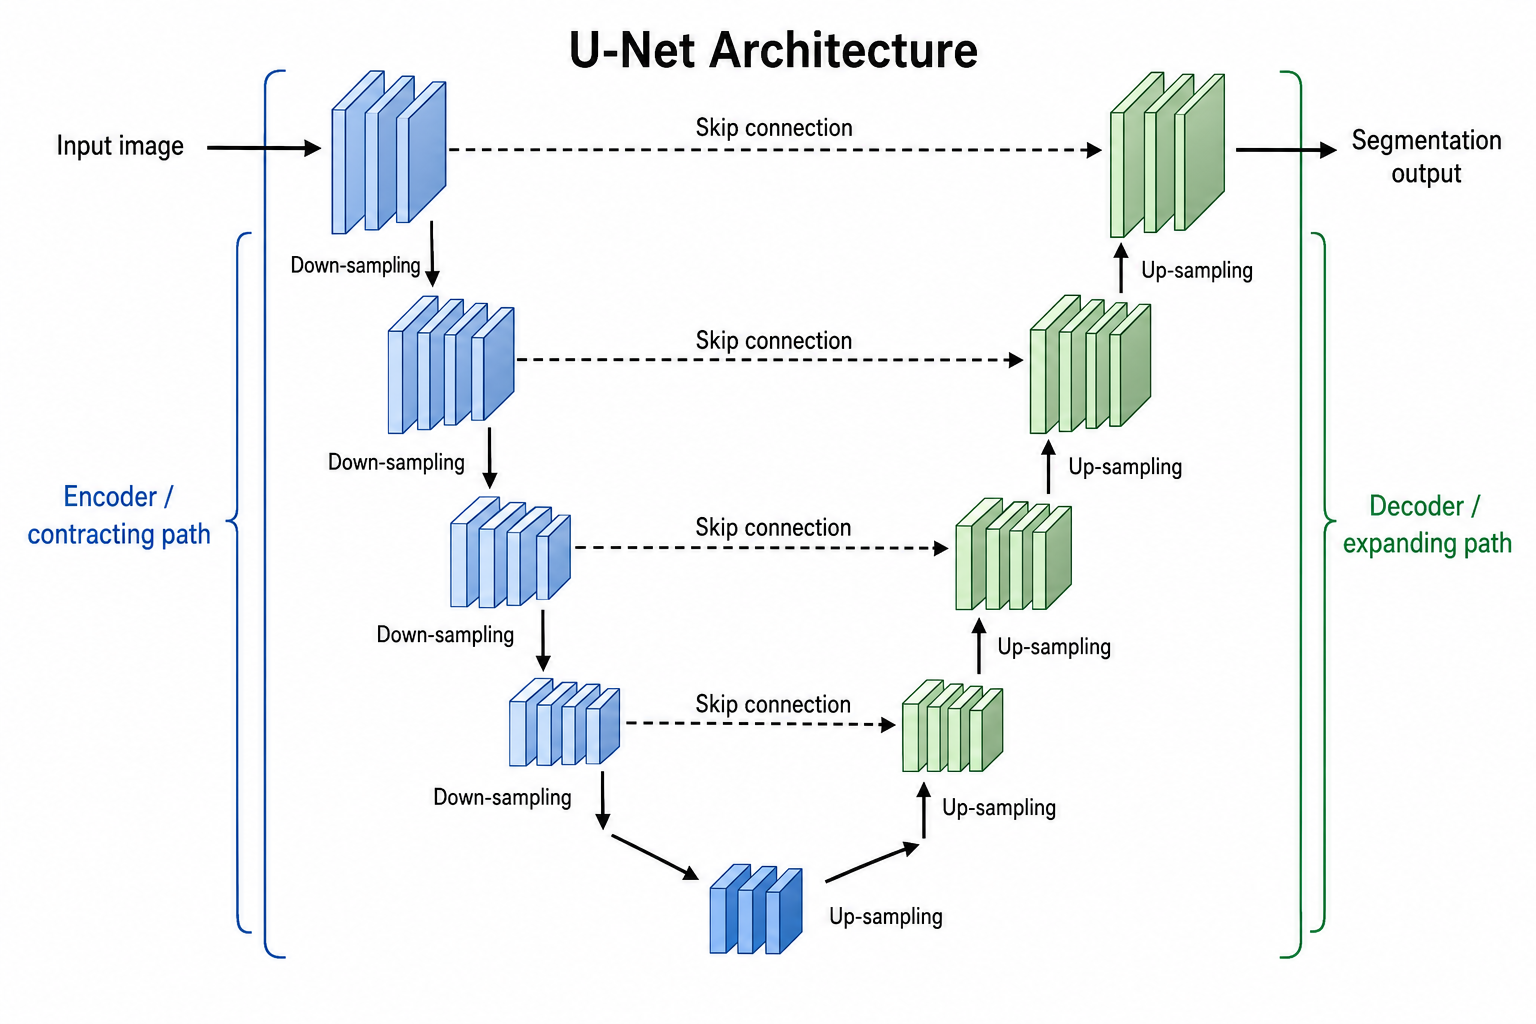
  3. Draw a U-Net diagram with its contracting encoder, expanding decoder, and the skip connections bridging matching levels; label down-sampling, up-sampling, the bottleneck, and the segmentation output mask.
  4. Draw a depthwise-separable convolution block (MobileNet-style) contrasting it with a standard convolution, labeling the depthwise and pointwise stages and the parameter savings.
  5. Draw a vision backbone with a feature-pyramid network (FPN): a CNN producing multi-scale feature maps merged top-down with lateral connections, each level labeled.

U-Net diagram showing contracting encoder, expanding decoder, bottleneck, and skip connections with segmentation output mask for an image-to-image model architecture figure

Transformers and attention

The transformer architecture diagram is now the most-searched neural net figure thanks to LLMs and ViTs. These prompts cover the full encoder-decoder stack, a single attention block, and the encoder-only vs decoder-only contrast.

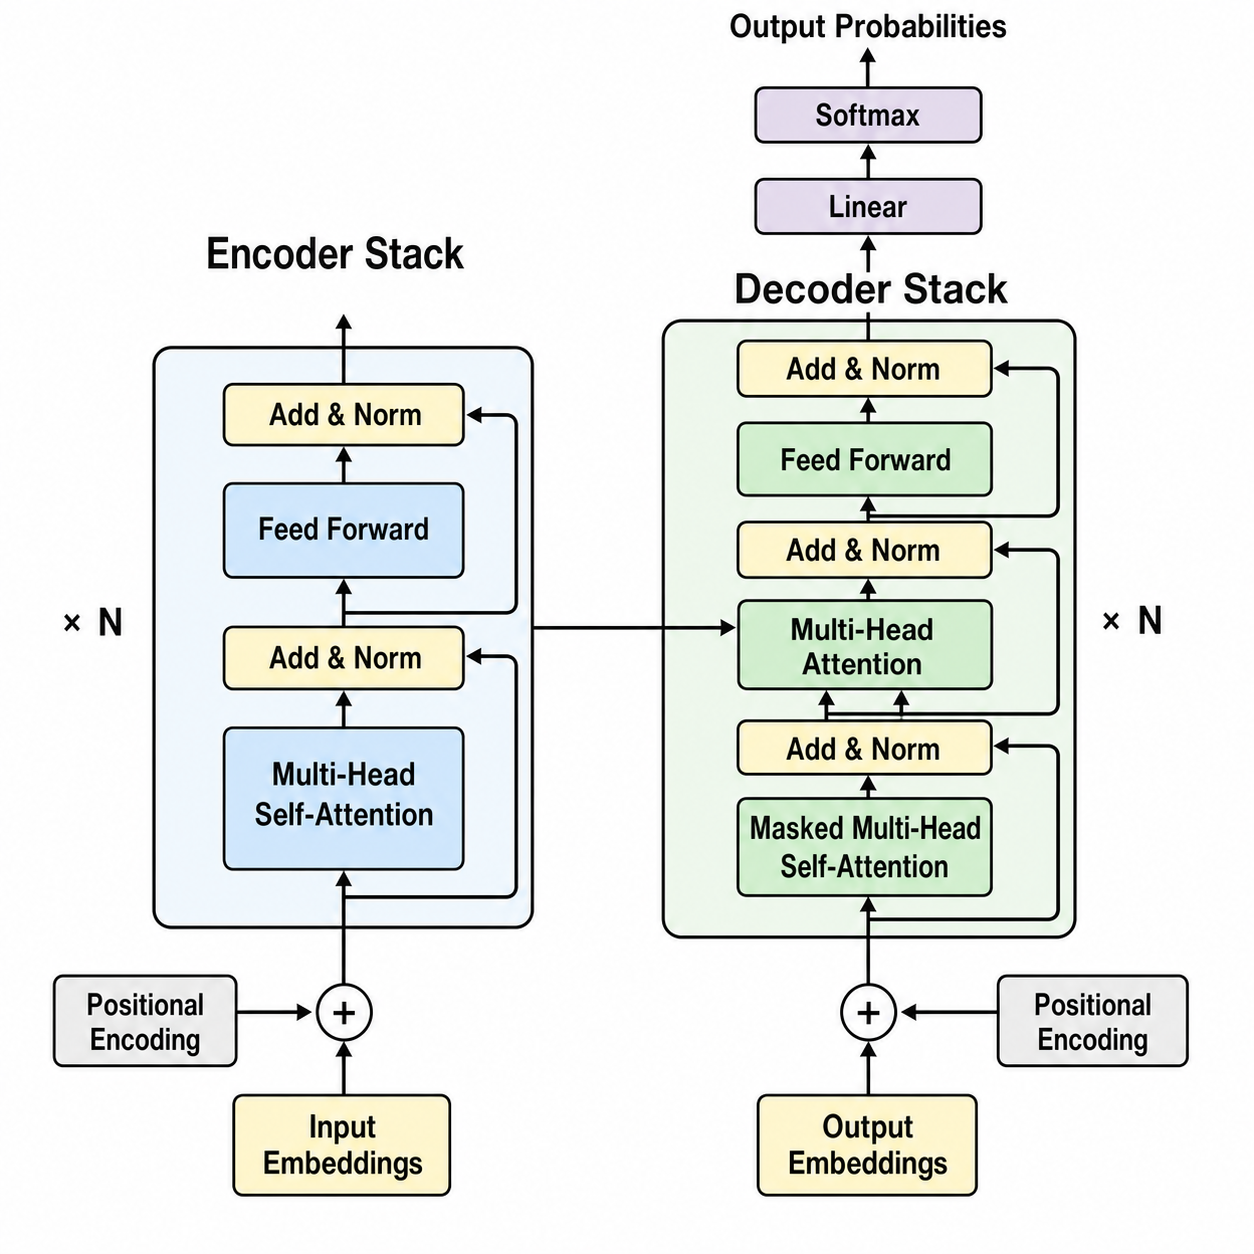
Transformer architecture diagram with encoder and decoder stacks, input embeddings plus positional encoding, multi-head self-attention, feed-forward blocks, add-and-norm layers, and output softmax

  1. Draw the full Transformer architecture with stacked encoder and decoder blocks: input embeddings plus positional encoding, multi-head self-attention, feed-forward sub-layers, add-and-norm residual connections, masked attention in the decoder, and the final linear-plus-softmax output.
  2. Draw a single multi-head self-attention block showing the queries, keys, and values, the scaled dot-product attention, the softmax, and the concatenation of heads, with tensor shapes annotated.
  3. Draw a vision Transformer (ViT) splitting an input image into fixed-size patches, linearly embedding them, prepending a class token, adding positional encodings, and passing them through a Transformer encoder to a classification head.
  4. Draw an encoder-only Transformer (BERT-style) versus a decoder-only Transformer (GPT-style) side by side, labeling the attention masking difference and the typical task for each.
  5. Draw the positional-encoding step in isolation: a sequence of token embeddings being summed with sinusoidal positional vectors, labeled clearly.

Recurrent and sequence models (RNN, LSTM, seq2seq)

An RNN/LSTM diagram has to show time clearly — either unrolled across time steps or as a single gated cell. These prompts handle both, plus the classic encoder-decoder sequence model.

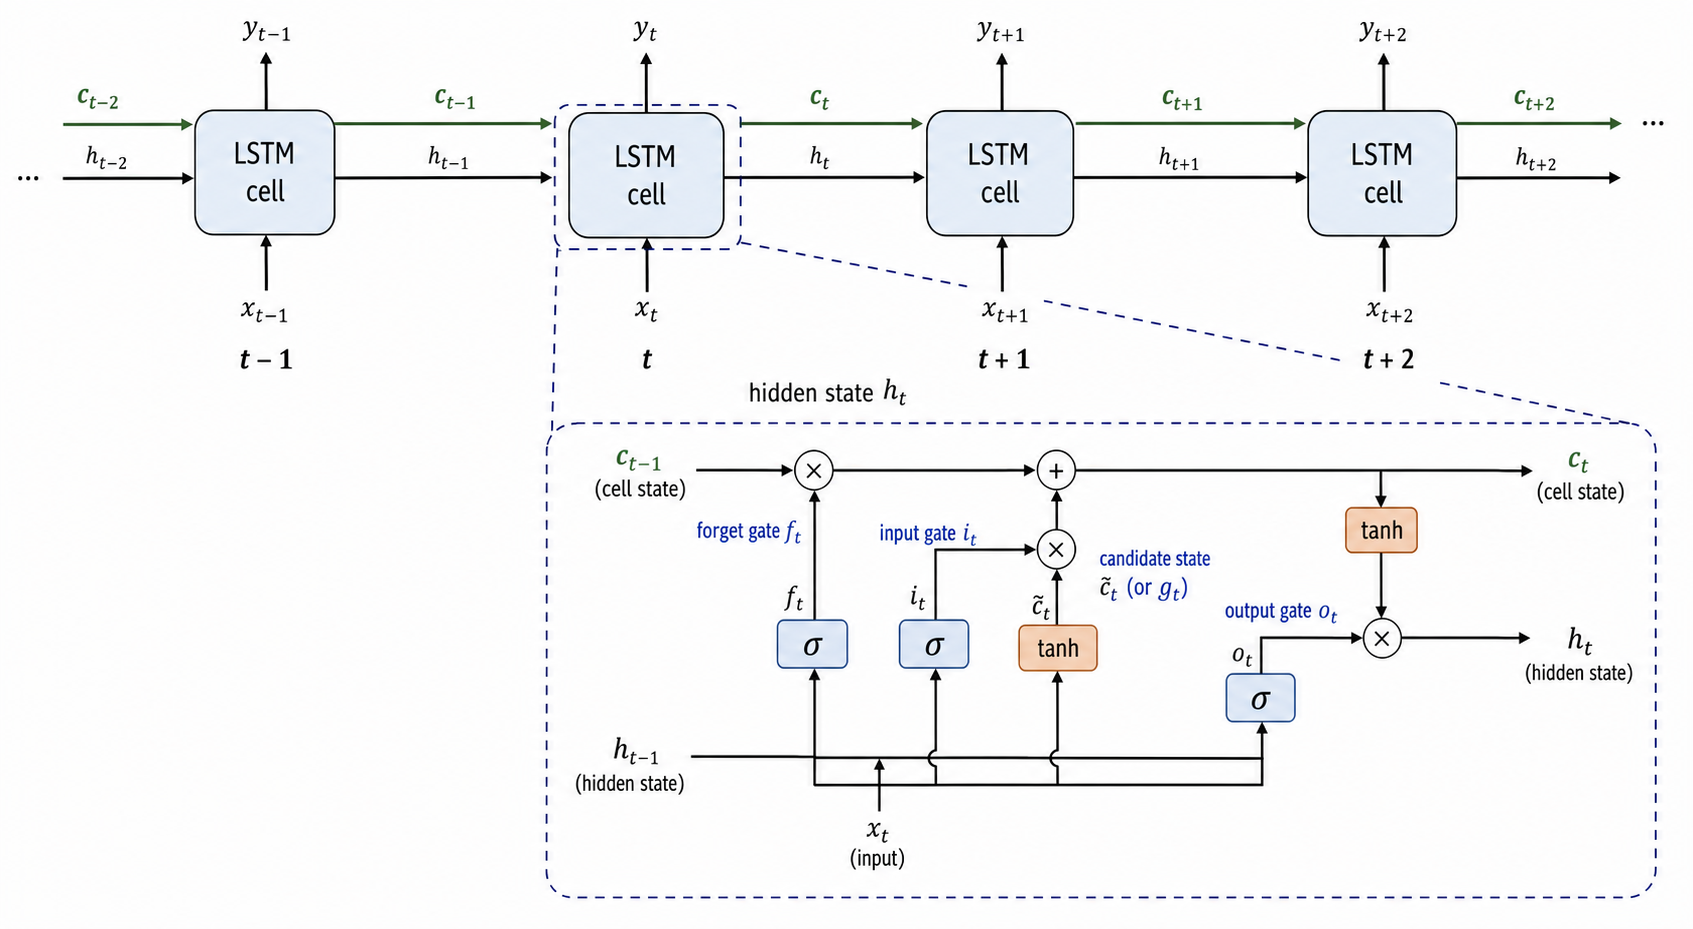
RNN and LSTM diagram showing a recurrent network unrolled across time steps with hidden state passing between steps, and an LSTM cell with input, forget, and output gates and the cell state

  1. Draw a recurrent neural network unrolled across four time steps, with the input, hidden state, and output at each step and the hidden state arrow passing from one step to the next, all labeled.
  2. Draw a single LSTM cell showing the input gate, forget gate, and output gate, the candidate values, the cell state running through the top, and the gating multiplications, with each component labeled.
  3. Draw a GRU cell contrasting it with an LSTM cell, labeling the update and reset gates and noting the absence of a separate cell state.
  4. Draw a sequence-to-sequence model with an encoder RNN compressing the input into a context vector and a decoder RNN generating the output sequence, with an attention link between them labeled.
  5. Draw a bidirectional RNN processing a sequence forward and backward, with the two hidden-state streams concatenated at each time step.

Classic and generative models (MLP, autoencoder, GAN, diffusion)

From the textbook MLP diagram to modern generative nets, these are perfect for teaching and for the background section of a paper.

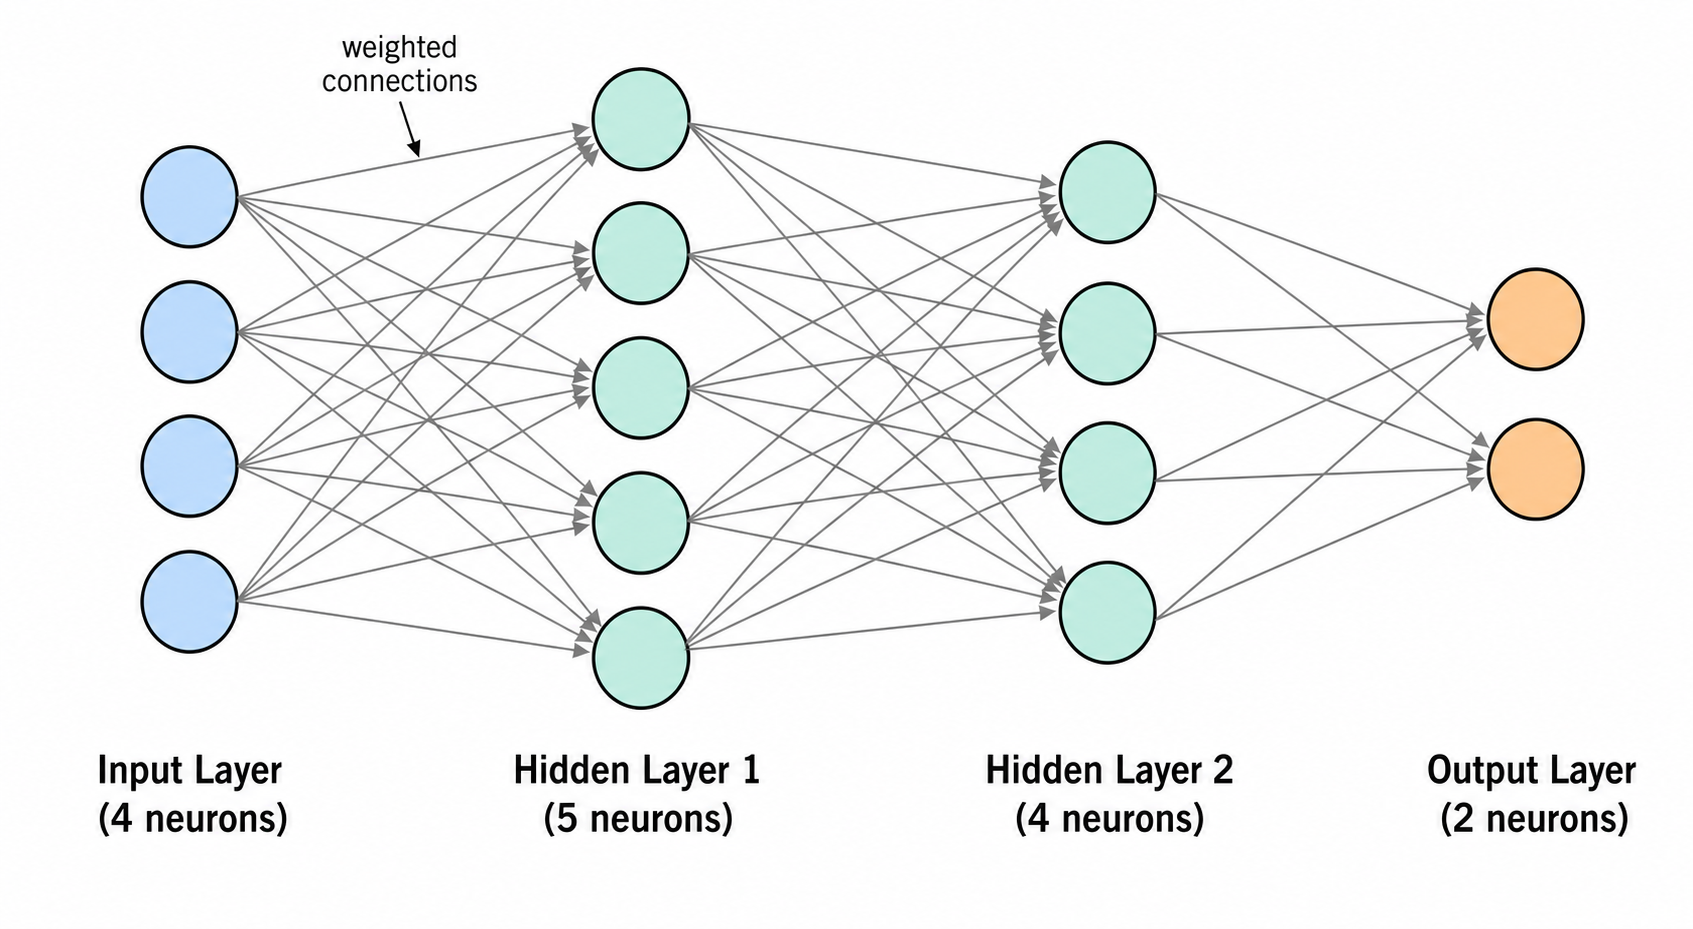
Feedforward MLP diagram with an input layer, two hidden layers, and an output layer showing fully connected neurons and labeled neuron counts per layer

  1. Draw a fully connected feed-forward network (MLP) with an input layer, two hidden layers, and an output layer, showing the dense connections between neurons and labeling the number of neurons in each layer.
  2. Draw an autoencoder with an encoder funneling the input down to a bottleneck latent space and a symmetric decoder reconstructing the input, labeling the compression and the latent dimension.
  3. Draw a variational autoencoder (VAE) showing the encoder producing a mean and variance, the sampled latent vector via the reparameterization trick, and the decoder reconstruction.
  4. Draw a GAN with a generator turning a noise vector into a fake sample and a discriminator classifying real vs fake, with the adversarial training loop and the two loss signals labeled.
  5. Draw a diffusion model's forward noising process and reverse denoising process as a left-to-right flow, labeling the noise schedule and the U-Net denoiser at each reverse step.

End-to-end ML pipelines

A clean ML pipeline diagram shows the whole system, not just the model — ideal for the methods or system-overview figure in a paper or report.

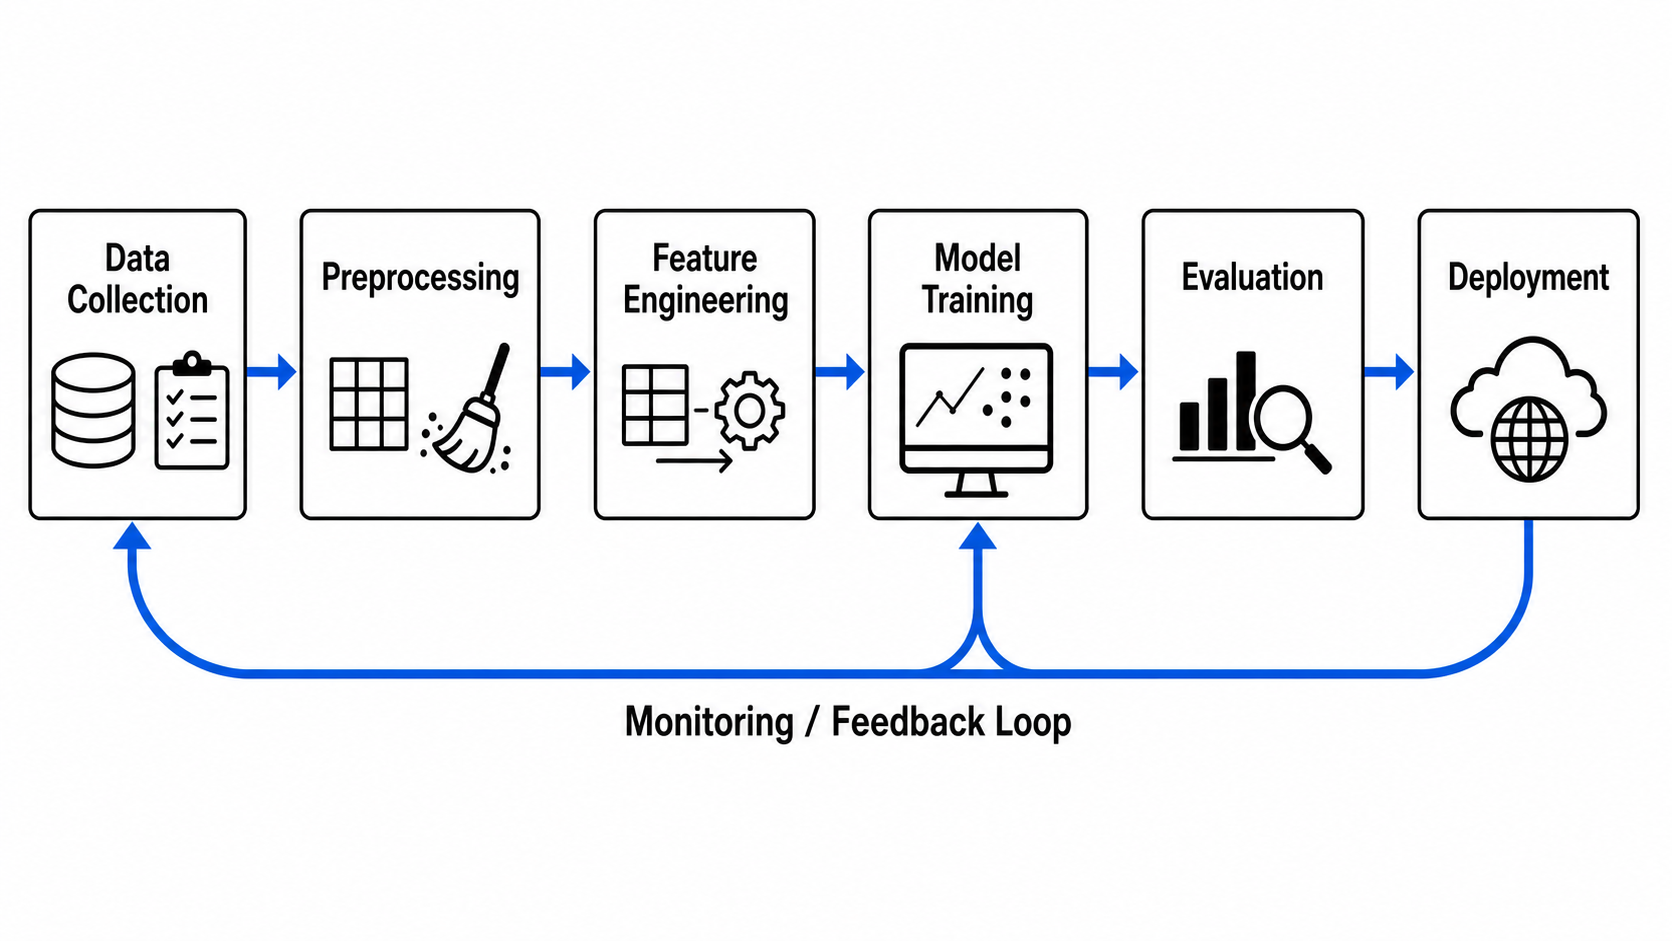
ML pipeline diagram showing data collection, preprocessing, feature engineering, model training, evaluation, and deployment stages with a monitoring feedback loop drawn left to right

  1. Draw an end-to-end machine-learning pipeline as a left-to-right flow: data collection, preprocessing, feature engineering, model training, evaluation, and deployment, with a monitoring feedback loop returning to data collection, each stage labeled.
  2. Draw a RAG (retrieval-augmented generation) system: a user query, an embedding step, a retriever over a vector database, the retrieved context, and an LLM generating the grounded answer, drawn left to right.
  3. Draw an MLOps lifecycle as a loop: data versioning, experiment tracking, model training, CI/CD, deployment, and monitoring, with drift detection triggering retraining.
  4. Draw a model-serving architecture: client requests hitting a load balancer, an inference server with batching, a GPU model replica, and a feature store, with latency annotations.

Common mistakes (and how to fix them)

  • Unlabeled or mislabeled blocks. Fix: list exact names in the prompt ("label conv1, pool1, fc1, softmax"). Re-prompt with "correct 'attetion' to 'multi-head attention'."
  • Missing or wrong tensor shapes. Fix: explicitly request "label the feature-map size at each stage" and give the input shape so the chain stays consistent.
  • Ambiguous data flow. Fix: ask for "left-to-right data flow with arrows" so a reader knows which way the tensors move.
  • Garbled text (typical of generic image AI). Fix: SciDraw AI renders clean sans-serif labels — re-prompt the exact wording if any token looks off.
  • Overcrowded stack. Fix: ask to "collapse repeated blocks into one labeled ×N" or split the figure into panels.

Export and use your architecture figures

Once a figure looks right, export it to editable SVG or PowerPoint (PPTX), or download a high-resolution image for your manuscript, slides, or poster. Need to fix a layer name, correct a typo, or translate a label? See how to edit text and labels in an AI figure. Need a different color scheme — for a journal's style or a colorblind-safe palette? See how to recolor a scientific diagram.

Frequently asked questions

What is the best neural network diagram generator? SciDraw AI's Neural Network Diagram Generator is built for paper-ready deep learning architecture diagrams — CNNs, Transformers, RNN/LSTM, MLPs, U-Net, GANs, and ML pipelines — with clean labeled blocks, tensor shapes, and editable SVG/PPTX export.

How do I draw a CNN architecture diagram with AI? Describe the layers in order (input → conv/pool stack → flatten → dense → softmax) and ask for feature-map sizes at each stage, then generate. Use prompt #1 above as a starting point and refine the labels.

Can I draw a neural network online for free? Yes — you can start generating neural network diagrams free, then upgrade for more credits and editable SVG/PPTX export for your figures.

Is this a good way to make a transformer architecture diagram for papers? Yes. Describe the encoder/decoder stacks, attention, and add-and-norm layers, generate, then export to vector format and drop it straight into your LaTeX or Word manuscript.

Are the figures accurate enough for publication? They are designed for paper-ready output, but always review the layer order, shapes, and labels for your specific model and correct anything before submitting.

Start creating

Pick any prompt above, paste it into the Neural Network Diagram Generator, and refine it in the SciDraw AI editor until it matches your model. From a simple MLP to a full Transformer, your next architecture figure is one sentence away.

AI Prompts
Prompts for Sensor Schematics and Microfluidic Chip Diagrams
AI Prompts

Prompts for Sensor Schematics and Microfluidic Chip Diagrams

Copy-paste AI prompts and layout structure for drawing sensor schematics — electrochemical, fluorescent probe, electrode — and microfluidic chip diagrams like lab-on-a-chip, droplet, and organ-on-a-chip.

avatar for Davie Chen / SciDraw AI
Davie Chen / SciDraw AI
2026/07/05
25 Immunology Diagram Prompts for Publication-Ready Figures (2026)
AI Prompts

25 Immunology Diagram Prompts for Publication-Ready Figures (2026)

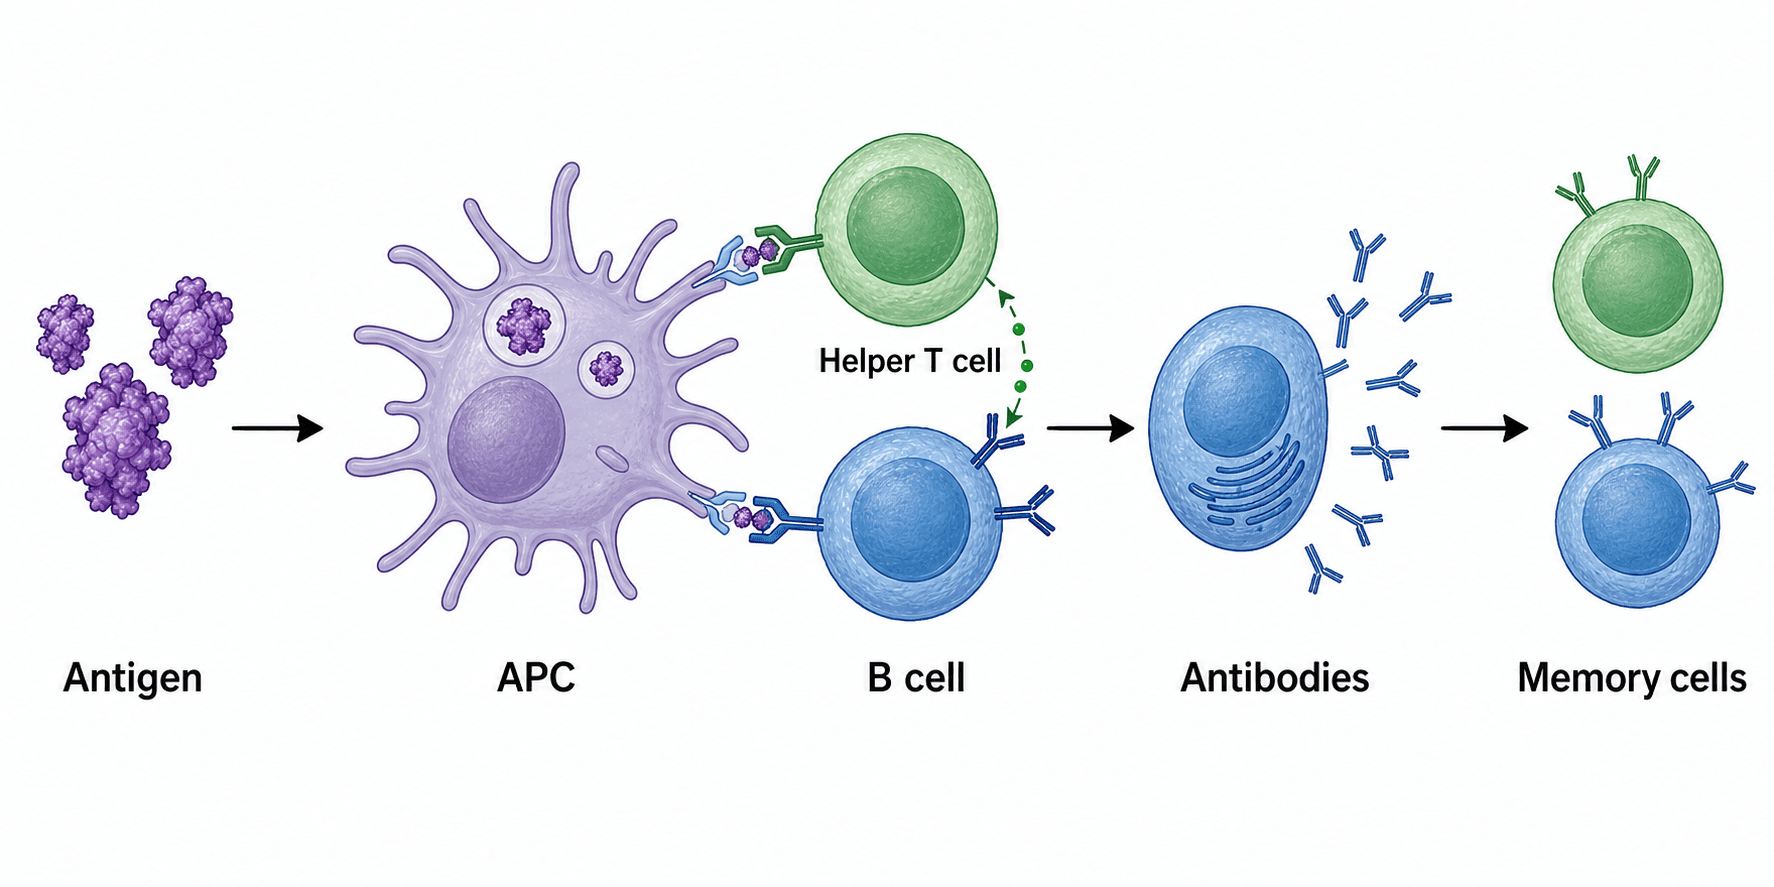
Copy-paste AI prompts for immunology figures — antibody structure, antigen presentation, T-cell activation, PD-1/PD-L1 checkpoints, cytokine signaling, and vaccine mechanisms — plus a reusable prompt template, real examples, and tips for clean, labeled, publication-ready results.

avatar for Davie Chen / SciDraw AI
Davie Chen / SciDraw AI
2026/06/17
24 PCR Diagram Prompts for Publication-Ready Molecular Biology Figures (2026)
AI Prompts

24 PCR Diagram Prompts for Publication-Ready Molecular Biology Figures (2026)

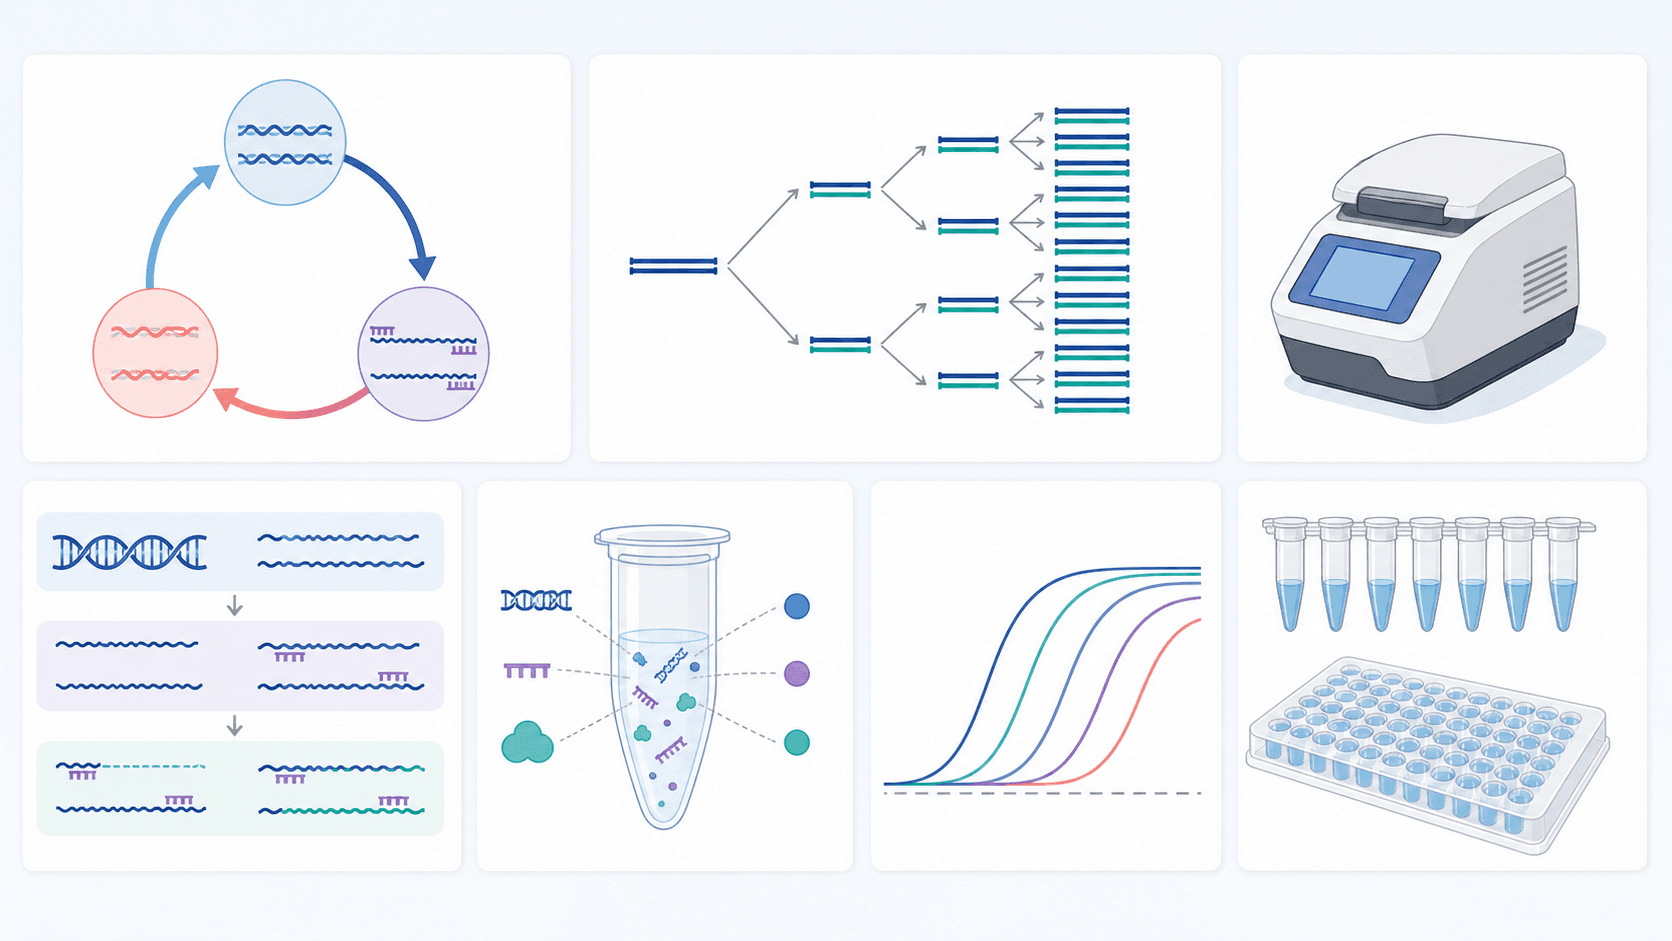
Copy-paste AI prompts for PCR diagrams — the PCR cycle (denaturation, annealing, extension), qPCR amplification curves, RT-PCR, primer binding, and full workflows — plus a reusable prompt template, real examples, and tips for correct temperatures, labels, and publication-ready results.

avatar for Davie Chen / SciDraw AI
Davie Chen / SciDraw AI
2026/06/17
Explore Our Tools
Neural Network Diagram Generator·AI Architecture Diagram Generator·Scientific Diagram Maker·Scientific Figure Maker