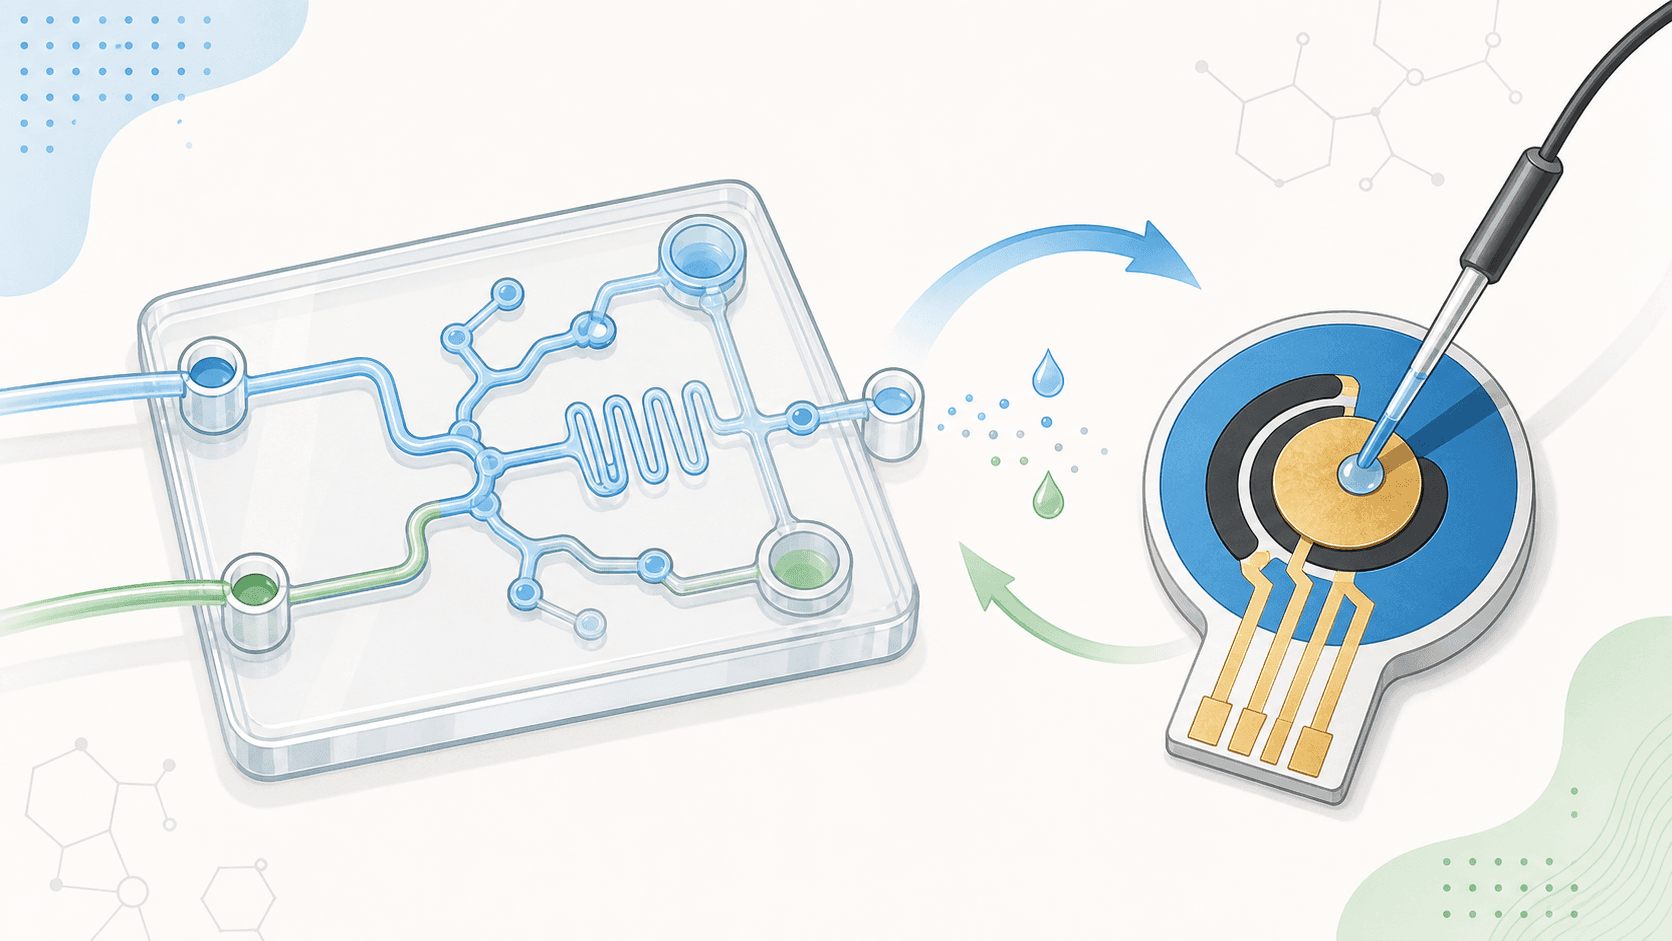
Sensor and microfluidic figures fail for the same reason: the author draws the device but forgets to draw the mechanism. A reader looking at an electrochemical sensor schematic wants to know what binds the analyte, what generates the signal, and where the current is read. A reader looking at a lab-on-a-chip diagram wants to trace a sample from inlet to detection window without guessing. The picture that answers those questions in one glance is the one that gets cited.
This guide gives you a reusable structure for both figure families and a set of copy-paste prompts you can hand to an AI image tool. The prompts stay in English inside the code blocks because that is what current models parse most reliably, but the layout principles apply in any language and any drawing tool.
If you want to skip the blank canvas, describe your device to the Microfluidic Chip Diagram Generator and refine the layout it returns. It will not decide the chemistry for you, but it produces a clean first draft you can correct.
What a sensor schematic has to show
Every sensor figure, regardless of transduction mechanism, has the same four load-bearing parts. Name each one explicitly in your prompt and your reader will never be lost:
- Recognition element — the antibody, aptamer, enzyme, molecularly imprinted layer, or probe that captures the target.
- Transducer surface — the electrode, waveguide, or fluorophore that turns a binding event into a measurable change.
- Signal path — where the electron, photon, or fluorescence signal travels and how it is read out.
- Analyte and matrix — what you are detecting and the sample it sits in (serum, buffer, water).
Leave out anything that does not change how the signal is generated. A figure that shows the recognition-to-signal chain clearly beats one crowded with every reagent in the protocol.
Electrochemical sensor prompt
Generate a clean scientific schematic of an electrochemical biosensor.
Show three electrodes on a chip: working, counter, and reference electrode.
On the working electrode surface, illustrate immobilized capture antibodies
binding a target analyte, followed by a redox reporter generating electron
transfer. Label the electron flow to a potentiostat and a current-vs-voltage
readout. Use a cross-section view, muted lab-journal colors, clear labels,
white background, no photorealism.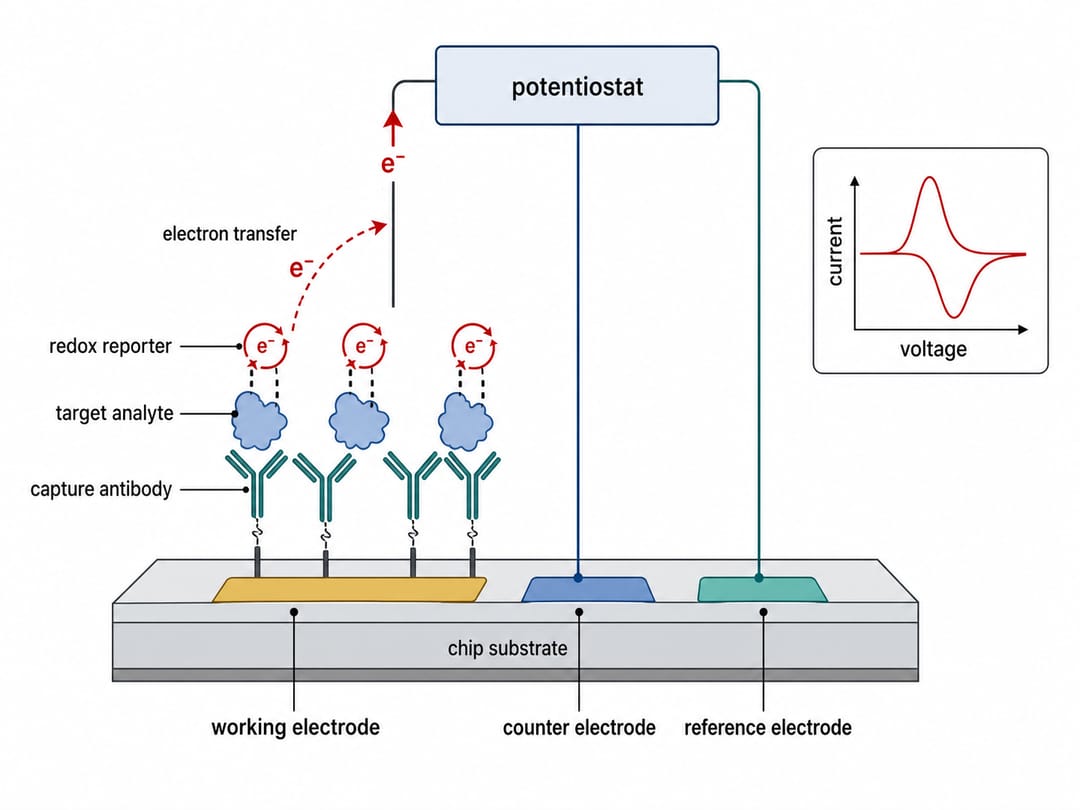 An electrochemical biosensor cross-section — recognition, transduction, and current readout in one view.
Fluorescent probe prompt
Create a schematic of a fluorescent probe detection mechanism.
Show the probe in an "off" (quenched) state on the left, then binding of the
target analyte causing a conformational change, then an "on" (emitting) state
on the right with green fluorescence. Include an excitation arrow (blue) and
an emission arrow (green), and a small inset showing the intensity increase.
Flat vector style, labeled states, left-to-right reading order.
State the reading direction ("left-to-right") and the before/after states explicitly. Fluorescence figures collapse into noise when the off-state and on-state are not visually separated.
What a microfluidic chip diagram has to show
Microfluidic figures are really flow figures. The reader's eye should be able to follow one droplet or one sample plug from entry to detection. Structure the prompt around the path, not the parts:
- Inlets — sample, reagent, buffer, and (for droplet chips) the continuous oil phase.
- Functional units — mixers, serpentine channels, reaction chambers, trap arrays, or droplet-generation junctions.
- Detection zone — the optical window, electrode pair, or imaging region where the readout happens.
- Outlet or waste — where fluid leaves, so the flow direction is unambiguous.
Give real geometry cues. Serpentine mixers, T-junctions, and flow-focusing crosses have recognizable shapes; naming them produces a far more accurate figure than "a microfluidic channel."
Lab-on-a-chip prompt
Draw a top-down lab-on-a-chip microfluidic diagram.
Include: a sample inlet and a reagent inlet on the left, a serpentine mixing
channel, a central reaction chamber, and a detection window on the right with
a small optical-sensor icon, then a waste outlet. Add flow-direction arrows
along the channels. Use a clean engineering-schematic style, thin channel
outlines, soft fill colors, labeled ports, white background.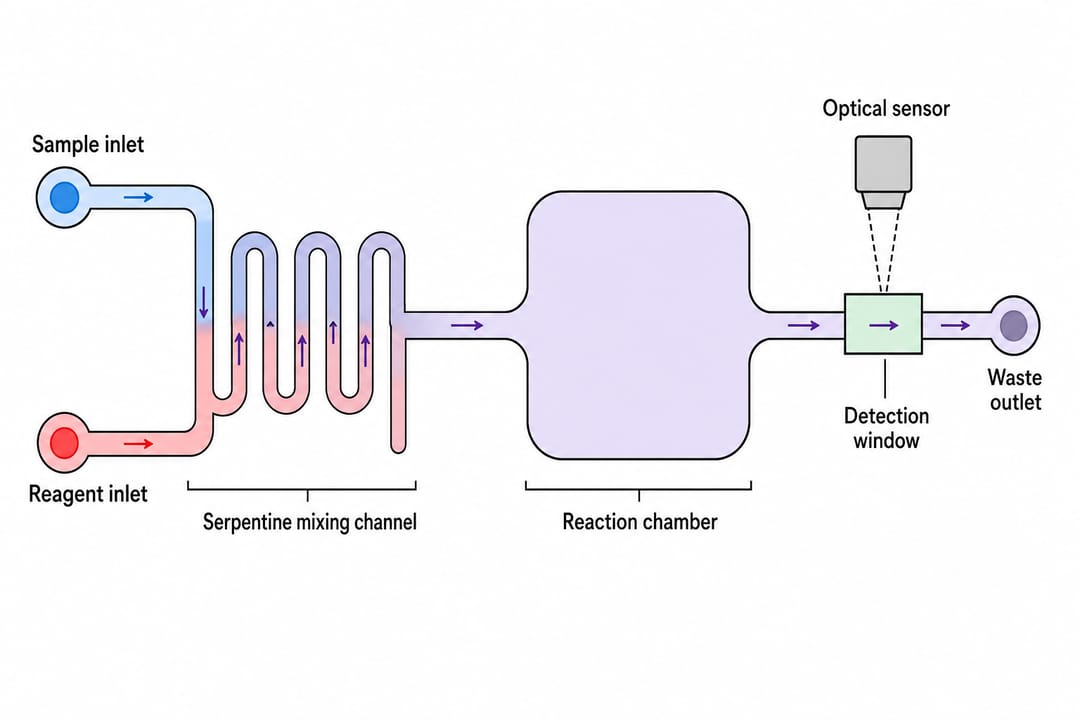 A top-down lab-on-a-chip layout: inlets, serpentine mixer, reaction chamber, detection window, and waste outlet.
Droplet microfluidics prompt
Illustrate a droplet-generation microfluidic chip.
Show a flow-focusing junction where an aqueous sample stream meets two oil
side-channels, producing uniform droplets downstream. Depict a row of evenly
spaced droplets moving toward a detection region where a laser line reads
fluorescence per droplet. Label: aqueous phase, oil phase, flow-focusing
junction, droplet train, detection point. Vector style, top view.
Organ-on-a-chip prompt
Create an organ-on-a-chip schematic in cross-section.
Show two microchannels separated by a thin porous membrane: an upper channel
lined with epithelial cells under media flow, and a lower channel with
endothelial cells and a vascular flow. Indicate cyclic mechanical stretch with
paired side vacuum channels. Label cell layers, membrane, media inlets/outlets,
and stretch direction. Muted biomedical palette, labeled, clean lines.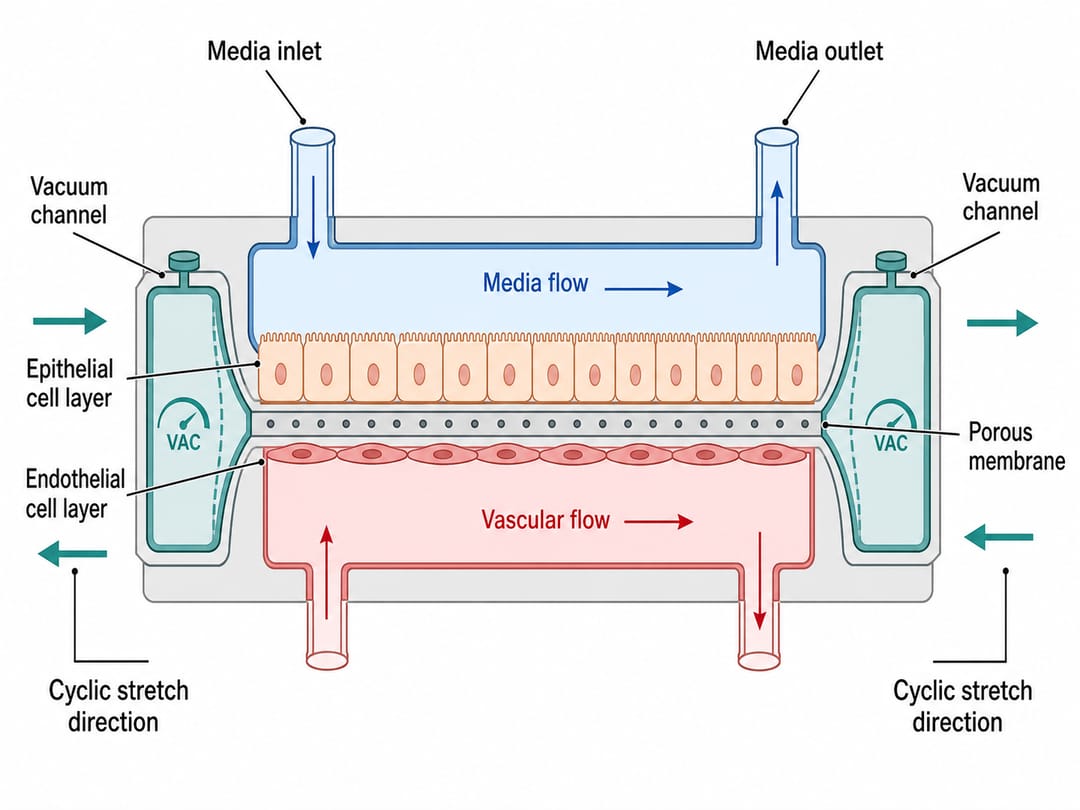 An organ-on-a-chip cross-section — two channels, a porous membrane, and cyclic-stretch vacuum channels.
Layout rules that apply to both
Whether you are drawing a probe mechanism or a chip, the same discipline keeps the figure readable:
- One flow direction. Electrons, photons, or fluid should move one consistent way across the figure — usually left-to-right or inlet-to-outlet.
- Separate mechanism from device. A cross-section reveals a mechanism; a top-down view reveals a layout. Pick the view that matches your message and say so in the prompt.
- Label the transition, not just the parts. The arrow where "quenched" becomes "emitting," or where "sample" becomes "droplet," carries the science. Label it.
- Keep color meaningful. Reserve a color for the analyte and keep it consistent so the eye tracks it through the whole path.
For deeper prompt technique, the rules in 8 AI Prompt Rules for Scientific Figures apply directly here, and if your detection process spans several steps, treat it as a workflow using the approach in the experimental workflow diagram guide.
A quick checklist before you export
- Can a reader trace the signal or the sample from start to finish without the caption?
- Are the recognition element and the transducer visually distinct?
- Is the detection zone clearly marked?
- Do the labels match the terms you use in the Methods section?
- Does color track the analyte consistently?
A figure that passes this list does more than decorate a paper — it lets a reviewer verify your detection logic at a glance, which is exactly what earns trust. For polishing the final composition, the layout and color principles in the complete guide to drawing scientific figures carry over cleanly.
When you are ready to draft, start from a description in the Microfluidic Chip Diagram Generator or, for synthesis and particle-based sensing work, the Nanoparticle Synthesis Diagram Generator, then edit until the mechanism reads true. SciDraw AI gets you past the blank canvas; the scientific accuracy stays in your hands.