25 Immunology Diagram Prompts for Publication-Ready Figures (2026)
Copy-paste AI prompts for immunology figures — antibody structure, antigen presentation, T-cell activation, PD-1/PD-L1 checkpoints, cytokine signaling, and vaccine mechanisms — plus a reusable prompt template, real examples, and tips for clean, labeled, publication-ready results.
Immunology figures are some of the hardest to draw by hand: they pack many cells, receptors, and signaling molecules into one frame, and a single mislabeled arrow can change the meaning. This guide gives you 25 ready-to-use immunology diagram prompts, a reusable prompt template, and real generated examples, so you can create clean, labeled, publication-ready immunology figures with AI in minutes — no design software and no drawing skills required.
By the end of this guide you'll be able to:
Generate an antibody diagram, antigen presentation diagram, T-cell activation diagram, immune checkpoint (PD-1/PD-L1) diagram, cytokine signaling diagram, and vaccine mechanism diagram from a single sentence.
Adapt any prompt to your own study using a simple four-part template.
Avoid the common mistakes that make AI immunology illustrations look wrong.
Paste any prompt into the Immunology Diagram Generator, then refine the result by asking to add, remove, recolor, or relabel elements — or open it in the SciDraw AI editor to keep iterating.
Davie Chen is a researcher at the Faculty of Animation and Intermedia, University of Arts in Poznan, studying generative AI for scientific figure creation, patent illustration, and manuscript drafting. SciDraw AI is one of the research-to-product tools built from this work.
Thousands of researchers use SciDraw AI to make publication-ready figures for papers, grants, and journal submissions — in minutes, with no design skills.
Template: "Draw [subject] showing [interactions]. Label [cells/receptors/molecules]. Use a clean flat-vector style with activation arrows and inhibition bars."
Keep this template handy — every prompt below follows it, and you can swap in your own subject.
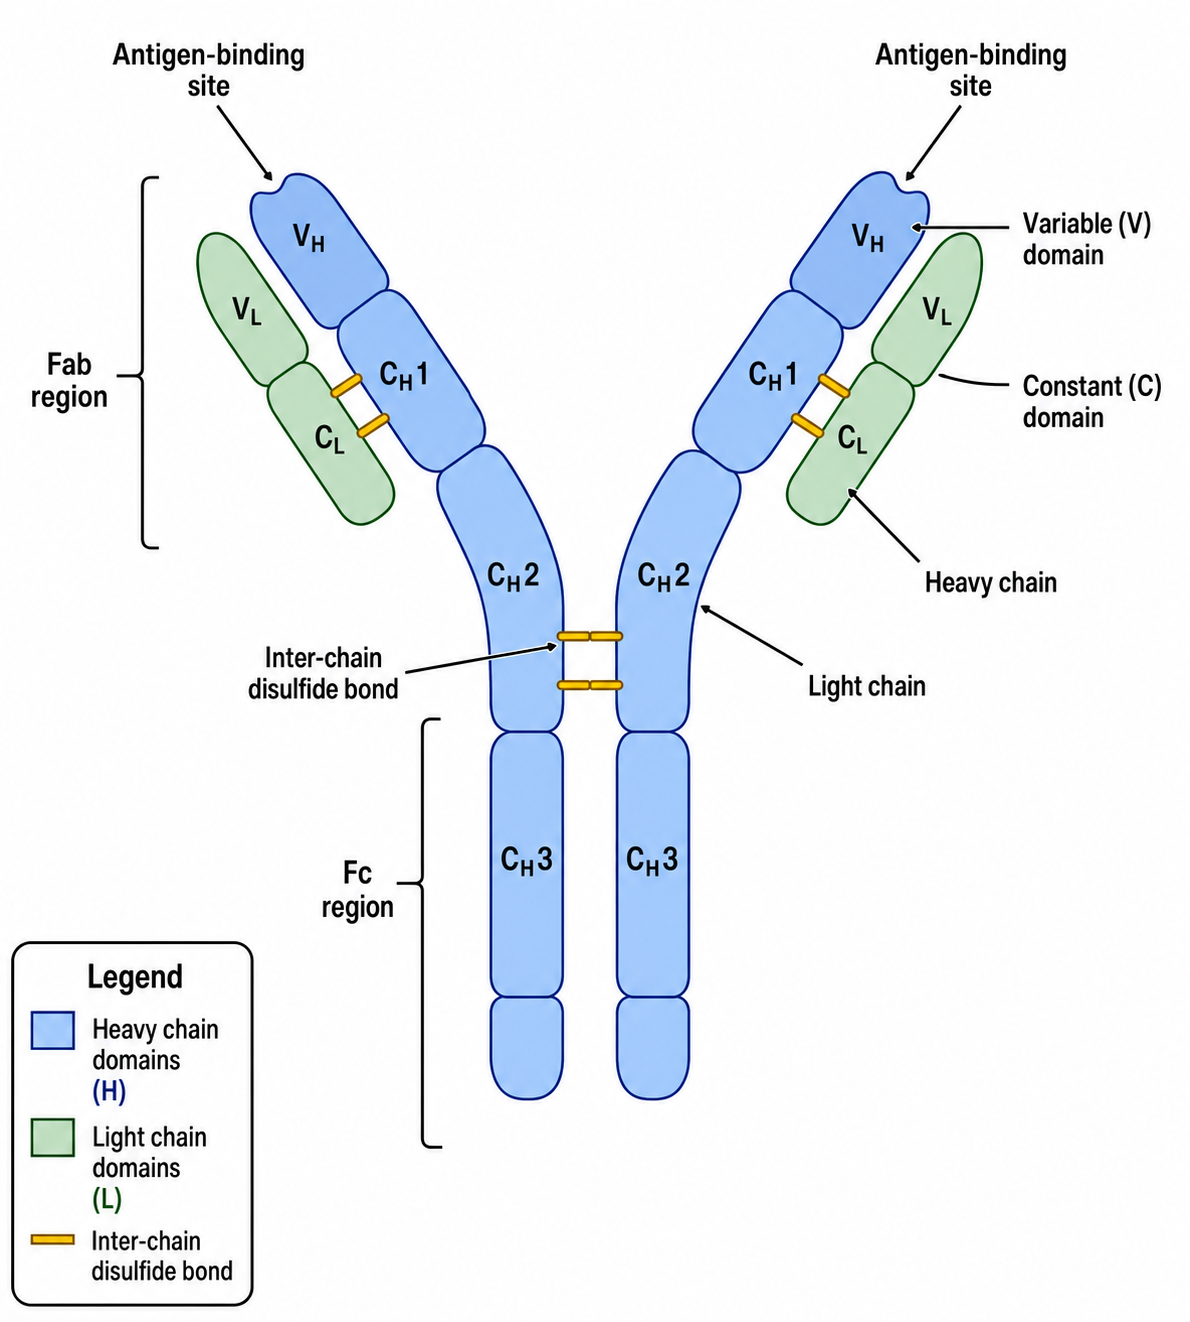
Antibody figures are the most requested immunology illustration — and the easiest to get wrong, because the chains, regions, and domains must be labeled precisely. Start with the structure, then branch into isotypes and functions.
Draw the structure of an IgG antibody as a labeled Y-shaped molecule: two heavy chains and two light chains, the two Fab regions and the Fc region, the antigen-binding sites, the variable (V) and constant (C) domains, and the inter-chain disulfide bonds.
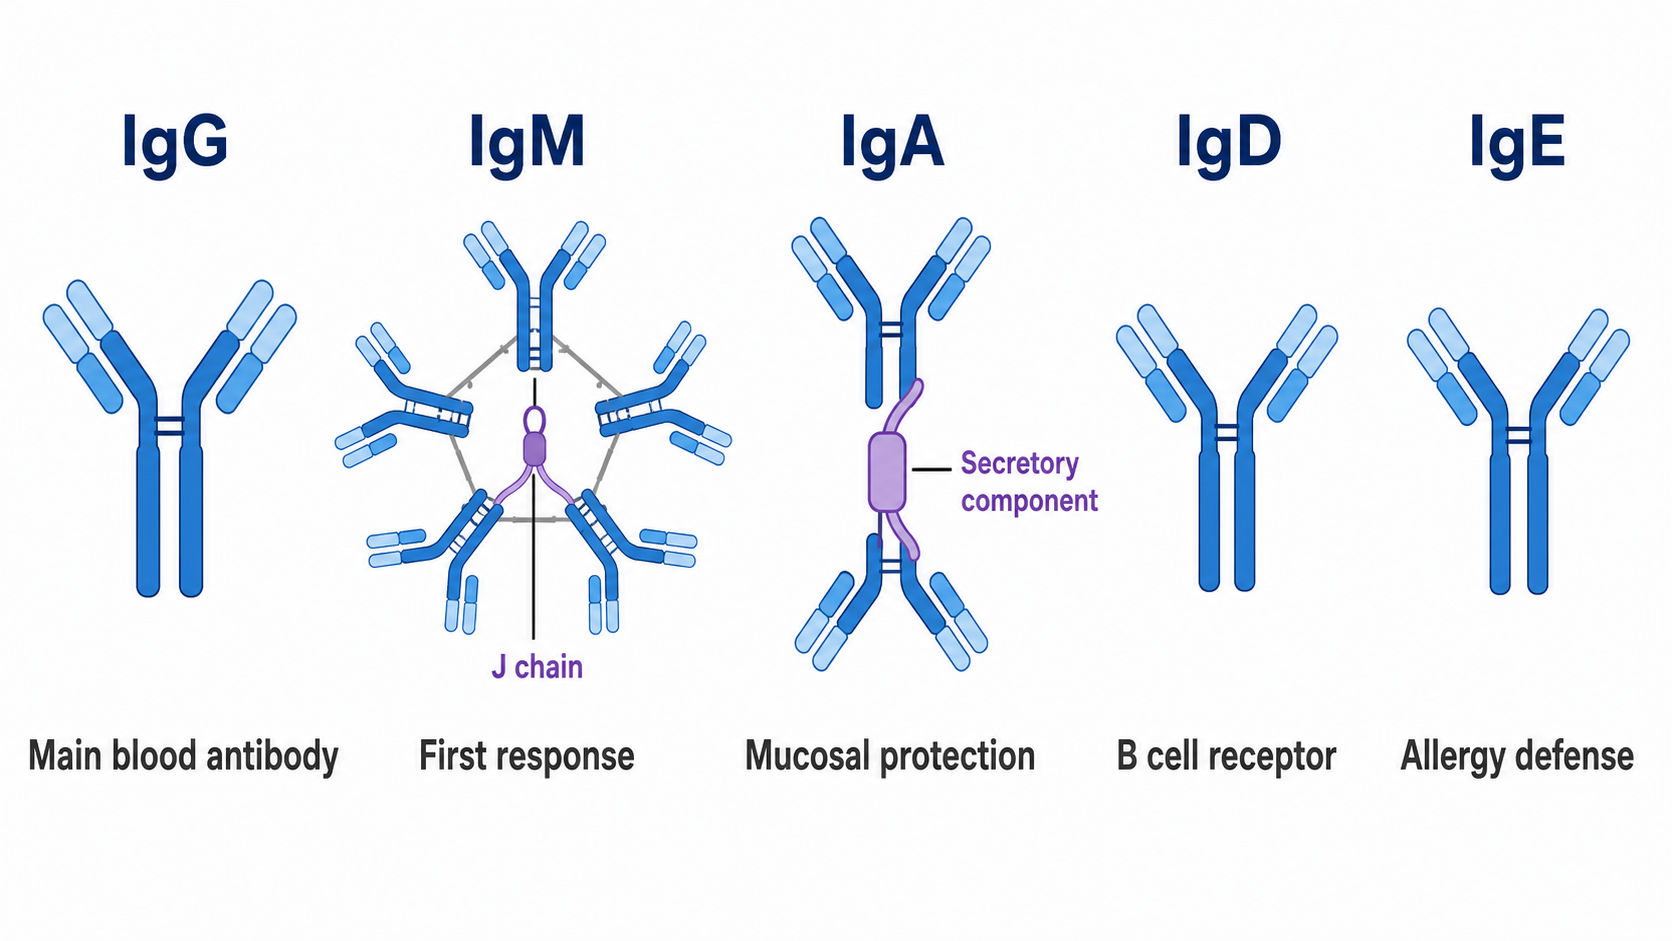
Compare the five antibody isotypes (IgG, IgM, IgA, IgD, IgE) side by side, showing monomer, dimer, and pentamer forms with the J chain where relevant, and label a typical function under each.
Illustrate antibody–antigen binding specificity: one antibody's variable region locking onto a matching epitope, with a non-matching antigen shown as not binding.
Show antibody effector functions — neutralization, opsonization, and complement activation — each in its own panel with labeled cells and targets.
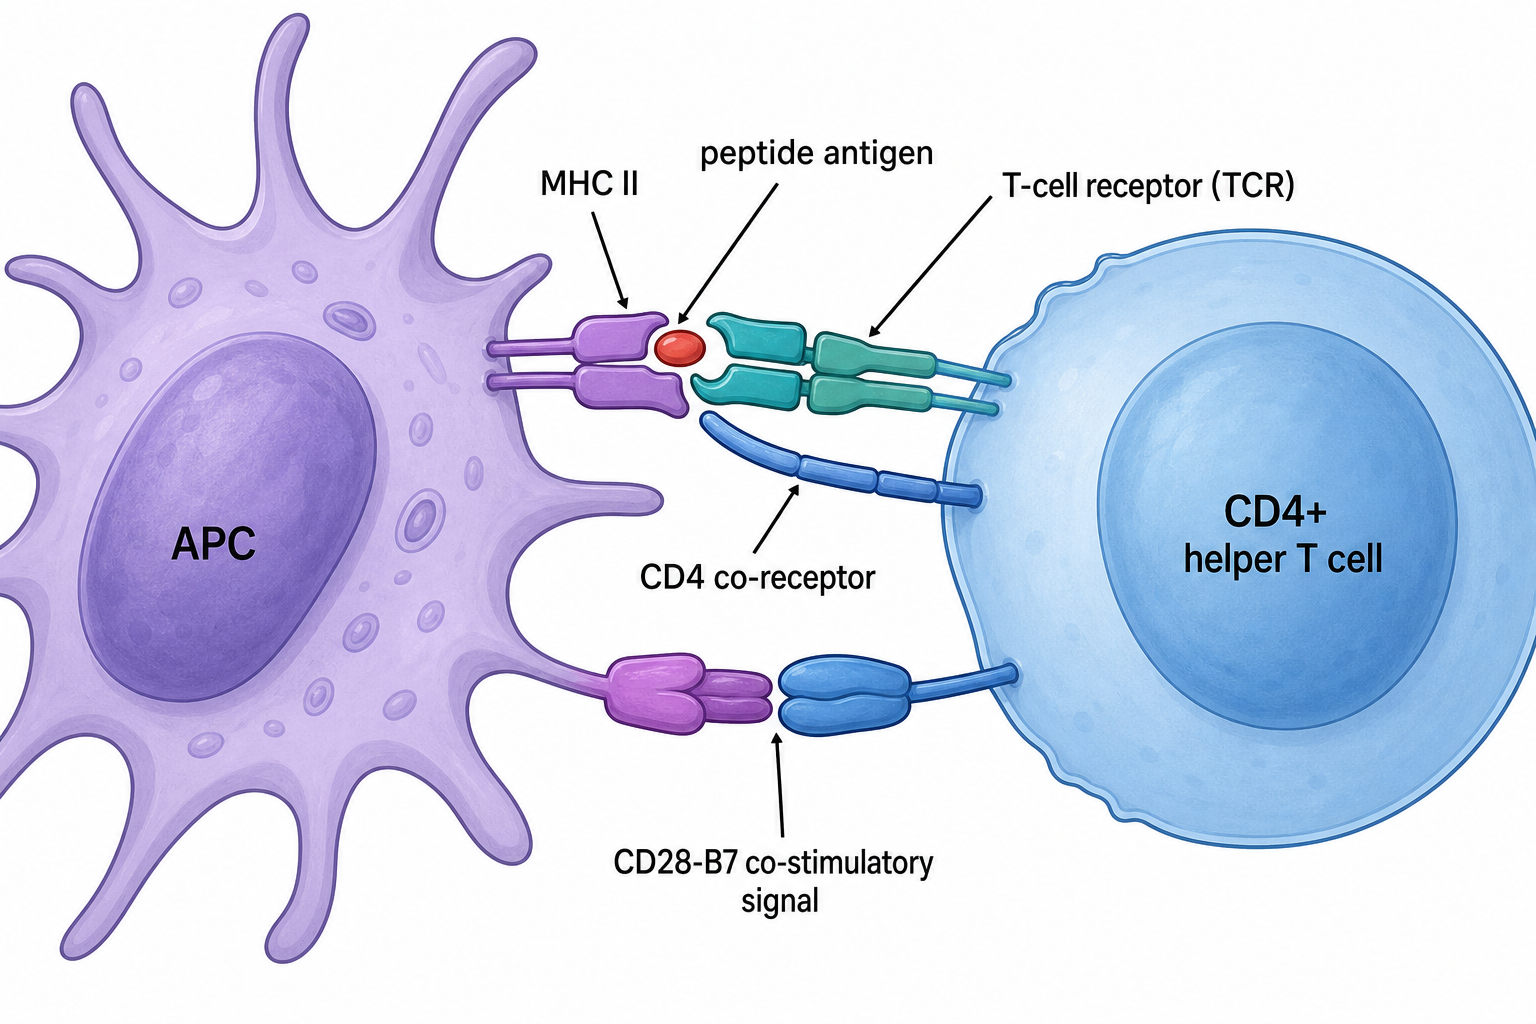
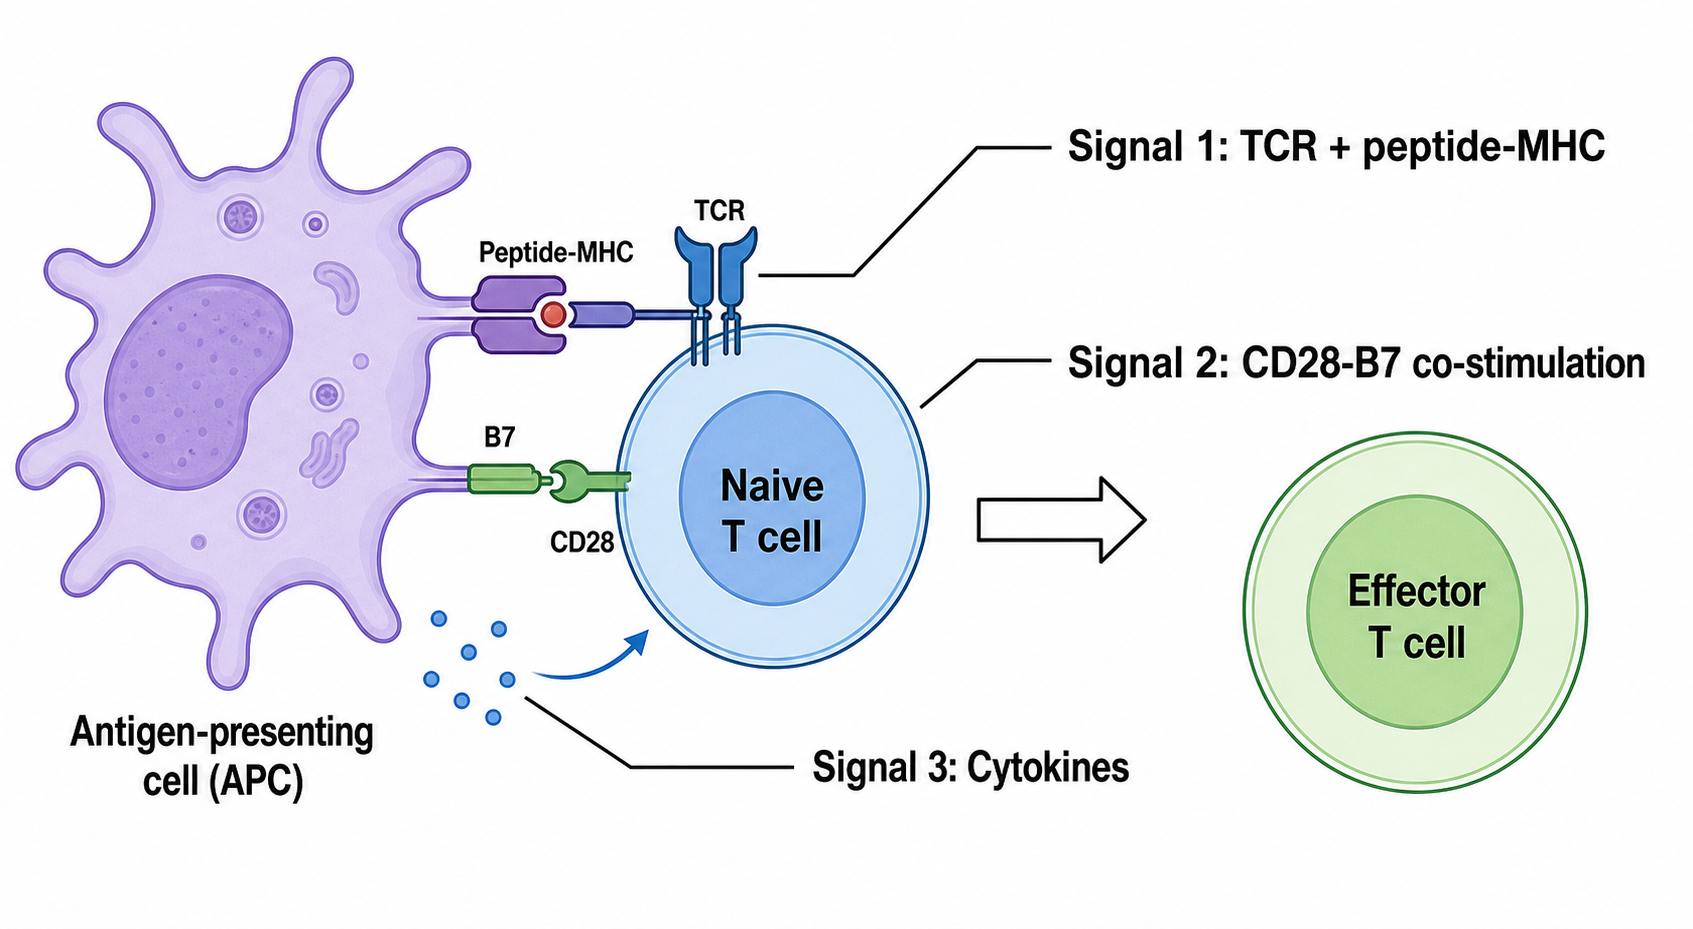
Antigen presentation and T-cell activation diagrams are core to almost every immunology paper and lecture. These prompts cover the immunological synapse, the three-signal model, and helper T-cell differentiation.
Antigen presentation: a dendritic cell presenting a processed peptide on an MHC class II molecule to a CD4+ helper T cell; label the APC, MHC II, peptide, TCR, CD4 co-receptor, and the CD28-B7 co-stimulatory signal.
Contrast MHC class I vs class II pathways: endogenous peptides via MHC I to CD8+ T cells, and exogenous peptides via MHC II to CD4+ T cells, in two parallel lanes.
T-cell activation through three signals: Signal 1 (TCR–peptide-MHC), Signal 2 (CD28–B7 co-stimulation), and Signal 3 (cytokines), with the naive T cell differentiating into an effector T cell.
CD8+ cytotoxic T cell killing a target cell: recognition via TCR–MHC I, release of perforin and granzymes, and induction of apoptosis, with each step labeled.
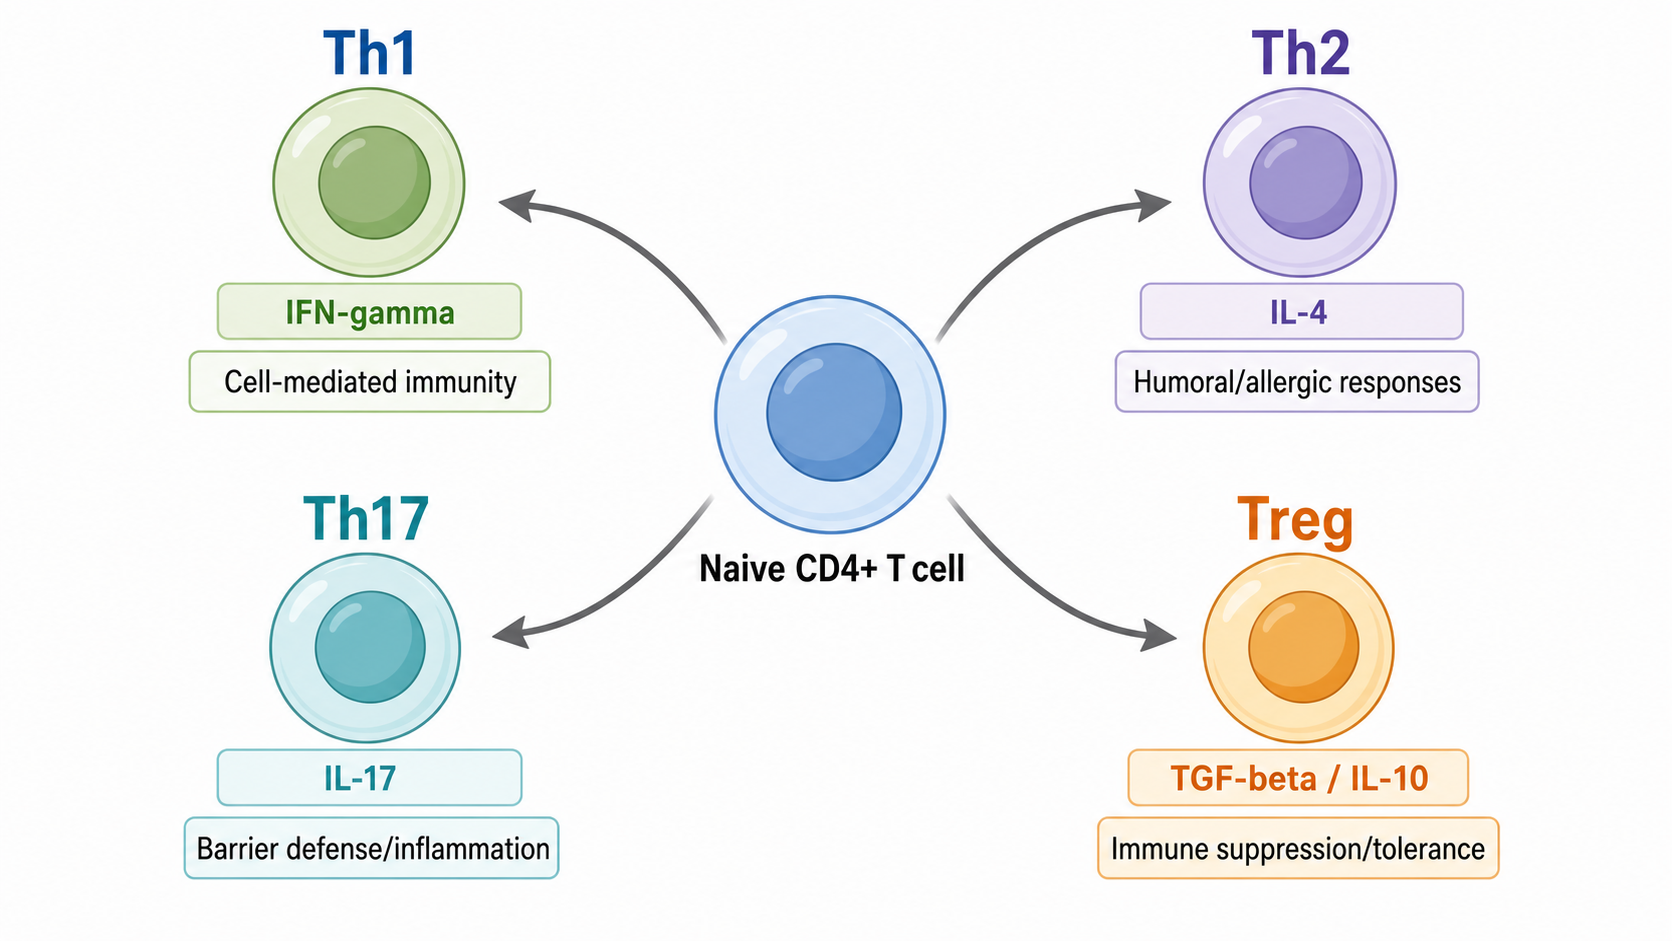
Helper T-cell differentiation: a naive CD4+ T cell branching into Th1, Th2, Th17, and Treg subsets, with the signature cytokine driving each branch labeled.
Immune checkpoint diagrams — especially PD-1/PD-L1 and CTLA-4 — are among the most searched immunology figures thanks to cancer immunotherapy. Show both the "brake" and the blocking antibody that releases it.
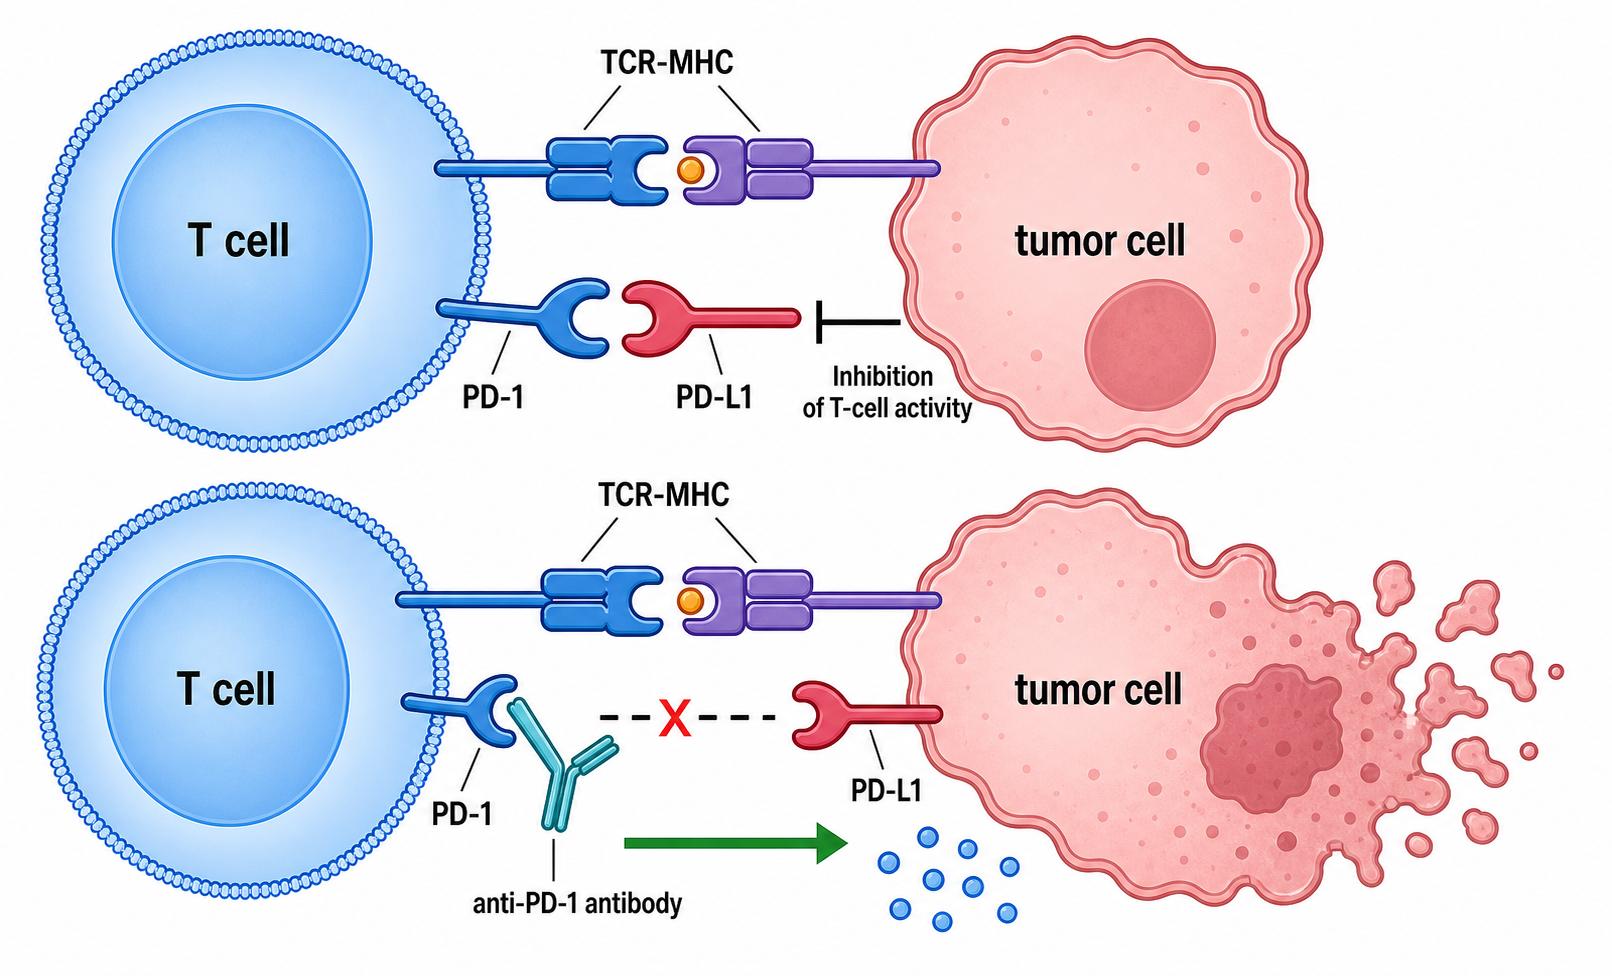
The PD-1/PD-L1 immune checkpoint and its blockade: PD-1 on a T cell binding PD-L1 on a tumor cell to inhibit T-cell activity (inhibition bar), and an anti-PD-1 antibody blocking the interaction to restore tumor killing.
CTLA-4 checkpoint: CTLA-4 outcompeting CD28 for B7 on an APC, dampening T-cell activation, and an anti-CTLA-4 antibody reversing the brake.
CAR T-cell therapy overview: engineering a patient T cell with a chimeric antigen receptor, recognition of a tumor antigen, and tumor-cell killing, as a left-to-right flow.
The cancer-immunity cycle: antigen release, presentation, T-cell priming, trafficking, infiltration, recognition, and killing, drawn as a circular pathway.
Innate immunity and cytokine signaling diagrams explain the first line of defense. These prompts cover pattern recognition, the cytokine cascade, complement, and inflammation.
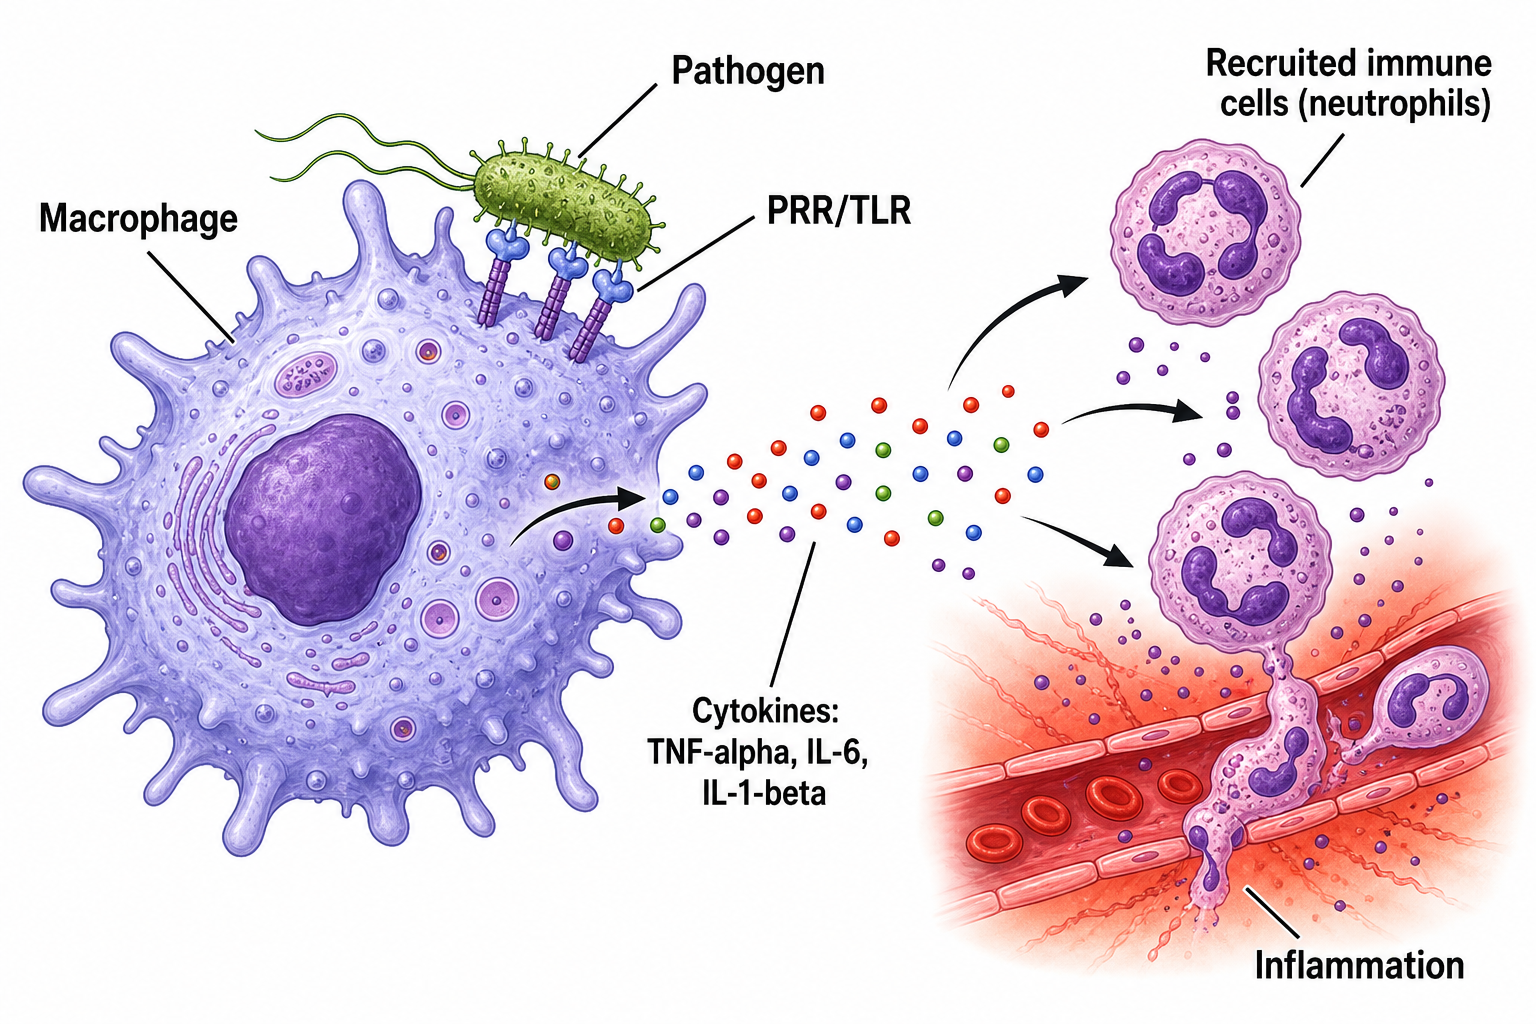
Innate immune response: a macrophage recognizing a pathogen via TLRs and releasing pro-inflammatory cytokines (TNF-α, IL-6, IL-1β) that recruit neutrophils and drive inflammation.
The complement cascade: classical, lectin, and alternative pathways converging on C3, leading to the membrane attack complex, shown as a converging flow.
Phagocytosis step by step: recognition, engulfment, phagosome formation, fusion with a lysosome, and pathogen degradation.
The inflammatory response at a tissue site: vasodilation, increased permeability, immune-cell recruitment, and the cardinal signs, with labeled mediators.
NLRP3 inflammasome activation leading to caspase-1 activation and IL-1β maturation.
Vaccine mechanism diagrams connect innate and adaptive immunity and are perfect for teaching and science communication.
How a vaccine works, left to right: antigen uptake by an APC, activation of helper T and B cells, antibody production, and formation of memory B and T cells for long-term immunity.
Primary vs secondary immune response: an antibody-titer-over-time chart contrasting the slow primary response with the faster, stronger secondary response after re-exposure.
mRNA vaccine mechanism: lipid nanoparticle delivery, mRNA translation into spike antigen, presentation, and the resulting antibody and T-cell response.
Herd immunity: a population diagram contrasting low vs high vaccination coverage and how transmission chains are interrupted.
B-cell affinity maturation and class switching in the germinal center.
Active vs passive immunity compared in two labeled panels.
The structure and function of a lymph node as an immune-response hub.
Unlabeled or wrongly labeled receptors. Fix: list exact names in the prompt ("label PD-1, PD-L1, TCR, MHC I"). Re-prompt with "correct the label 'PDL1' to 'PD-L1'."
Activation vs inhibition unclear. Fix: explicitly request "activation arrows and flat-end inhibition bars."
Overcrowded figure. Fix: ask to "simplify to the main steps" or split into panels.
Garbled text (typical of generic image AI). Fix: SciDraw AI renders clean sans-serif labels; re-prompt the exact wording if needed.
Wrong cell shapes/colors. Fix: name the cells ("dendritic cell", "macrophage") and ask for a consistent color code.
What is the best AI tool to draw immunology diagrams?
SciDraw AI's Immunology Diagram Generator is built for publication-ready immunology figures — antibodies, antigen presentation, T-cell activation, immune checkpoints, cytokines, and vaccines — with clean, accurate labels and editable export.
How do I make an antibody diagram with AI?
Describe the structure and the parts you want labeled (heavy/light chains, Fab/Fc, antigen-binding sites, domains, disulfide bonds), then generate. Use prompt #1 above as a starting point.
Can I create immunology figures for free?
Yes — you can start generating immunology diagrams for free, then upgrade for more credits and editable SVG/PPTX export.
Is this a good BioRender alternative for immunology?
If you want immunology figures from a text description (instead of dragging icons), an AI generator is a fast, low-cost alternative for antibody, T-cell, checkpoint, and vaccine diagrams.
Are the figures accurate enough for publication?
They are designed for publication-ready output, but always review the biology for your specific system and correct any labels before submitting.
Pick any prompt above, paste it into the Immunology Diagram Generator, and refine it in the SciDraw AI editor until it matches your study. From antibody structures to vaccine mechanisms, your next immunology figure is one sentence away.
")


")
")