LogoLogoSciDraw AI
  • Start Creating
  • Tools
  • Blog
  • Pricing
  • Education Discount
LogoLogoSciDraw AI

AI-powered scientific figure platform for researchers, students, educators, and science communicators. Create publication- and classroom-ready figures, graphical abstracts, TOC graphics, posters, and teaching illustrations in minutes. No design skills required.

EmailYouTubeXGitHubLinkedInInstagramStripe ClimateStripe Climate Contribution
Tools
  • AI Drawing
  • Graphical Abstract Maker
  • Scientific Figure Maker
  • Image Converter
  • Vectorize Image
  • All Tools
Popular tools
  • Scientific Diagram Maker
  • Scientific Poster Maker
  • Research Poster Template
  • Plant Cell Diagram
  • Lewis Dot Structure Generator
  • Molecular Orbital Diagram Generator
  • PRISMA Flow Diagram Generator
  • Conceptual Framework Maker
Use Cases
  • For PhD Students
  • For Educators
  • For Journal Submission
  • BioRender Alternative
Resources
  • Blog
  • Gallery
  • Published references
  • Media Kit
  • Developers
Company
  • About
  • Pricing
  • Affiliate
  • Institutional invoicing
  • Privacy Policy
  • Terms of Service
© 2026 SciDraw AI All Rights Reserved.
How to Make a Western Blot Figure with AI: Step-by-Step Guide (2026)
2026/06/18

How to Make a Western Blot Figure with AI: Step-by-Step Guide (2026)

Learn how to make a western blot figure with AI step by step — build the SDS-PAGE-to-detection workflow schematic, lay out labeled bands and loading controls, add a kDa ladder and densitometry, and export a publication-ready immunoblot diagram. Template, examples, and fixes for common mistakes.

A western blot figure has two jobs: it explains the method (the workflow from gel to detection) and it presents results (lanes, bands, loading controls, and quantification). Drawing either one by hand is tedious, and a single mislabeled lane or a missing kDa marker can confuse a reviewer. This guide shows you how to make a western blot figure with AI step by step — building a clean workflow schematic, laying out labeled result bands, adding a molecular-weight ladder and densitometry, and exporting a publication-ready immunoblot diagram — no design software and no drawing skills required.

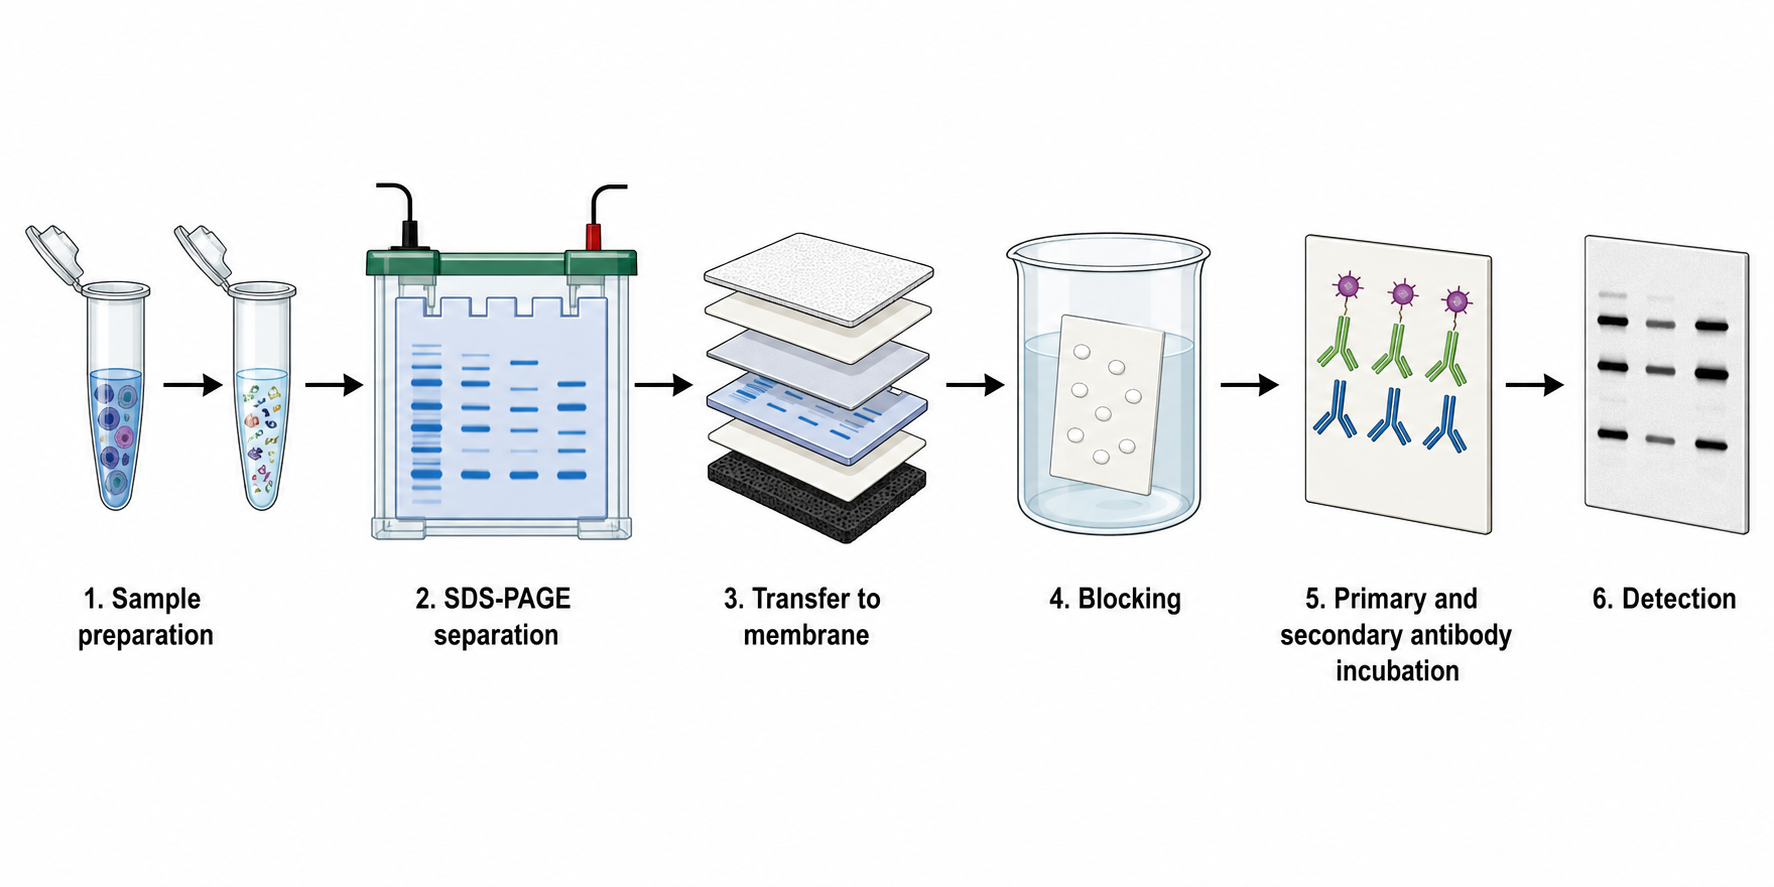
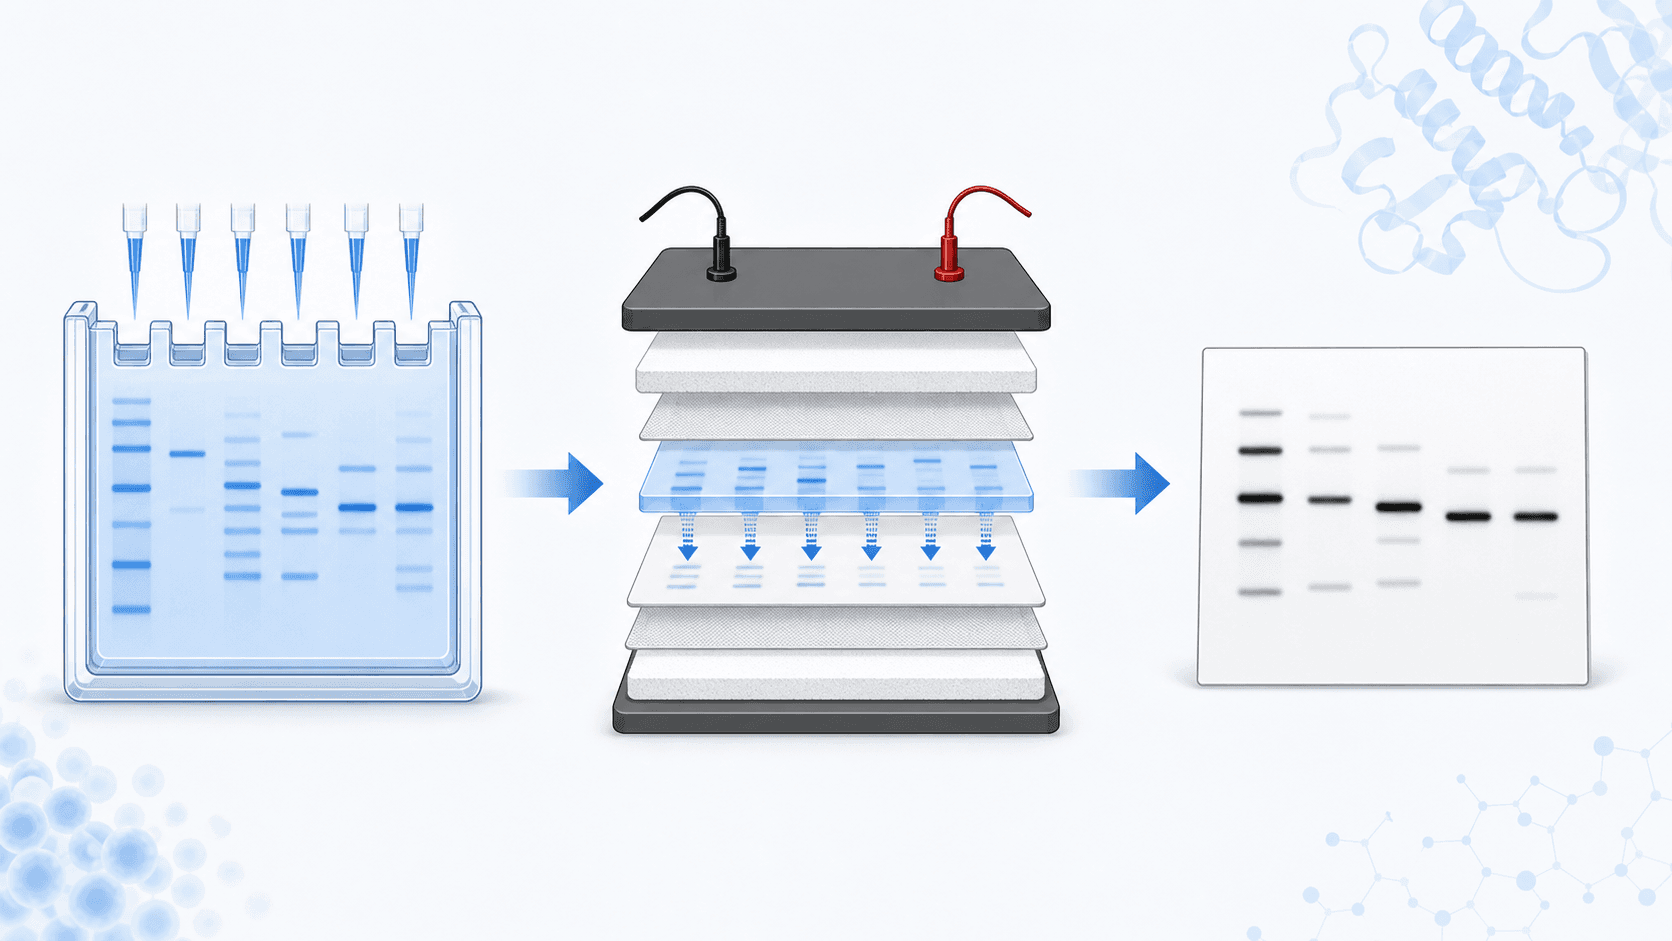
Western blot workflow diagram showing SDS-PAGE separation, transfer to membrane, blocking, antibody incubation, and detection steps

A note up front: use this guide to make schematic illustrations — teaching figures, workflow diagrams, and figure mock-ups. These AI-generated blots do not replace your real experimental blot images; always present your own captured data and densitometry as actual results.

By the end of this guide you'll be able to:

  • Generate a western blot workflow diagram from SDS-PAGE separation through transfer, blocking, antibody incubation, and detection.
  • Lay out a western blot result figure with labeled lanes, bands, and a kDa ladder.
  • Add a loading control and densitometry quantification chart beneath the blot.
  • Edit and export your figure to editable SVG or PPTX for a paper, poster, or slide deck.

Every step below is done by typing an instruction into the Western Blot Figure Generator, then refining the result in the SciDraw AI editor — the AI-native workspace where your image is the canvas and language is the tool.

Step 1: Describe the blot clearly

The quality of your figure depends on how precisely you describe it. A strong western blot prompt has four parts:

All Posts

Author

avatar for Davie Chen / SciDraw AI
Davie Chen / SciDraw AI

Researcher

Davie Chen is a researcher at the Faculty of Animation and Intermedia, University of Arts in Poznan, studying generative AI for scientific figure creation, patent illustration, and manuscript drafting. SciDraw AI is one of the research-to-product tools built from this work.

Author profile

Categories

Step 1: Describe the blot clearlyStep 2: Generate the western blot workflow schematicZoom into antibody detectionStep 3: Lay out a result figure with labeled bandsAdd a loading control and densitometryStep 4: Combine method and results into one figureCommon mistakes (and how to fix them)Export and use your western blot figureFrequently asked questionsStart creating

More Posts

Create your scientific figures with AI

Thousands of researchers use SciDraw AI to make publication-ready figures for papers, grants, and journal submissions — in minutes, with no design skills.

Start for free
  • Subject — workflow schematic or result panel.
  • Elements — steps, lanes, bands, loading control, ladder, quantification.
  • Labels — every protein name, lane condition, kDa value, and step you want named.
  • Style & layout — "flat vector, publication-ready, left-to-right flow."
  • Template: "Draw [workflow or result panel] showing [steps or lanes]. Label [proteins, lanes, kDa markers, controls]. Use a clean flat-vector style with a left-to-right flow."

    Keep this handy — every example below follows it, and you can swap in your own targets and conditions.

    Step 2: Generate the western blot workflow schematic

    The workflow diagram is the most requested schematic — it walks a reader from gel to signal. Paste this into the Western Blot Figure Generator:

    "Draw a western blot workflow as a labeled left-to-right flow with five steps: SDS-PAGE gel separation of proteins by size, transfer of proteins to a membrane, blocking the membrane, incubation with primary then secondary antibodies, and detection of the signal. Label each step and show the membrane and antibodies. Use a clean flat-vector style."

    This produces the workflow schematic above — ideal for a methods figure or a lecture slide. From here you can zoom into a single step or branch into the results panel.

    Zoom into antibody detection

    "Illustrate antibody detection on a western blot membrane: a primary antibody binding the target protein, an HRP-conjugated secondary antibody binding the primary, and chemiluminescent signal being produced. Label the membrane, target protein band, primary antibody, secondary antibody, and HRP."

    Step 3: Lay out a result figure with labeled bands

    Result figures are where reviewers look first. Use this as a schematic mock-up — the layout you'd build before dropping in your real captured data:

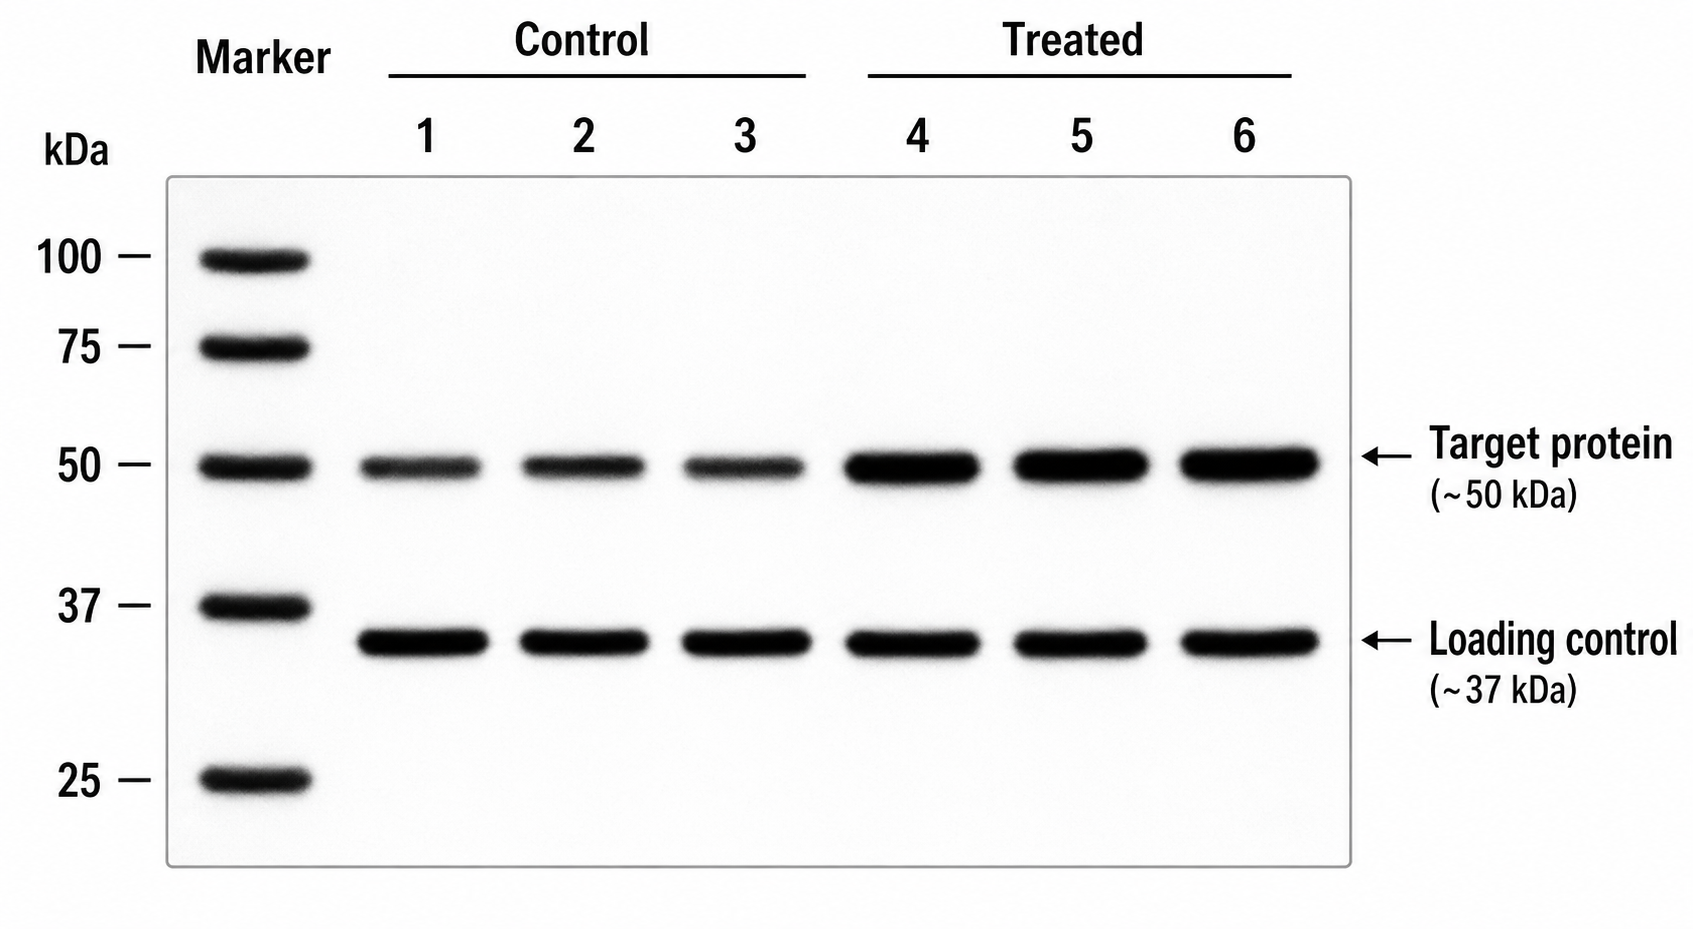
    Western blot result figure showing labeled protein bands across lanes with a loading control and kDa molecular weight ladder

    "Draw a schematic western blot result panel: three lanes (Control, Treatment 1, Treatment 2) showing a target protein band that increases across lanes, with a loading control (GAPDH) band of equal intensity below. Add a molecular-weight ladder on the left with kDa values labeled. Use a clean flat-vector style — this is a schematic mock-up, not real data."

    Add a loading control and densitometry

    A result figure needs a normalization story:

    • "Add a GAPDH loading control band below the target protein, equal across all lanes."
    • "Add a bar chart beneath the blot showing relative band intensity (densitometry) for each lane, normalized to the loading control. Label the y-axis 'Relative expression.'"
    • "Add the molecular weight in kDa next to the target band and the loading control."

    Because the editor changes the existing image in place, every other element stays put. For precise wording, see how to edit text and labels in an AI figure.

    Step 4: Combine method and results into one figure

    Many papers show the workflow and a result panel together:

    "Combine the western blot workflow schematic and the result panel into a two-panel figure labeled A and B, keeping the layout clean."

    You can also generate a western blot vs ELISA comparison or a troubleshooting figure the same way — describe it, name the labels, and refine.

    Common mistakes (and how to fix them)

    • Treating a schematic as real data. Fix: remember these are illustrations — use them for workflow diagrams and figure mock-ups, and present your own experimental blots and densitometry for actual results.
    • Missing kDa ladder. Fix: ask to "add a molecular-weight ladder on the left with kDa values labeled."
    • No loading control. Fix: re-prompt with "add a GAPDH loading control band of equal intensity below the target."
    • Lanes mislabeled or unlabeled. Fix: name each lane condition in the prompt ("Control, Treatment 1, Treatment 2").
    • Garbled text (typical of generic image AI). Fix: SciDraw AI renders clean sans-serif labels; re-prompt the exact wording if a label looks off.

    Export and use your western blot figure

    Once the diagram reads exactly right, export it to editable SVG or PowerPoint (PPTX), or download a high-resolution image for your manuscript, slides, or poster. SVG and PPTX let collaborators adjust a lane label or kDa value later, while the AI editor handles the fast fixes now.

    Want more ready-made wording to drop in? See our western blot figure prompts collection for copy-paste prompts covering workflows, result panels, antibody detection, and densitometry. Need to fix a label or translate it? See how to edit text and labels in an AI figure.

    Frequently asked questions

    How do I make a western blot figure with AI? Open the Western Blot Figure Generator, describe the workflow or result panel, name every lane, band, and label, and generate. Then refine the result in the SciDraw AI editor — add a loading control, kDa ladder, or densitometry chart.

    Are these AI western blot figures real data or schematics? They are schematic illustrations for teaching, workflow diagrams, and figure mock-ups — not a replacement for your experimental blot images. Always present your own captured blots and densitometry as actual results.

    How do I add a loading control to my western blot diagram? Tell the editor to "add a GAPDH (or β-actin) loading control band of equal intensity below the target protein, across all lanes." You can add densitometry below it the same way.

    Can I make a western blot figure for free? Yes — you can start generating western blot schematics for free, then upgrade for more credits and editable SVG/PPTX export.

    Can I show molecular weights on the blot? Yes. Ask the AI to "add a molecular-weight ladder on the left with kDa values labeled," and add the kDa next to each band of interest.

    Start creating

    Open the Western Blot Figure Generator, paste the workflow prompt above, and refine it in the SciDraw AI editor until it matches your study. From a clean method schematic to a labeled result mock-up, your next western blot figure is one sentence away — just remember to present your own data for actual results.

    Tutorials
    24 Western Blot Figure Prompts for Publication-Ready Schematics (2026)
    AI Prompts

    24 Western Blot Figure Prompts for Publication-Ready Schematics (2026)

    Copy-paste AI prompts for western blot figures — the SDS-PAGE-to-detection workflow, result bands, loading controls, antibody detection, and densitometry quantification — plus a reusable prompt template, real examples, and tips for labeled lanes, kDa markers, and clean, publication-ready immunoblot diagrams.

    avatar for Davie Chen / SciDraw AI
    Davie Chen / SciDraw AI
    2026/06/17
    How to Add an Element, Label, or Arrow to a Figure with AI (2026)
    Tutorials

    How to Add an Element, Label, or Arrow to a Figure with AI (2026)

    Add an element, label, or arrow to a scientific figure without redrawing it — drop in a new organelle, annotation, leader line, or directional arrow just by telling the AI what to add and where. Copy-paste prompts, a reusable template, and an AI figure editor that does the work.

    avatar for Davie Chen / SciDraw AI
    Davie Chen / SciDraw AI
    2026/06/18
    How to Draw a Scientific Figure for Your Paper: A 5-Step AI Workflow from Abstract to Submission
    Tutorials

    How to Draw a Scientific Figure for Your Paper: A 5-Step AI Workflow from Abstract to Submission

    A reusable 5-step workflow for paper figures: define the central message, split into panels, write a structured prompt, then check against submission standards. Includes scientific-figure prompt templates and FAQ.

    avatar for Davie Chen / SciDraw AI
    Davie Chen / SciDraw AI
    2026/06/18
    Explore Our Tools
    Western Blot Figure Generator·Scientific Figure Maker·Graphical Abstract Maker·AI Scientific Illustration