Western-Blot-Abbildungsgenerator
Aus einem Satz wird eine beschriftete Western-Blot-Abbildung
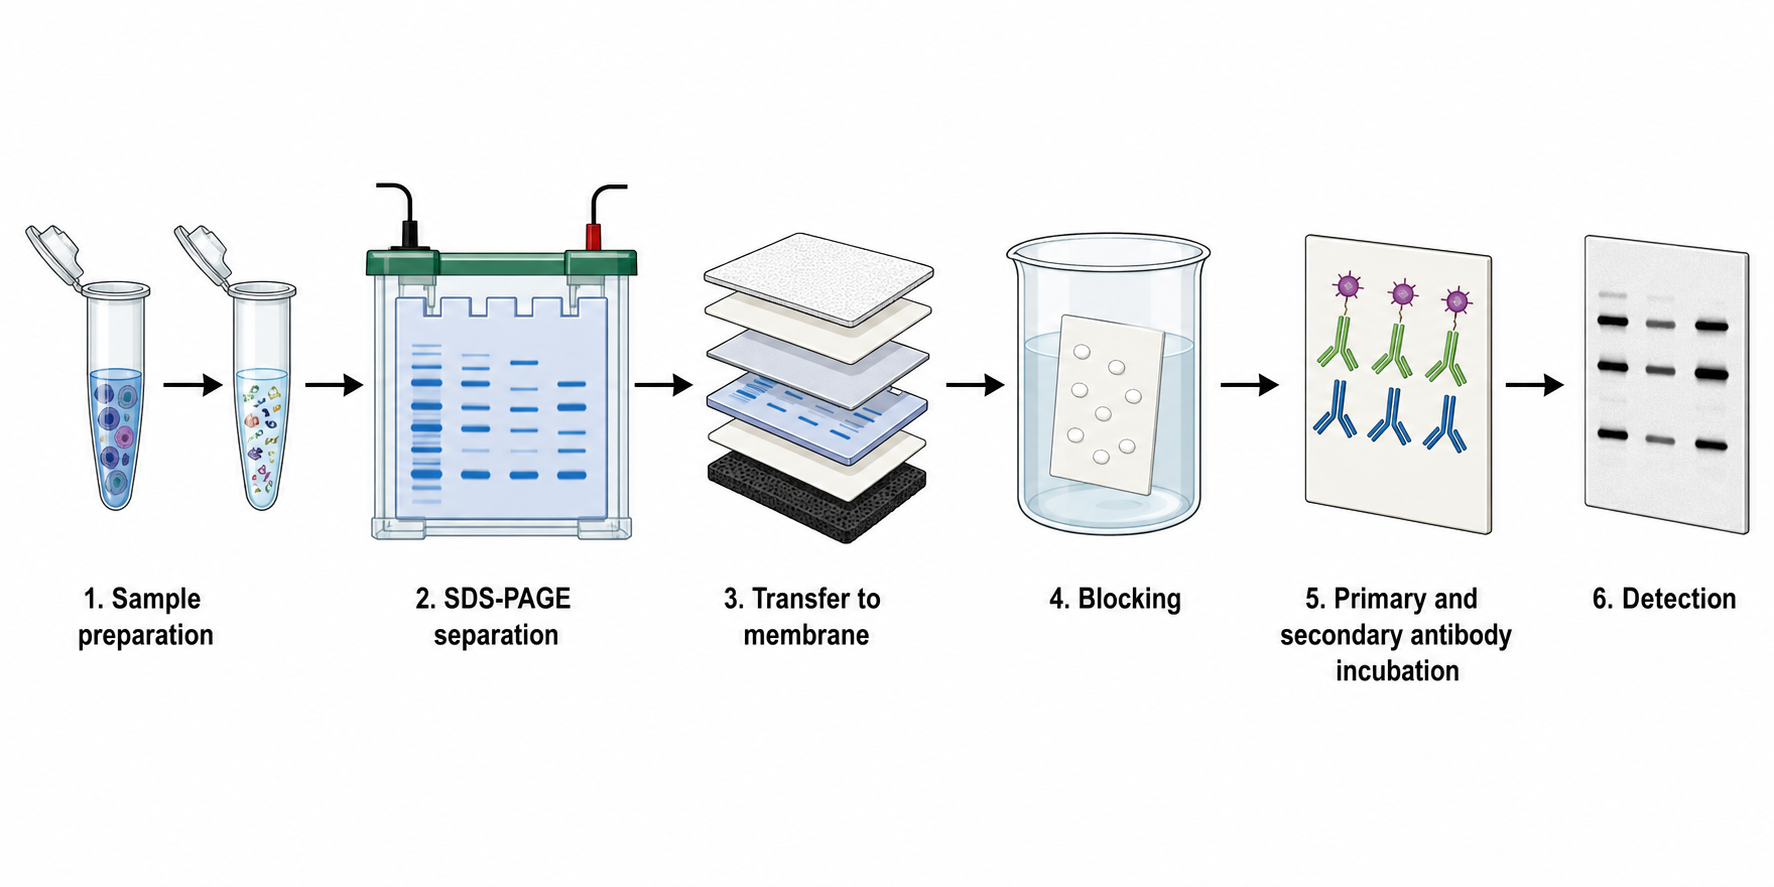
Beschreiben Sie ein beliebiges Western-Blot-Konzept – den kompletten Arbeitsablauf, ein Ergebnispanel mit Banden und einer Ladekontrolle, den Antikörpernachweis oder die Densitometrie – und SciDraw AI zeichnet eine klare, beschriftete Abbildung mit Spuren, Banden und MW-Markern, die Sie bearbeiten und exportieren können.
Beispiele für Western-Blot-Abbildungen
Starten Sie mit einem bewährten Prompt und passen Sie ihn an Ihre Studie an.
Was dieses Tool leistet
Der Western-Blot-Abbildungsgenerator wandelt eine Beschreibung in einfacher Sprache in eine klare, beschriftete Western-Blot-Abbildung oder einen Arbeitsablauf um. Sie beschreiben die gewünschten Spuren, Banden, Marker oder Schritte – den Ablauf von SDS-PAGE bis Detektion, ein Ergebnispanel, eine Ladekontrolle oder die Densitometrie – und SciDraw AI stellt sie klar dar. Entwickelt für Forschende, Studierende und Lehrende, die schnell präzise, publikationsreife Abbildungen zur Proteinanalyse brauchen.
Warum einen KI-Western-Blot-Abbildungsgenerator nutzen?
- Schematische Blots und Ablaufabbildungen sind von Hand mühsam zu zeichnen und auszurichten.
- Spurbeschriftungen, kDa-Marker und Bandenpositionen bleiben scharf und lesbar.
- Ein klares Layout macht Arbeitsabläufe und Ergebnisse leicht vermittelbar und nachvollziehbar.
- Jede Abbildung ist bearbeitbar und nach SVG oder PowerPoint exportierbar – für Publikationen und Vorträge.
- Ein Prompt deckt Ablauf, Ergebnisse, Ladekontrollen, Detektion und Quantifizierung ab.
So erstellen Sie eine Western-Blot-Abbildung
1) Beschreiben Sie, was Sie brauchen – den Arbeitsablauf, das Ergebnispanel oder die Quantifizierung sowie Spuren und Beschriftungen. 2) Klicken Sie auf Erstellen für einen beschrifteten Entwurf. 3) Verfeinern Sie ihn, indem Sie eine Spur hinzufügen, die Ladekontrolle markieren, umfärben oder umbenennen lassen. 4) Exportieren Sie nach SVG oder PPTX oder laden Sie ein hochauflösendes Bild für Ihr Manuskript, Ihre Vorlesung oder Ihr Poster herunter.
Was Sie darstellen können
- Die Schritte des Ablaufs von SDS-PAGE bis Detektion
- Ergebnisspuren, Zielbanden und Ladekontrollen
- Molekulargewichts-Markerleitern (kDa)
- Primären und sekundären Antikörpernachweis
- Densitometrie und Balkendiagramme der Bandenintensität
- Methodenvergleiche wie Western Blot vs. ELISA
Western-Blot-Abbildungsgenerator – FAQ
Welche Western-Blot-Abbildungen kann ich erstellen?
Den kompletten Arbeitsablauf, Ergebnispanels mit Banden und Ladekontrollen, MW-Markerleitern, Schritte des Antikörpernachweises, densitometrische Quantifizierung und Methodenvergleiche. Beschreiben Sie einfach, was Sie brauchen.
Hinweis zu schematisch vs. echte Daten
Dieses Tool erstellt klare schematische Illustrationen von Blots und Arbeitsabläufen für die Lehre und für Abbildungsentwürfe – es erfindet oder ersetzt nicht Ihre tatsächlichen experimentellen Blot-Bilder. Nutzen Sie es für Diagramme und präsentieren Sie dann Ihre eigenen Daten.
Kann ich die Abbildung nach dem Erstellen bearbeiten?
Auf jeden Fall. Verfeinern Sie jede Abbildung, indem Sie eine Spur hinzufügen, die Ladekontrolle markieren, umfärben, vereinfachen oder Beschriftungen umbenennen lassen – ohne die gesamte Abbildung neu zu zeichnen.
Kann ich nach PowerPoint oder SVG exportieren?
Ja. Abbildungen werden als bearbeitbares SVG oder PowerPoint (PPTX) exportiert oder als hochauflösende Bilder heruntergeladen – bereit für Manuskripte, Folien und Poster.
Ist es für Publikationen geeignet?
Die schematischen Abbildungen sind für publikationsreife Folien, die Lehre und die Abbildungsplanung ausgelegt, mit klarer Beschriftung nach den Standards von Fachzeitschriften und Lehrbüchern.
Brauche ich Designkenntnisse?
Nein. Wenn Sie die Abbildung in einem Satz beschreiben können, können Sie ein professionelles Ergebnis erstellen. Die KI übernimmt Layout, Gestaltung und Beschriftung.
Weitere Tools entdecken
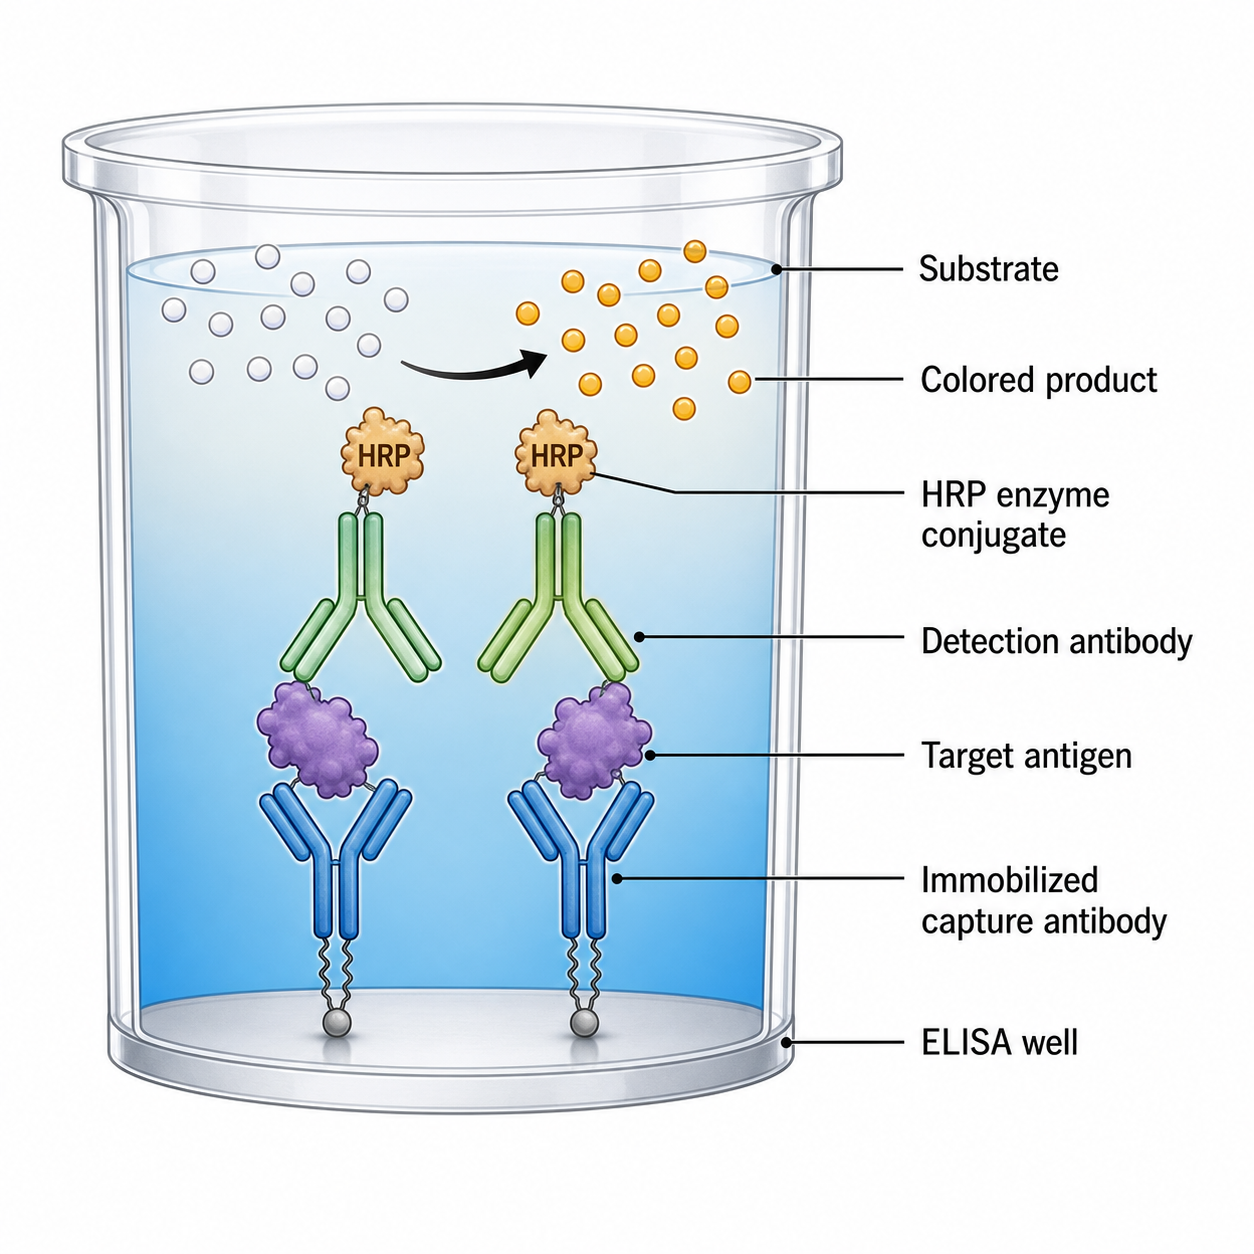
ELISA-Diagramm-Generator
Beschriftete ELISA-Diagramme zeichnen – Sandwich-, indirekter und kompetitiver Assay, Ablauf, Plattenbelegung und Standardkurven.
Kostenlos testen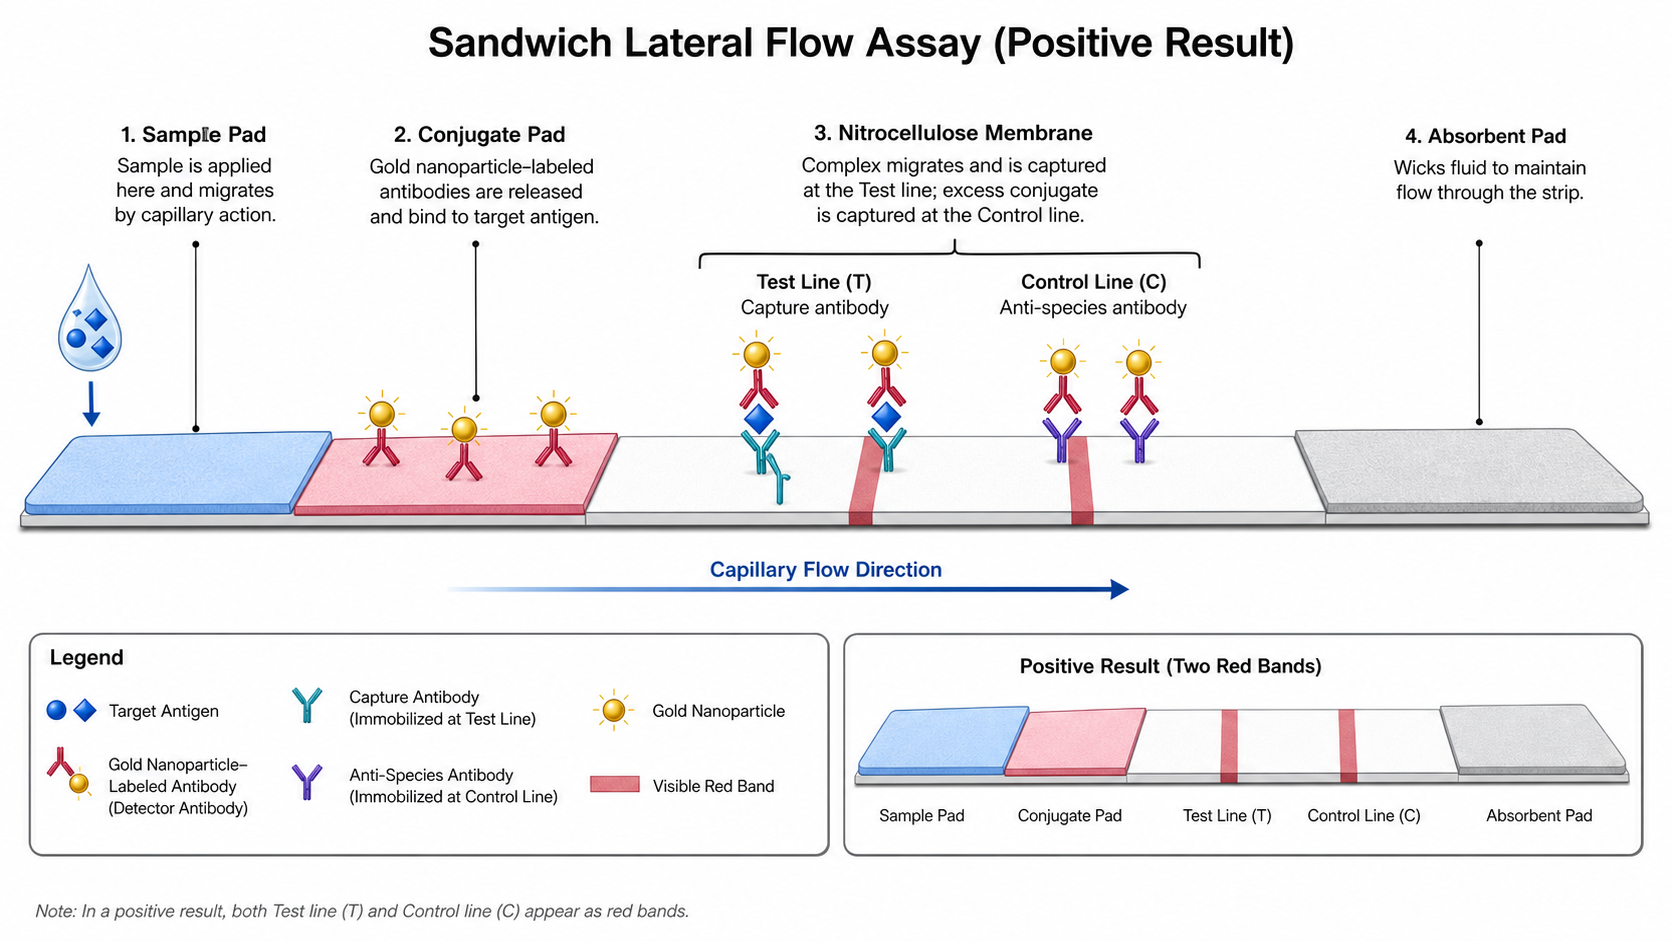
Generator für Lateral-Flow-Assay-Diagramme
KI-gestütztes Tool für Generator für Lateral-Flow-Assay-Diagramme mit klarer Struktur, Labels und exportfähigem Layout.
Kostenlos testen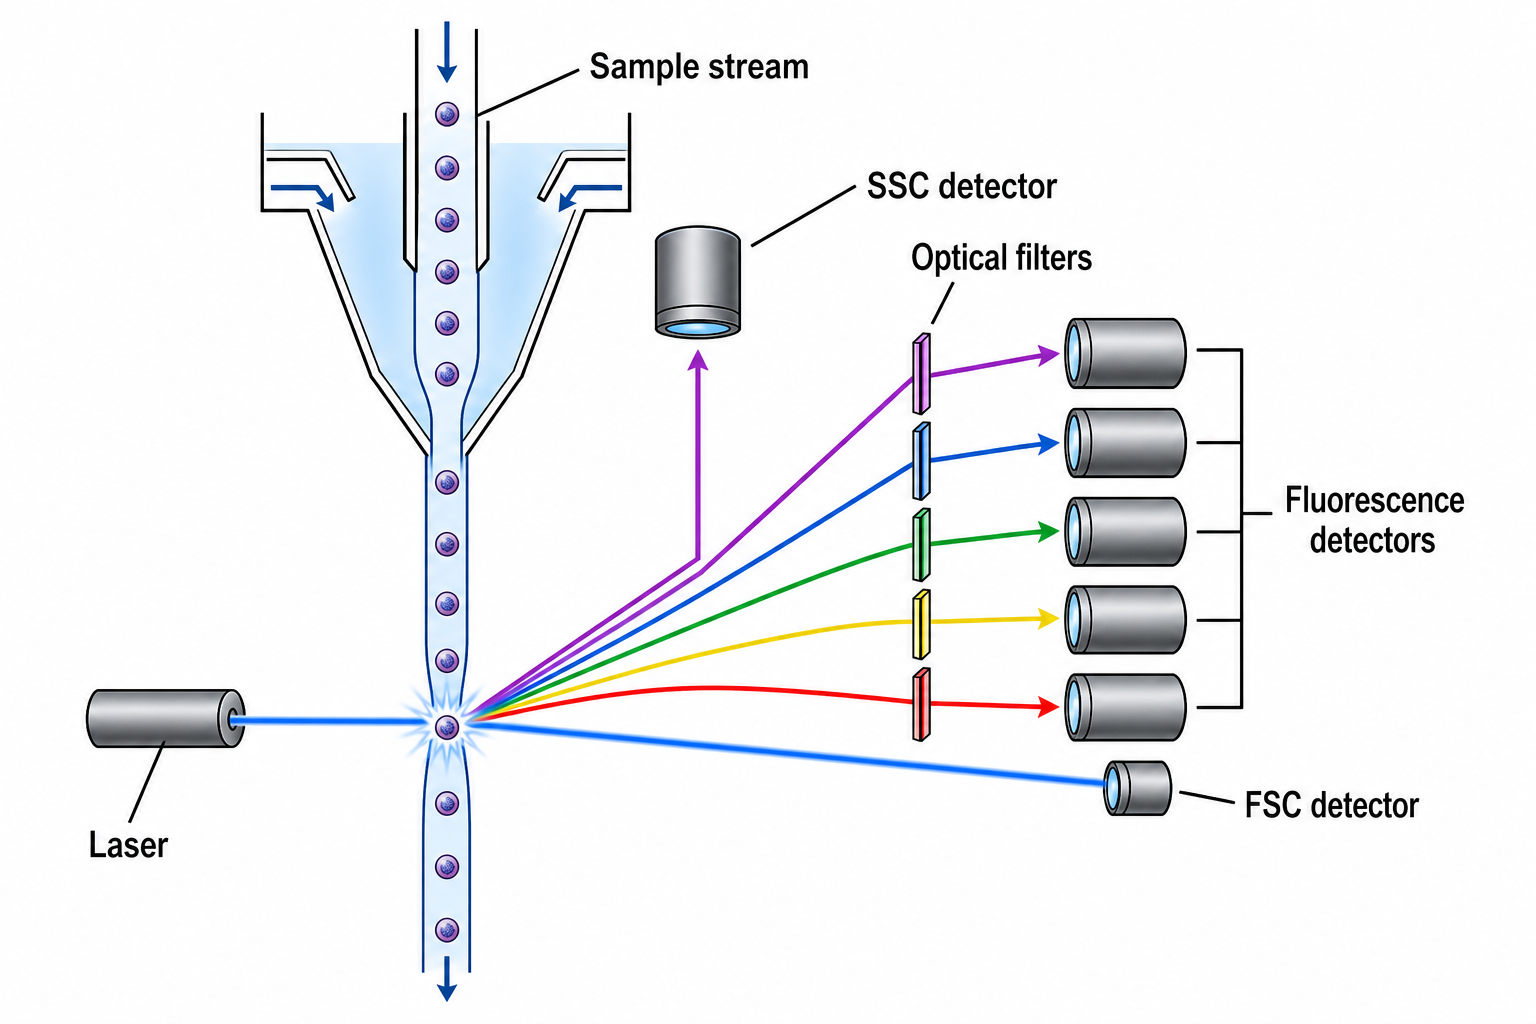
Durchflusszytometrie-Diagramm-Generator
Beschriftete Durchflusszytometrie-Abbildungen zeichnen – Zytometer-Schema, Gating-Strategien, Dot-Plots, Immunphänotypisierung und FACS-Sortierung.
Kostenlos testenZeichnen Sie jetzt Ihre Western-Blot-Abbildung
Beschreiben Sie einen beliebigen Blot-Ablauf oder ein Ergebnis und erhalten Sie in wenigen Minuten eine klare, beschriftete, publikationsreife Abbildung.