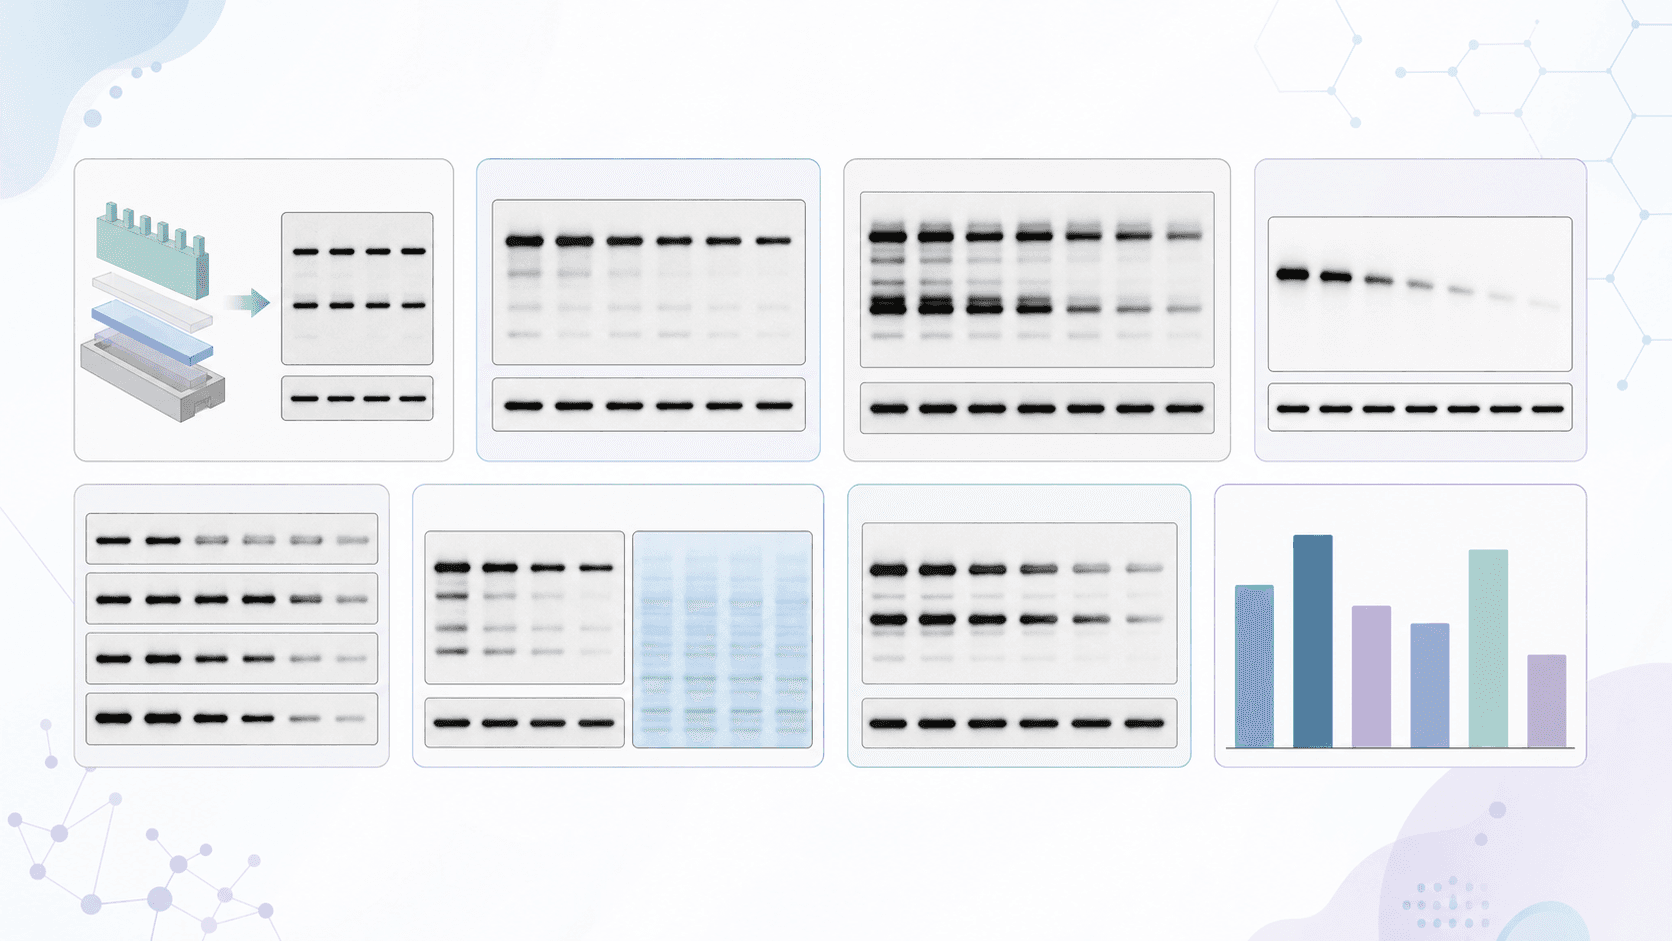
24 Western-Blot-Prompts für publikationsreife Schemata (2026)
Sofort einsetzbare KI-Prompts für Western-Blot-Abbildungen – der Ablauf von SDS-PAGE bis Detektion, Ergebnisbanden, Ladekontrollen, Antikörpernachweis und Densitometrie-Quantifizierung – plus wiederverwendbare Prompt-Vorlage, echte Beispiele und Tipps für beschriftete Spuren, kDa-Marker und saubere, publikationsreife Immunoblot-Schemata.
Western-Blot-Abbildungen erfüllen in einer Arbeit oder Vorlesung zwei Aufgaben: Sie erklären die Methode (ein sauberes Western-Blot-Workflow-Diagramm oder Schema) und sie präsentieren Ergebnisse (Spuren, Banden, Ladekontrollen und Quantifizierung). Beides ist mühsam von Hand zu zeichnen, und eine einzige falsch beschriftete Spur oder ein fehlender kDa-Marker kann einen Gutachter verwirren. Dieser Leitfaden liefert dir 24 sofort einsetzbare Western-Blot-Prompts, eine wiederverwendbare Prompt-Vorlage und echte generierte Beispiele, damit du in wenigen Minuten saubere, beschriftete, publikationsreife Immunoblot-Schemata mit KI erstellen kannst – ganz ohne Designsoftware und ohne Zeichenkenntnisse.
Ein Hinweis vorab: Nutze diese Western-Blot-Prompts für schematische Illustrationen – Lehrabbildungen, Workflow-Diagramme und Abbildungs-Mock-ups. Sie ersetzen nicht deine echten experimentellen Blot-Bilder; präsentiere für tatsächliche Ergebnisse deine eigenen Daten.
Am Ende dieses Leitfadens kannst du:
Ein Western-Blot-Workflow-Diagramm, eine Western-Blot-Ergebnis-Abbildung, ein Ladekontroll-Panel, ein Antikörpernachweis-Schema, ein Densitometrie-Quantifizierungs-Diagramm und einen Western-Blot-vs.-ELISA-Vergleich aus einem einzigen Satz erzeugen.
Jeden Prompt mit einer einfachen vierteiligen Vorlage an deine eigene Studie anpassen.
Die häufigsten Fehler vermeiden, die KI-Western-Blot-Banden falsch aussehen lassen.
Füge einen beliebigen Prompt in den Western Blot Figure Generator ein und verfeinere das Ergebnis anschließend, indem du eine Spur hinzufügen, die Ladekontrolle markieren, umfärben oder umbenennen lässt – oder öffne es im SciDraw AI Editor, um weiter zu iterieren.
Davie Chen is a researcher at the Faculty of Animation and Intermedia, University of Arts in Poznan, studying generative AI for scientific figure creation, patent illustration, and manuscript drafting. SciDraw AI is one of the research-to-product tools built from this work.
Erstellen Sie Ihre wissenschaftlichen Abbildungen mit KI
Tausende Forschende nutzen SciDraw AI, um in Minuten publikationsreife Abbildungen für Paper, Anträge und Journaleinreichungen zu erstellen – ganz ohne Designkenntnisse.
Spuren / Banden / Marker (oder Schritte) – benenne die Spuren (Kontrolle vs. behandelt), die Zielproteinbanden, die Ladekontrolle, die kDa-Leiter – oder die geordneten Workflow-Schritte.
Beschriftungen – benenne jede Spur, Bande, jeden Antikörper und jede Molekulargewichtsposition, die beschriftet werden soll.
Stil & Layout – „Flat-Vector, publikationsreif, Fluss von links nach rechts, beschriftete kDa-Leiter links".
Vorlage: „Zeichne [Thema] mit [Spuren/Banden/Markern oder Schritten]. Beschrifte [Spuren, Zielprotein, Ladekontrolle, kDa-Marker]. Verwende einen sauberen Flat-Vector-Stil mit einer beschrifteten kDa-Leiter und einer Ladekontroll-Bande."
Halte diese Vorlage griffbereit – jeder Prompt unten folgt ihr, und du kannst einfach dein eigenes Thema einsetzen.
Benenne die Spuren. Sage der KI genau, welche Spuren sie zeichnen soll (z. B. „Kontrolle vs. behandelt" oder „0, 6, 12, 24 h") und welche Proteine sie zeigen soll – die KI beschriftet, was du benennst.
Fordere eine kDa-Leiter an. Bitte um einen Molekulargewichtsmarker und beschrifte die Bandenpositionen (z. B. „beschrifte das 55-kDa-Ziel und das 37-kDa-GAPDH").
Füge eine Ladekontrolle ein. Setze GAPDH oder β-Actin unter die Zielbande, damit Ergebnis-Panels als normalisiert gelesen werden.
Wähle den Umfang. Lege fest, ob du ein Western-Blot-Workflow-Diagramm, ein Ergebnis-Panel, einen Detektionsmechanismus oder ein Densitometrie-Quantifizierungs-Diagramm möchtest – eine Abbildung pro Aufgabe.
Iteriere, statt neu zu starten. Verfeinere mit „füge neben dem Blot ein Densitometrie-Balkendiagramm hinzu" oder „färbe die behandelte Spur um", statt den ganzen Prompt umzuschreiben.
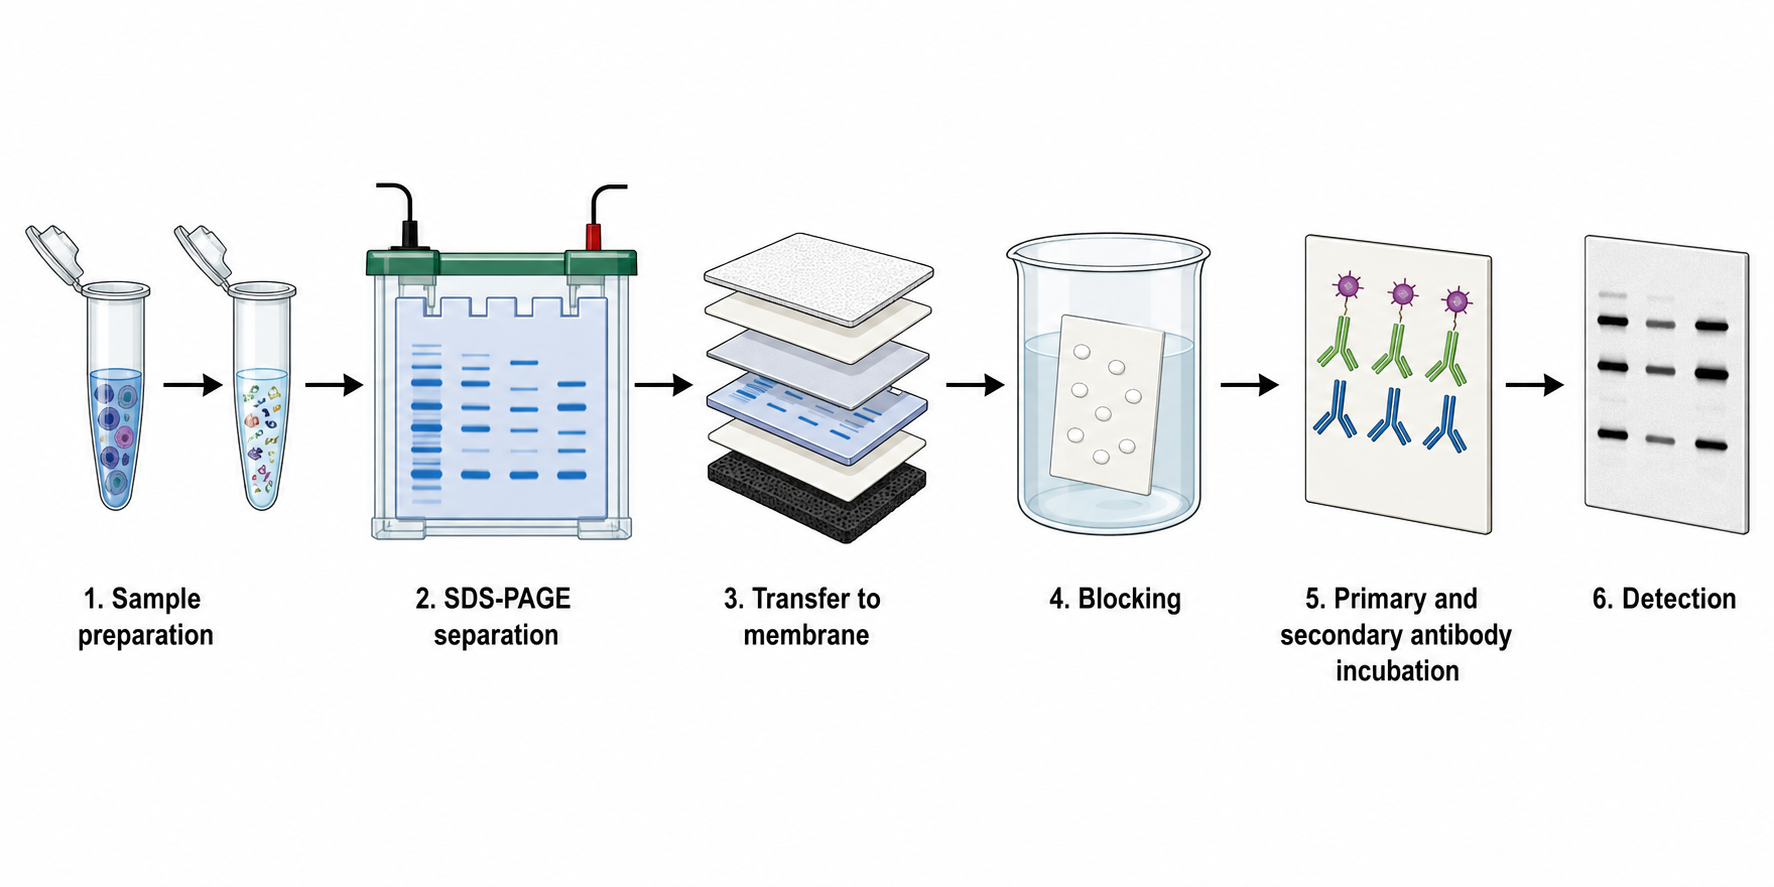
Das Western-Blot-Workflow-Diagramm ist das meistgefragte Schema – es führt einen Leser durch die SDS-PAGE-Trennung, den Transfer, das Blockieren, die Antikörperinkubation und die Detektion. Beginne mit dem vollständigen Ablauf und zoome dann in einzelne Schritte hinein.
Zeichne den Western-Blot-Workflow als Fluss von links nach rechts: Probenvorbereitung, SDS-PAGE-Trennung, Transfer auf eine Membran, Blockieren, Inkubation mit Primär- und Sekundärantikörper und Detektion, beschrifte jeden Schritt.
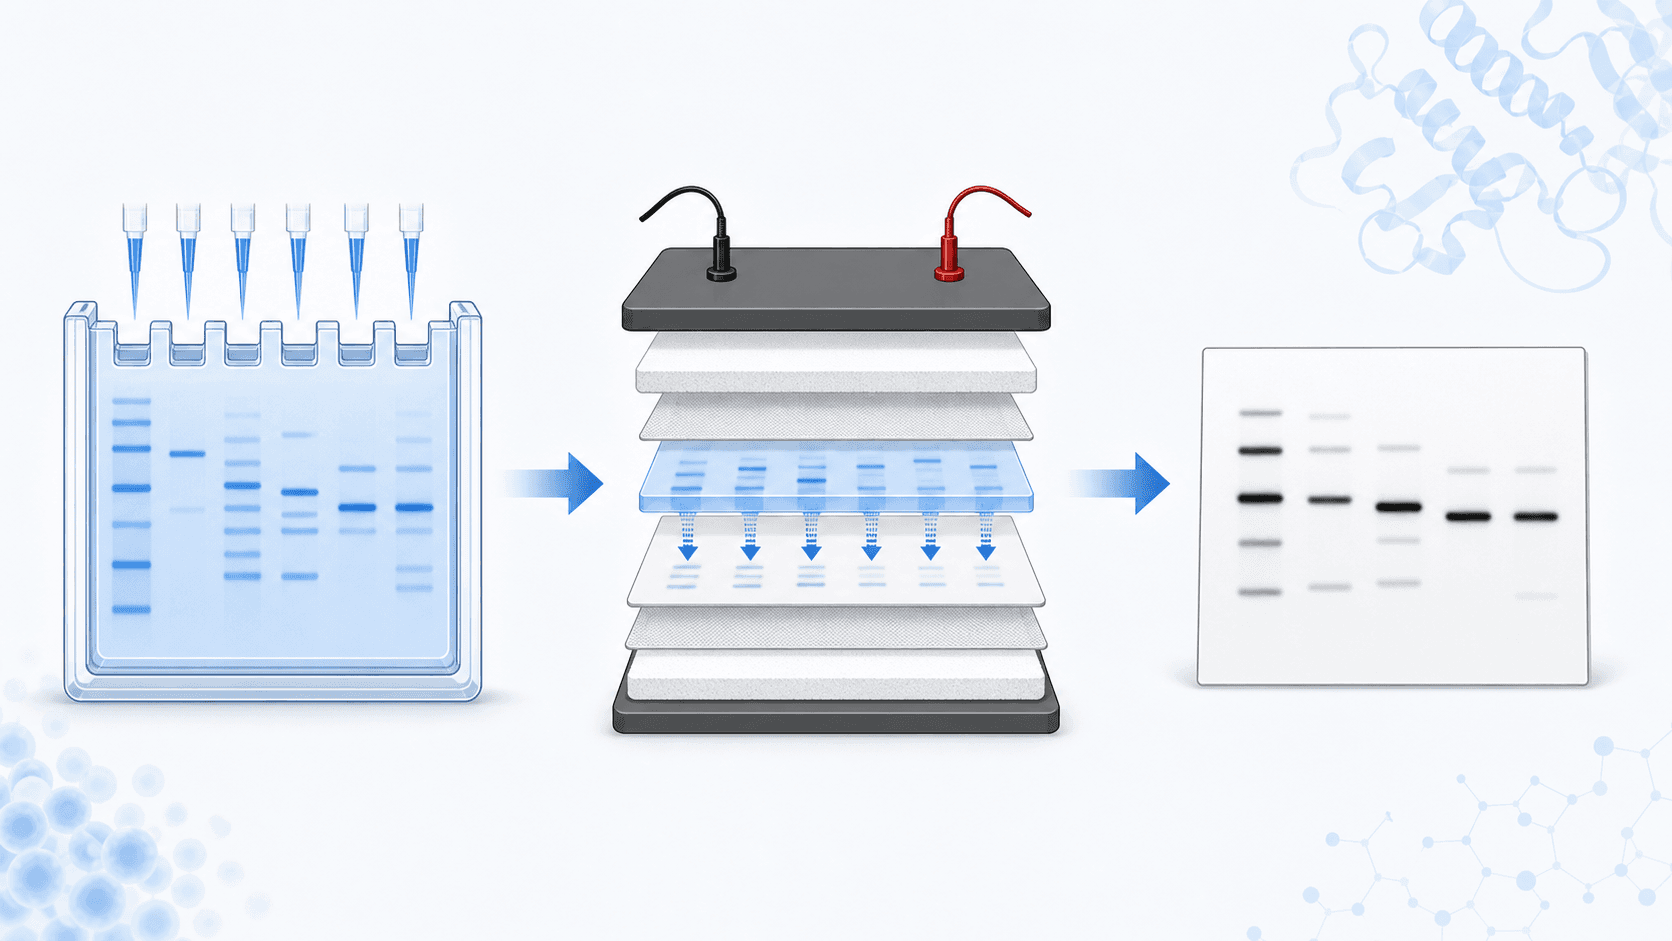
Zeichne das SDS-PAGE-Diagramm, das die Trennung von Proteinen nach Größe in einem Polyacrylamidgel zeigt, mit beschrifteter Molekulargewichtsleiter und Taschenpositionen.
Zeichne den Transfer- (Blotting-)Schritt, der Proteine vom Gel auf eine Membran überträgt, und beschrifte den Sandwich-Aufbau (Gel, Membran, Filterpapier, Elektrodenrichtung).
Zeichne den Blockier- und Waschschritt eines Western Blots und zeige Blockierpuffer, der die Membran bedeckt, um unspezifische Antikörperbindung zu verhindern.
Zeichne das vollständige Immunoblot-Diagramm vom Zelllysat bis zum Chemilumineszenz-Signal als saubere horizontale Pipeline mit nummerierten, beschrifteten Stufen.
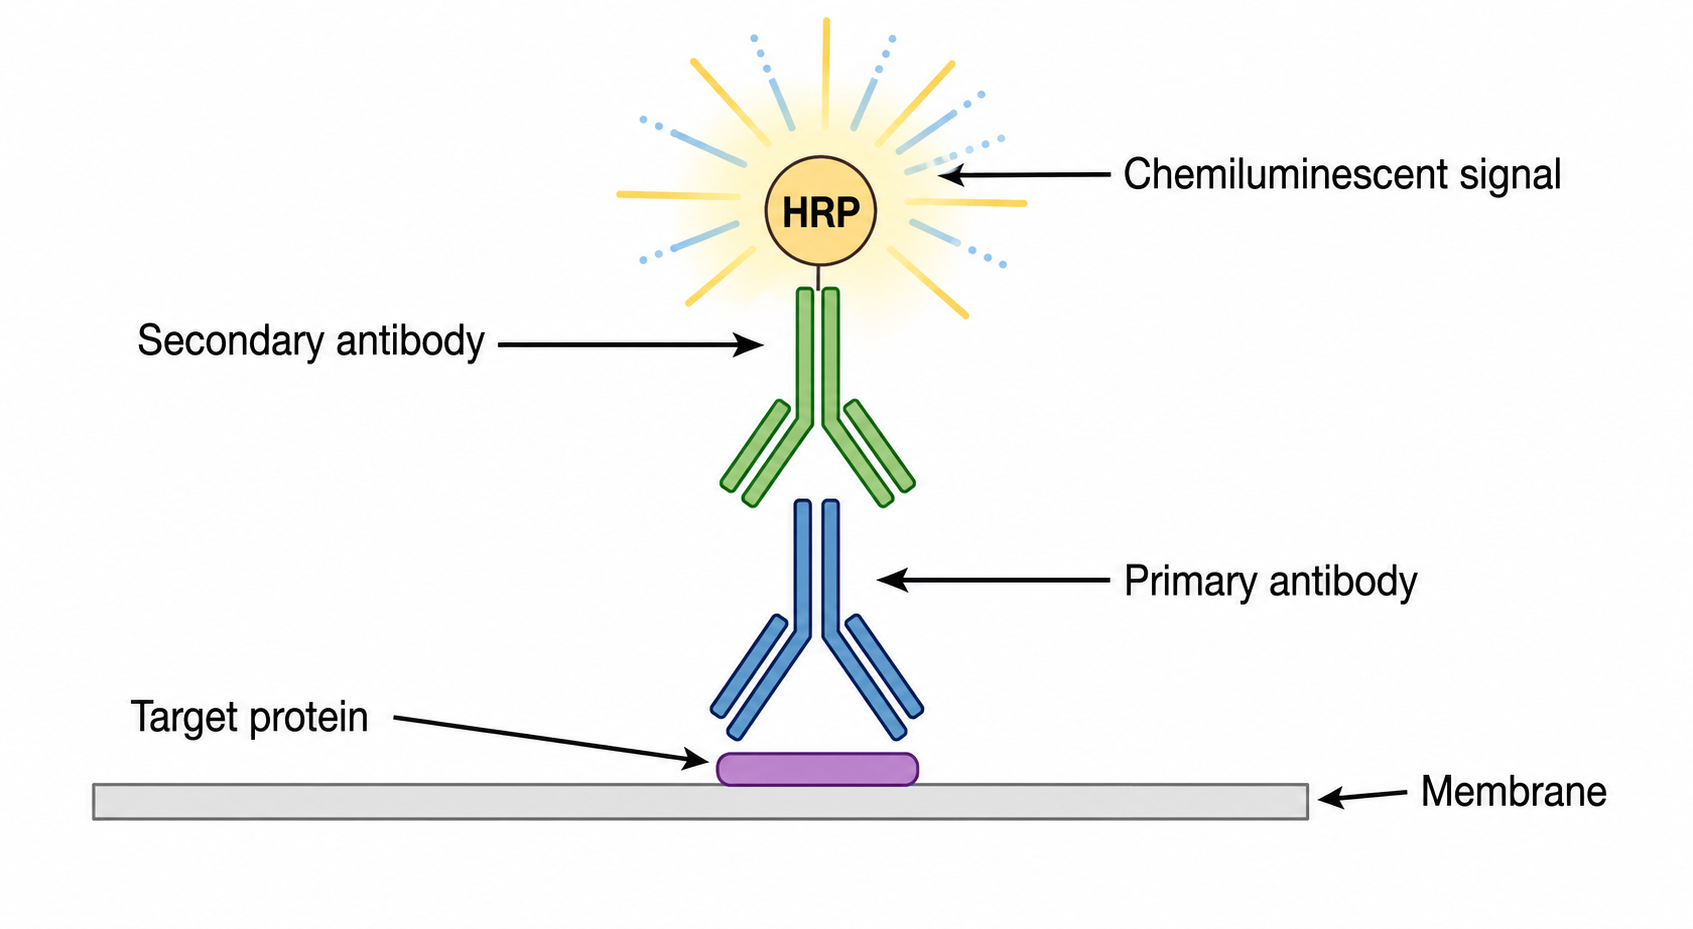
Zeichne den Antikörpernachweis-Schritt: das Zielprotein auf der Membran, gebunden von einem Primärantikörper, dann ein HRP-konjugierter Sekundärantikörper, der ein Chemilumineszenz-Signal erzeugt, mit jeder Komponente beschriftet.
Zeichne ein beschriftetes Diagramm der Beziehung zwischen Primär- und Sekundärantikörper und zeige, wie ein Primärantikörper von mehreren Sekundärantikörpern erkannt wird, um das Signal zu verstärken.
Ergebnisabbildungen sind das, worauf Gutachter zuerst schauen. Diese Prompts erzeugen beschriftete Western-Blot-Banden, Ladekontrollen und Densitometrie-Quantifizierungs-Diagramme – das schematische Layout, das du als Abbildungs-Mock-up verwenden würdest, bevor du deine echten Daten einsetzt.
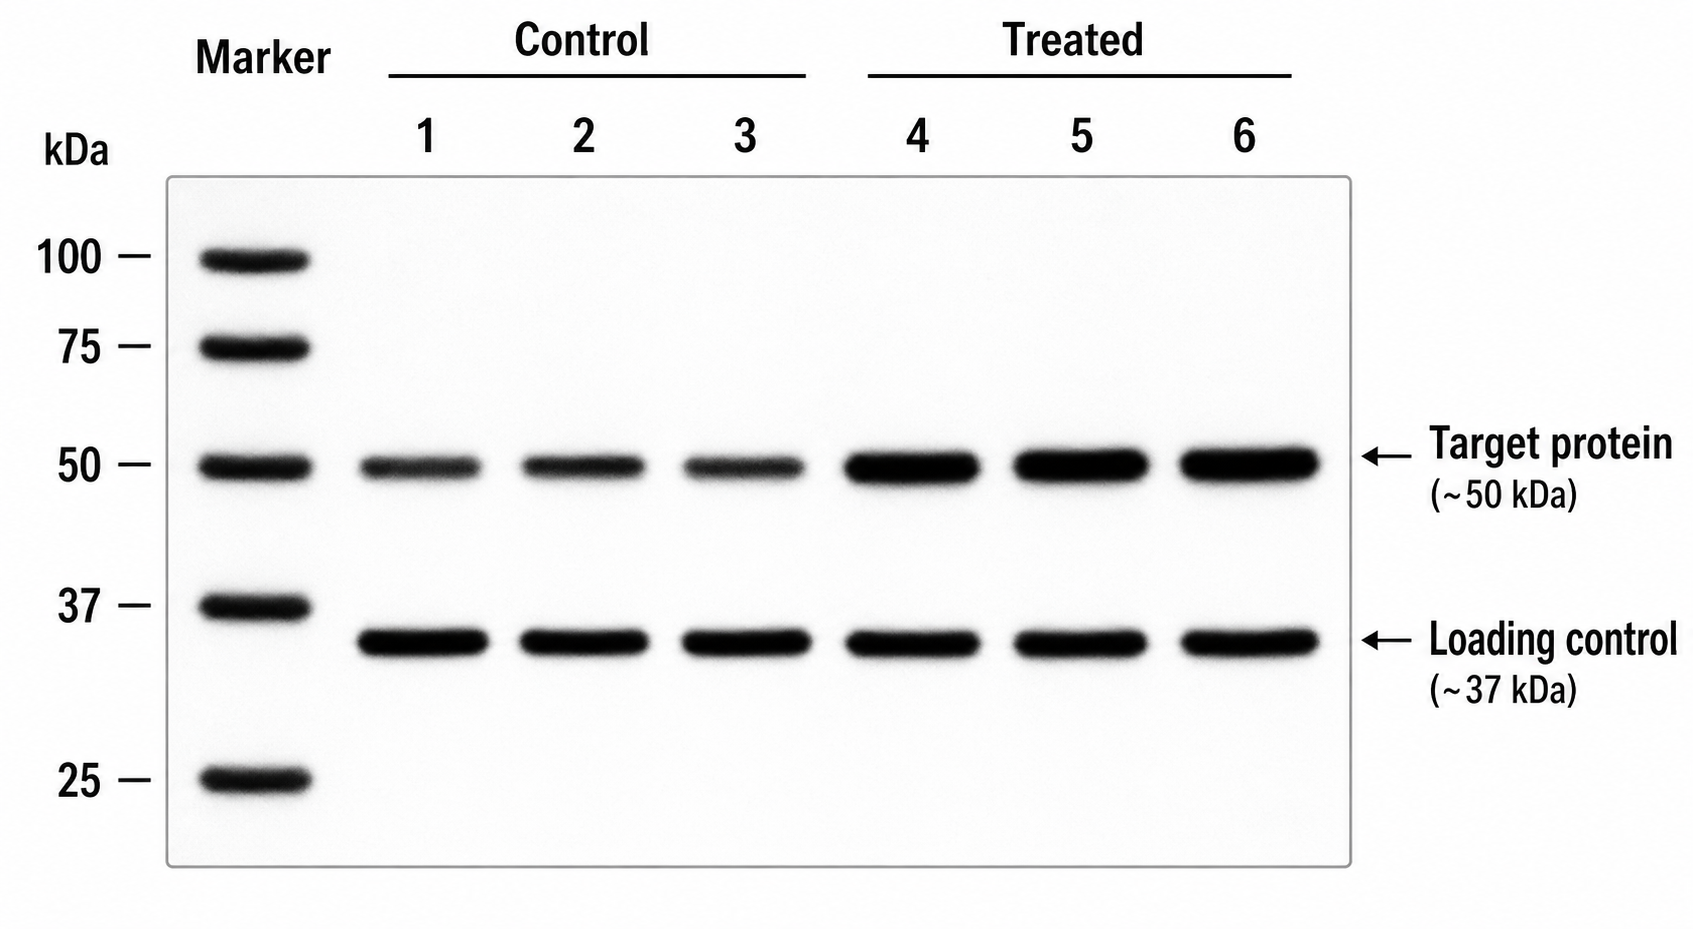
Zeichne eine Western-Blot-Ergebnis-Abbildung mit Kontroll- vs. behandelten Spuren, der Zielproteinbande, einer Ladekontroll-Bande darunter und einer kDa-Marker-Leiter links.
Zeichne ein Western-Blot-Ergebnis-Panel, das einen Protein-Knockdown zeigt: eine starke Zielbande in der Kontrollspur und eine schwache Bande in der siRNA-/Knockdown-Spur, mit einer GAPDH-Ladekontrolle.
Zeichne einen Western Blot, der eine Proteinüberexpression zeigt, mit einer stärkeren Zielbande in der transfizierten Spur gegenüber der Leervektor-Kontrolle.
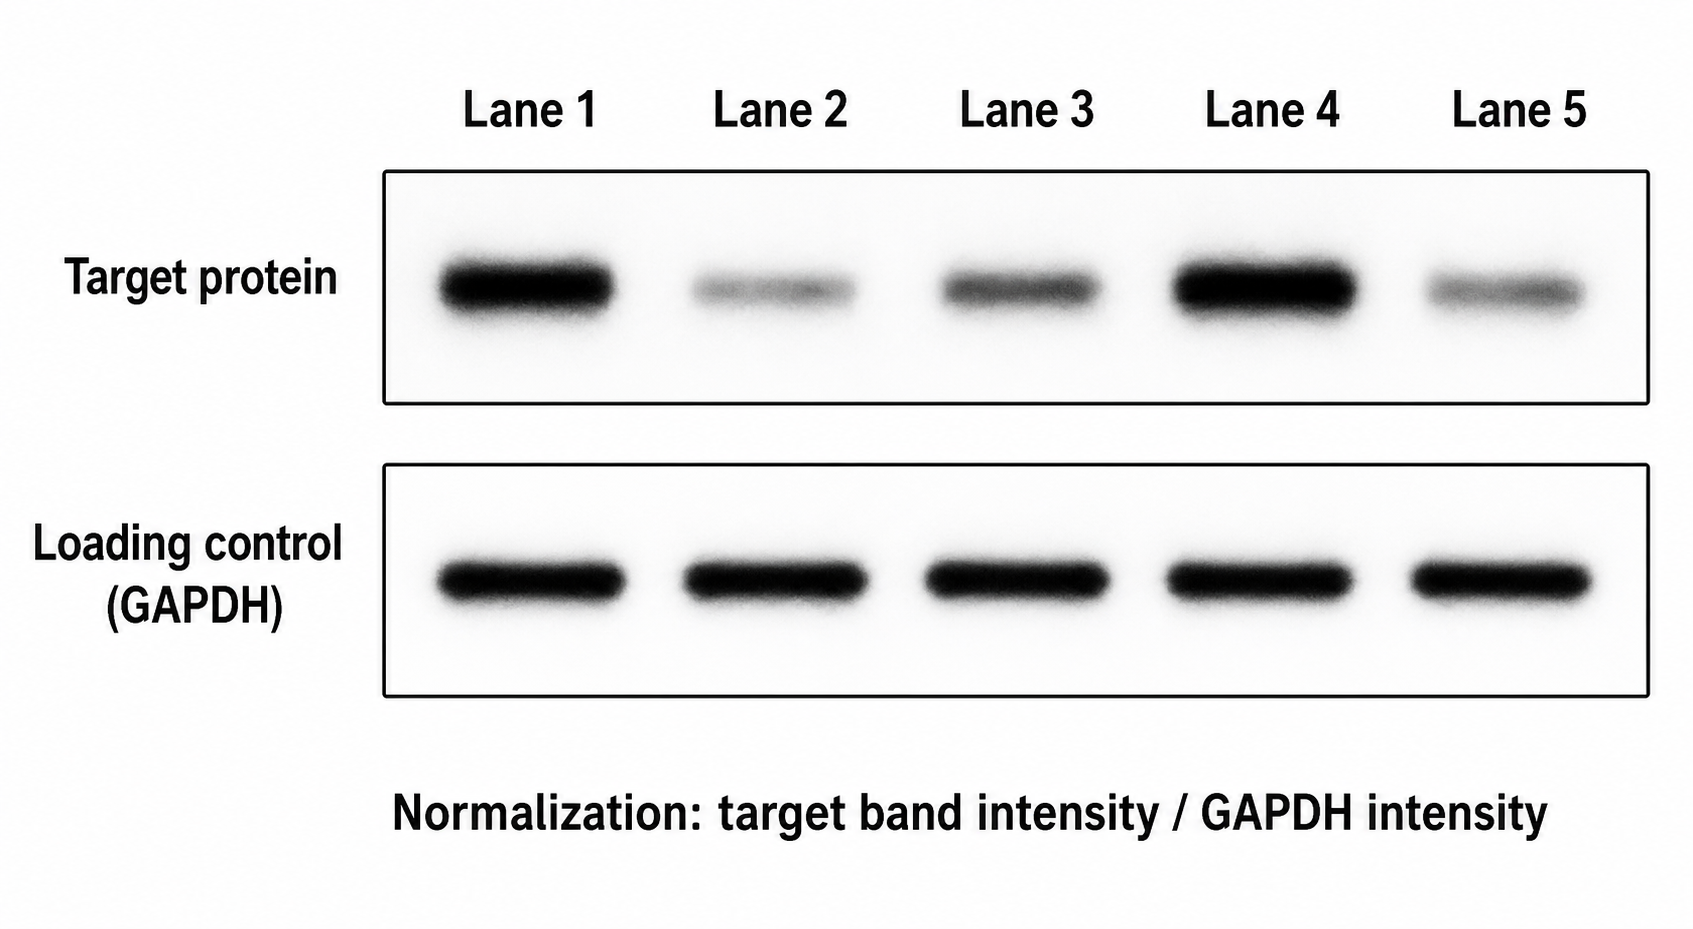
Zeichne ein Western-Blot-Ladekontroll-Diagramm, das eine Zielproteinbande über einer Housekeeping-Bande (GAPDH oder β-Actin) über mehrere Spuren zeigt und die Normalisierung veranschaulicht.
Zeichne ein Western-Blot-Ergebnis mit drei biologischen Replikaten pro Bedingung, das konsistente Zielbanden über einer einheitlichen Ladekontrolle zeigt.
Zeichne einen Zeitverlauf-Western-Blot, der die Expression eines Proteins über mehrere beschriftete Zeitpunkte (0, 6, 12, 24, 48 h) hinweg zeigt, mit einer Ladekontrolle.
Zeichne einen Dosis-Wirkungs-Western-Blot mit steigenden Behandlungskonzentrationen über die Spuren und einer beschrifteten kDa-Leiter.
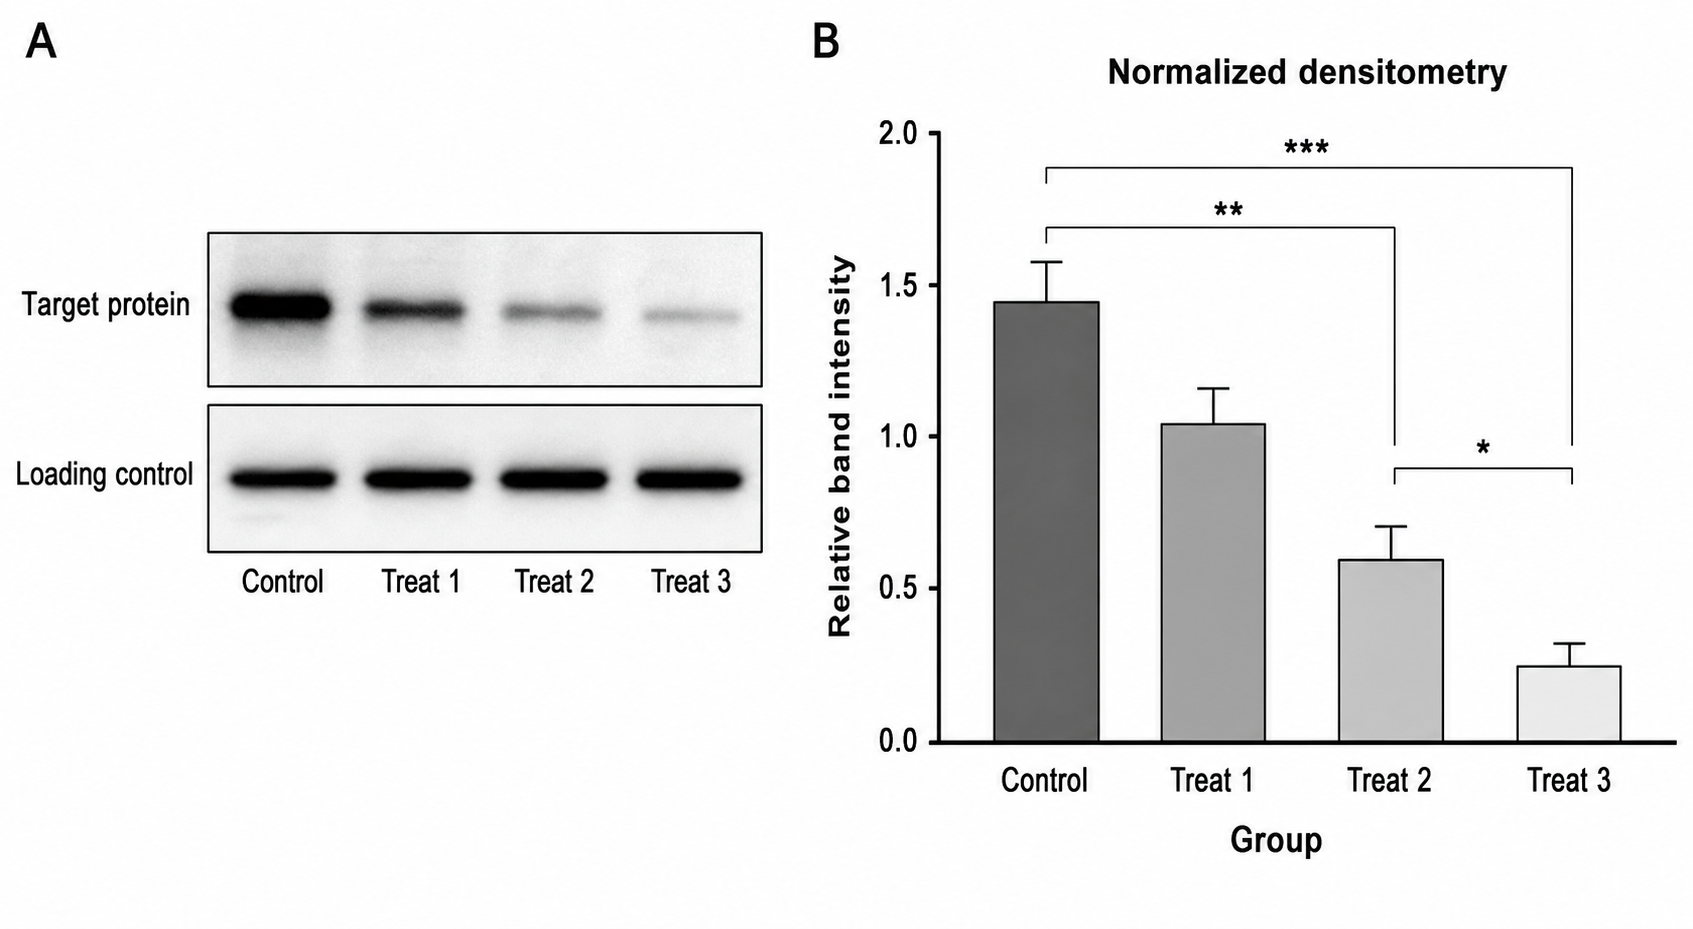
Zeichne eine Western-Blot-Quantifizierungs-Abbildung: Blot-Spuren links und ein Densitometrie-Balkendiagramm der relativen Bandenintensität rechts, normalisiert auf die Ladekontrolle.
Zeichne ein Densitometrie-Quantifizierungs-Panel, das die Bandenintensität von Kontrolle vs. behandelt als Balkendiagramm mit Fehlerbalken und einem Signifikanzmarker vergleicht.
Zeichne einen Phosphoprotein-Western-Blot, der phosphorylierte und Gesamtproteinbanden gestapelt zeigt, mit einem Verhältnis-Balkendiagramm, das die Phosphorylierung quantifiziert.
Diese Prompts erklären, wie die Detektion funktioniert und wie der Western Blot mit anderen Assays vergleicht – ideal für Lehrfolien und Übersichtsartikel.
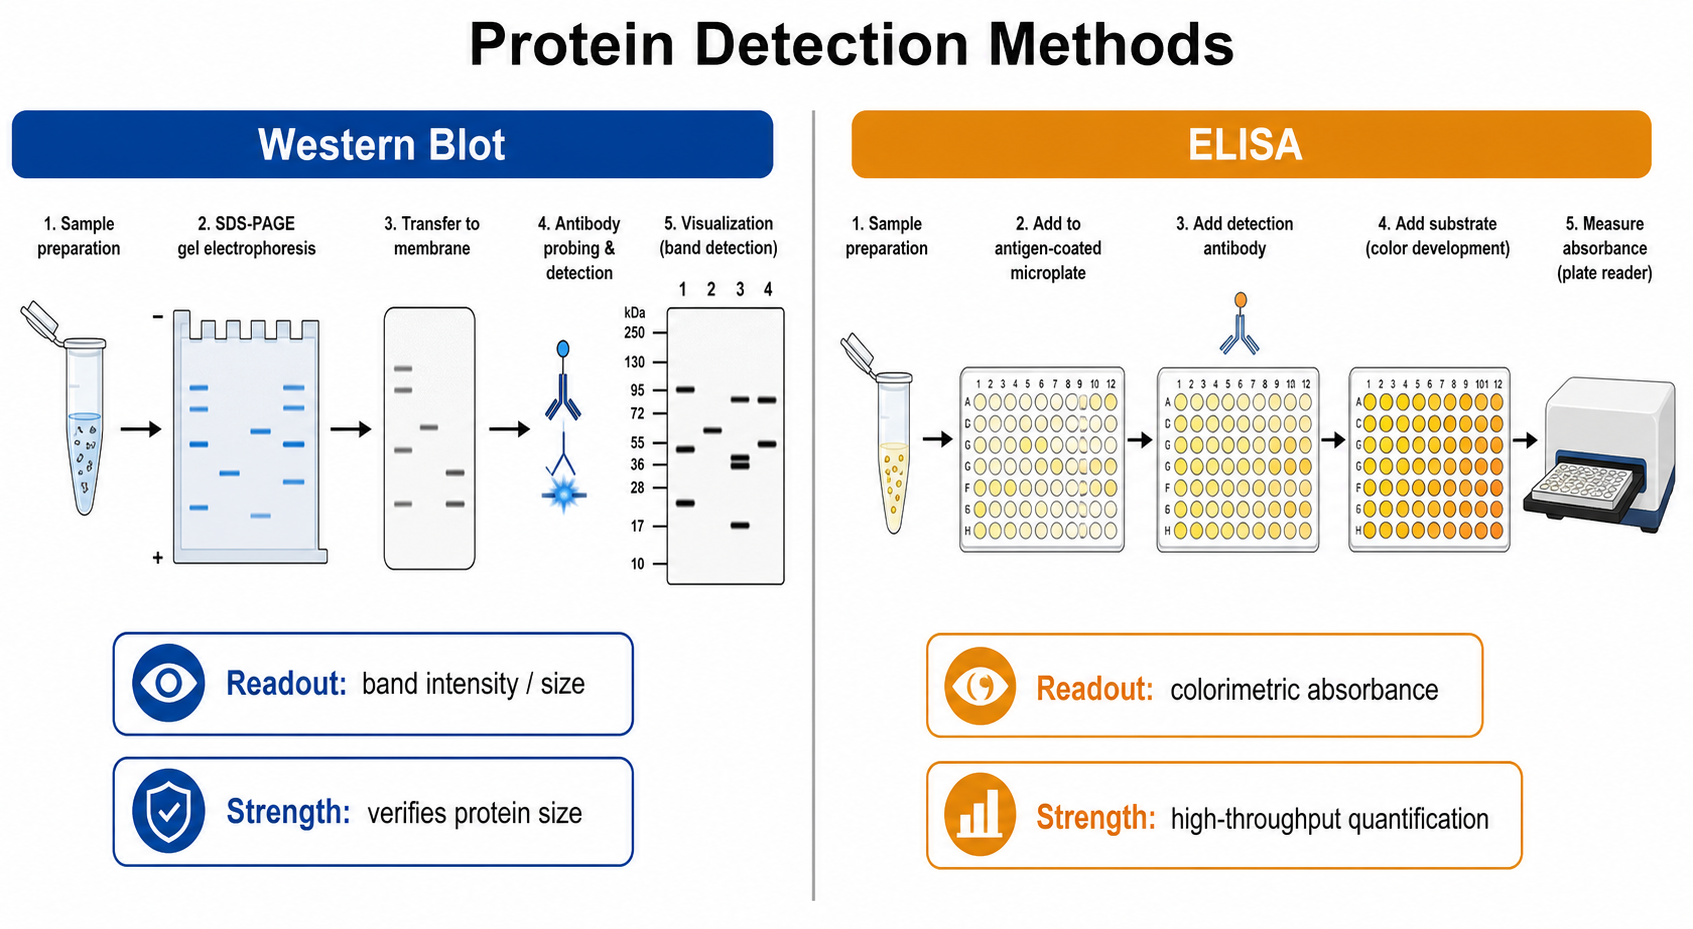
Zeichne einen zweispaltigen Vergleich von Western Blot vs. ELISA für den Proteinnachweis und beschrifte Readout, Format und die wichtigste Stärke jeder Methode.
Zeichne den Chemilumineszenz-Detektionsmechanismus: HRP wandelt ein Substrat um, das Licht emittiert, das von einem Bildgebungssystem erfasst wird, mit jedem Element beschriftet.
Zeichne einen Vergleich von chemilumineszentem vs. fluoreszentem Western-Blot-Nachweis und beschrifte Signaltyp und Detektionsmethode für jeden.
Zeichne gängige Western-Blot-Troubleshooting-Ergebnisse (keine Banden, hoher Hintergrund, zusätzliche/unspezifische Banden, lächelnde Banden) als beschriftete Panels mit wahrscheinlichen Ursachen.
Zeichne einen Co-Immunpräzipitations-Workflow mit anschließendem Western Blot zum Nachweis von Protein-Protein-Interaktionen und beschrifte die Köder- (Bait-), Beute- (Prey-) und Pull-down-Schritte.
Zeichne einen Vergleich von Western Blot, Northern Blot und Southern Blot nebeneinander und beschrifte das Zielmolekül (Protein, RNA, DNA) für jeden.
Zeichne ein Stripping- und Reprobing-Diagramm, das eine Membran zeigt, von der die Antikörper entfernt werden und die für ein zweites Zielprotein erneut sondiert wird.
Nicht beschriftete Spuren oder fehlende kDa-Leiter. Lösung: Benenne die Spuren und fordere ausdrücklich „eine beschriftete kDa-Marker-Leiter links" an. Iteriere mit „beschrifte die 55-kDa-Zielbande und 37-kDa-GAPDH".
Keine Ladekontrolle. Lösung: Bitte in Ergebnis-Panels immer um eine GAPDH- oder β-Actin-Bande unter dem Ziel, damit die Abbildung als normalisiert gelesen wird.
Banden, die alle identisch aussehen. Lösung: Beschreibe das erwartete Muster („starke Bande in der Kontrolle, schwache Bande in der Knockdown-Spur"), damit die Western-Blot-Banden das Ergebnis transportieren.
Verstümmelter Text (typisch für generische Bild-KI). Lösung: SciDraw AI rendert saubere serifenlose Beschriftungen; iteriere mit dem exakten Wortlaut, falls eine Beschriftung falsch ist.
Ein Schema als echte Daten behandeln. Lösung: Denke daran, dass dies Illustrationen sind – nutze sie für Workflow-Diagramme und Abbildungs-Mock-ups und präsentiere für tatsächliche Ergebnisse deine eigenen experimentellen Blots.
Welches ist das beste KI-Tool, um eine Western-Blot-Abbildung zu erstellen?
Der Western Blot Figure Generator von SciDraw AI ist für publikationsreife Western-Blot-Schemata gemacht – Workflow-Diagramme, Ergebnis-Panels mit beschrifteten Banden und Ladekontrollen, Antikörpernachweis und Densitometrie-Quantifizierung – mit sauberen Beschriftungen und editierbarem SVG-/PPTX-Export.
Wie erstelle ich eine Western-Blot-Abbildung mit KI?
Beschreibe die Spuren, das Zielprotein, die Ladekontrolle und die kDa-Marker, die du möchtest, und generiere dann. Beginne mit Prompt #8 für eine Ergebnis-Abbildung oder Prompt #1 für den Workflow und verfeinere durch Hinzufügen von Spuren oder eines Densitometrie-Diagramms.
Kann ich Western-Blot-Abbildungen online kostenlos zeichnen?
Ja – du kannst kostenlos mit dem Erstellen von Western-Blot-Abbildungen beginnen und für mehr Credits sowie editierbaren SVG-/PPTX-Export für Arbeiten und Folien upgraden.
Sind diese Abbildungen echte Western-Blot-Daten oder Schemata?
Sie sind schematische Illustrationen für die Lehre, Workflow-Diagramme und Abbildungs-Mock-ups – kein Ersatz für deine experimentellen Blot-Bilder. Präsentiere als tatsächliche Ergebnisse immer deine eigenen aufgenommenen Blots und Densitometrie.
Was ist der Unterschied zwischen einer Western-Blot- und einer ELISA-Abbildung?
Ein Western-Blot-Diagramm zeigt nach Größe getrennte Proteine als beschriftete Banden über Spuren (mit einer kDa-Leiter und Ladekontrolle), während eine ELISA-Abbildung typischerweise eine Platte oder ein kolorimetrisches/Absorptions-Readout zeigt. Nutze Prompt #18, um einen Western-Blot-vs.-ELISA-Vergleich nebeneinander zu zeichnen.
Wähle einen beliebigen Prompt oben aus, füge ihn in den Western Blot Figure Generator ein und verfeinere ihn im SciDraw AI Editor, bis er zu deiner Studie passt. Vom SDS-PAGE-Workflow bis zu einem vollständig beschrifteten Densitometrie-Panel – deine nächste Western-Blot-Abbildung ist nur einen Satz entfernt.