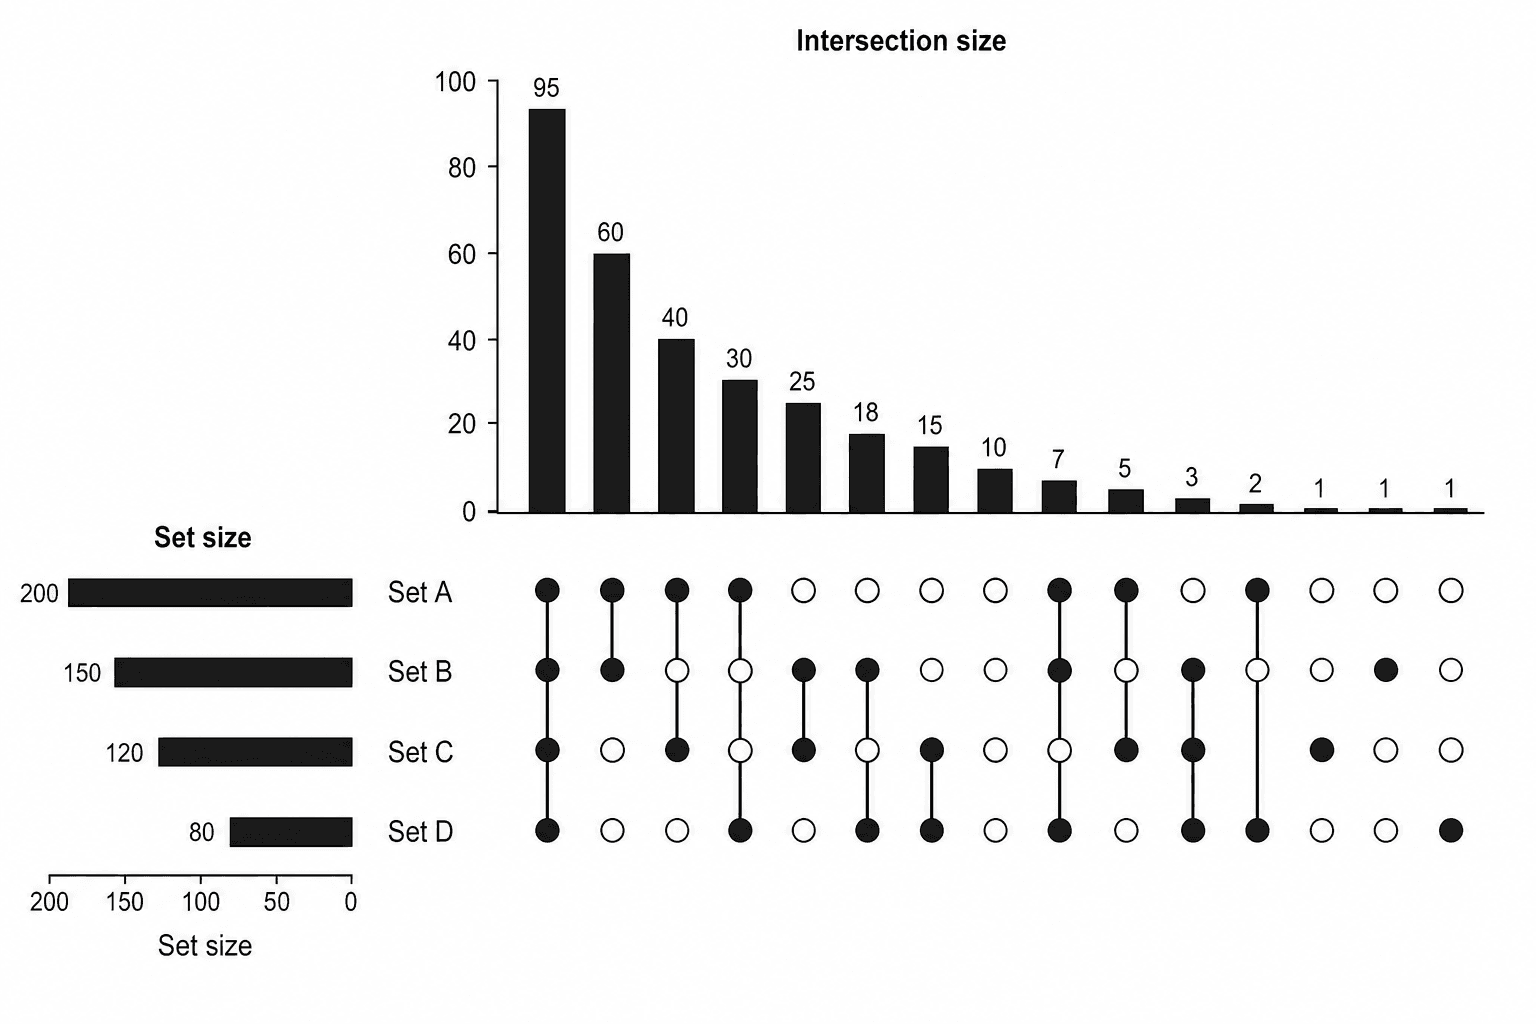
A five-circle Venn diagram often creates more confusion than information. Regions become too small to label, readers cannot compare their areas reliably, and omitted intersections are easy to miss. An UpSet plot replaces those overlapping shapes with an explicit intersection matrix and aligned bar charts.
Use SciDraw's UpSet Plot Generator when the research question concerns overlap among several gene lists, cohorts, feature sets, species, pathways, or experimental conditions. The generator accepts a structured membership table and sends the result to SciVis for refinement.
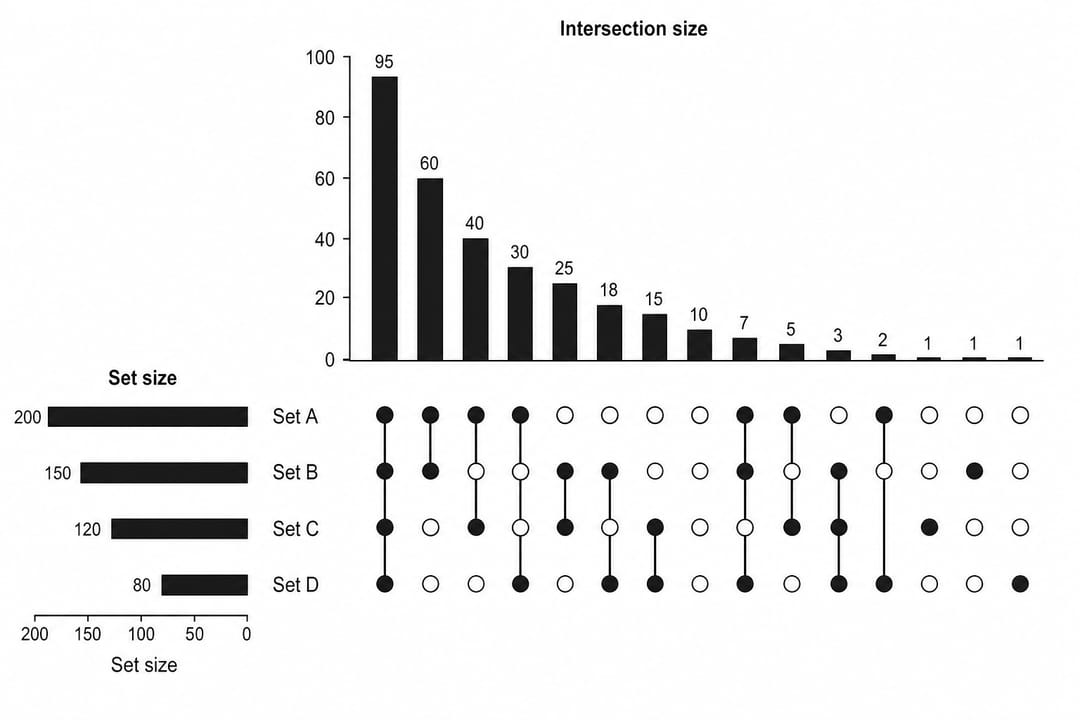
Common UpSet plot mistakes
- Counting an intersection twice: decide whether bars represent exclusive intersections or inclusive overlaps.
- Using inconsistent identifiers:
Gene-1,gene1, andGene_1may be treated as different items. - Leaving duplicates in a set: membership is normally binary; repeated records should not inflate an intersection.
- Sorting without saying how: intersection bars may be ordered by size, degree, or a defined biological priority.
- Showing too many tiny intersections: filter only with a stated rule and preserve the full data elsewhere.
What data does an UpSet plot need?
SciDraw's examples use a wide binary-membership table:
| Column | Purpose | Example |
|---|---|---|
item | Unique entity | Gene_001 |
Control | Membership in the Control set | 1 or 0 |
Treatment_A | Membership in Treatment A | 1 or 0 |
Treatment_B | Membership in Treatment B | 1 or 0 |
Treatment_C | Membership in Treatment C | 1 or 0 |
Validation | Membership in the Validation set | 1 or 0 |
highlight | Optional annotation | yes or no |
Add one column per set; the basic example uses five.
Download the basic UpSet CSV or gene-set example. Each row should describe one unique item, and every set column should use a consistent true/false representation.
Step 1: Define the sets before plotting
Write down what qualifies an item for each set. For differential-expression lists, that may require an adjusted-p-value and fold-change rule applied consistently across conditions. For cohorts, it may be a documented inclusion criterion. The plot cannot repair inconsistent set definitions.
Step 2: Upload the membership table
Open the UpSet Plot Generator, choose one of the six examples, or upload CSV, TSV, TXT, XLSX, or XLS. Check the preview for duplicate item identifiers, missing membership cells, and columns that were parsed as text unexpectedly.
Step 3: Verify the matrix and bars
Each matrix column represents one intersection. Filled dots show the included sets, and a vertical line connects dots when the intersection involves more than one set. The bar above that column gives its size. Horizontal bars at the left show the total size of each set.
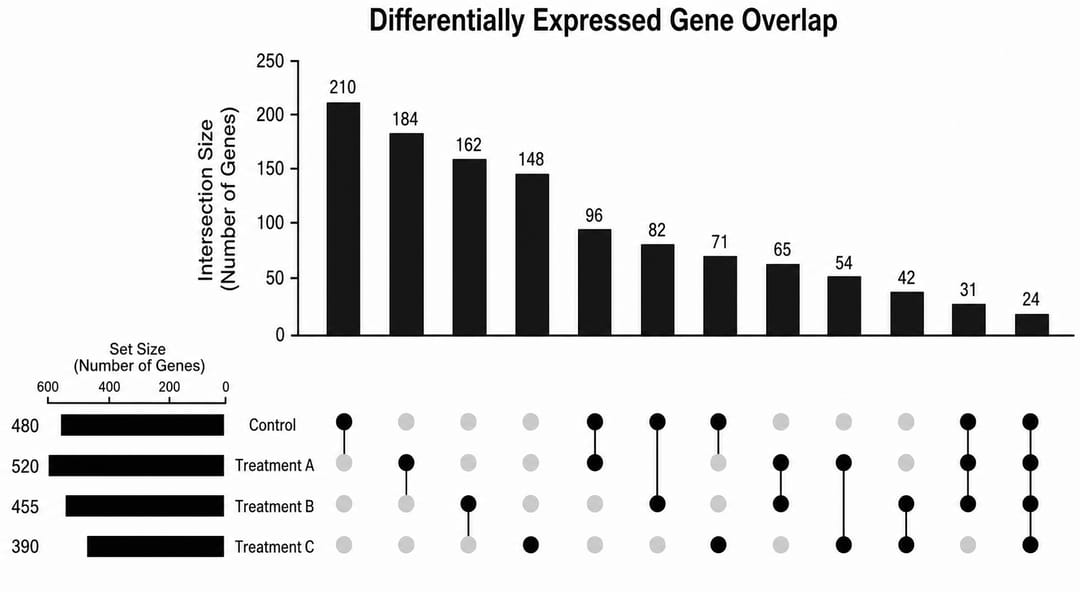
Independently calculate a few important intersections from the source table and confirm the bar heights. This is especially important after filtering or when an item can appear in several source files.
Step 4: Choose a defensible order
Sorting by intersection size helps readers find dominant overlaps. Sorting by degree groups single-set, pairwise, and higher-order intersections. A custom order may be justified when one predefined comparison is central, but it should not be chosen only to make a result look prominent.
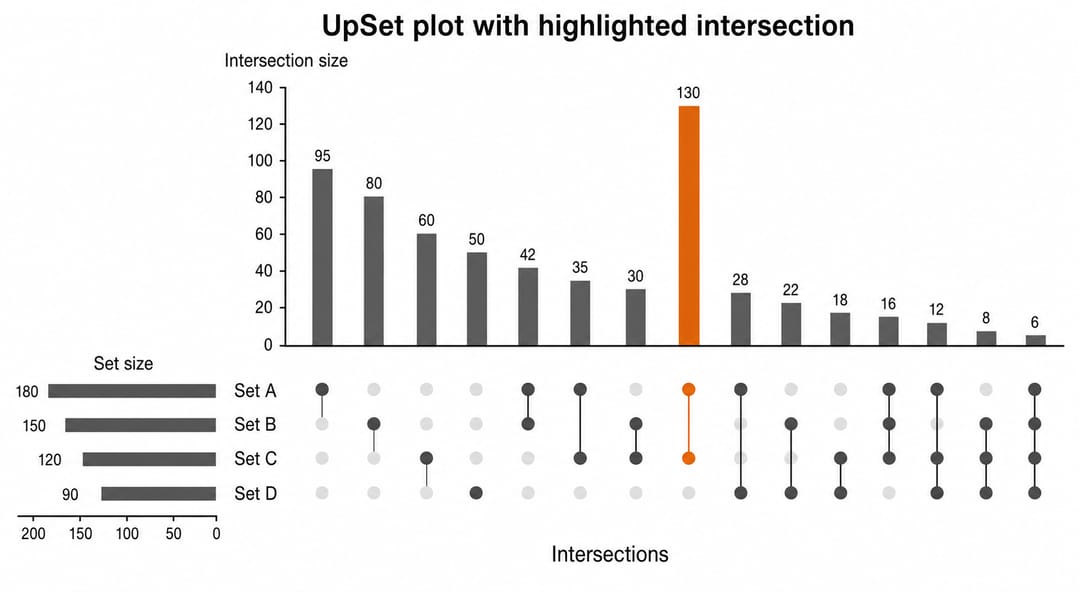
Use SciVis to adjust labels, spacing, and color. Highlight one biologically important intersection while keeping the remaining matrix neutral.
How to read an UpSet plot
Begin at an intersection-size bar, move downward to its dot column, and then read which set rows contain filled dots. A column with filled dots for Treatment A and Treatment B but not Control represents items in that exact combination when the plot uses exclusive intersections.
Set-size bars and intersection-size bars answer different questions. A large set can still have few unique items if most members are shared.
UpSet plot or Venn diagram?
- Use a Venn Diagram Maker for two or three sets when the familiar spatial metaphor is useful.
- Use an UpSet plot for four or more sets, or whenever intersection size must be compared precisely.
- Use a Sankey Diagram Generator when the question concerns movement or flow rather than static membership.
FAQ
Can I make an UpSet plot without R?
Yes. Upload a binary-membership table to the UpSet Plot Generator, generate the figure, and continue editing in SciVis.
Can membership columns use TRUE and FALSE?
Consistent Boolean values can work, but the included examples use 1 and 0 because they are unambiguous across CSV and spreadsheet software.
What is intersection degree?
The degree is the number of sets involved in an intersection. A single filled dot has degree one; three connected filled dots have degree three.
Should I show every possible intersection?
Not necessarily. Large set systems can contain many empty or tiny intersections. Apply and report a transparent minimum-size or top-intersection rule rather than removing inconvenient results manually.
Create the figure
Start with the UpSet Plot Generator, verify the important counts against the membership table, and consult the scientific data visualization guide for related chart choices.