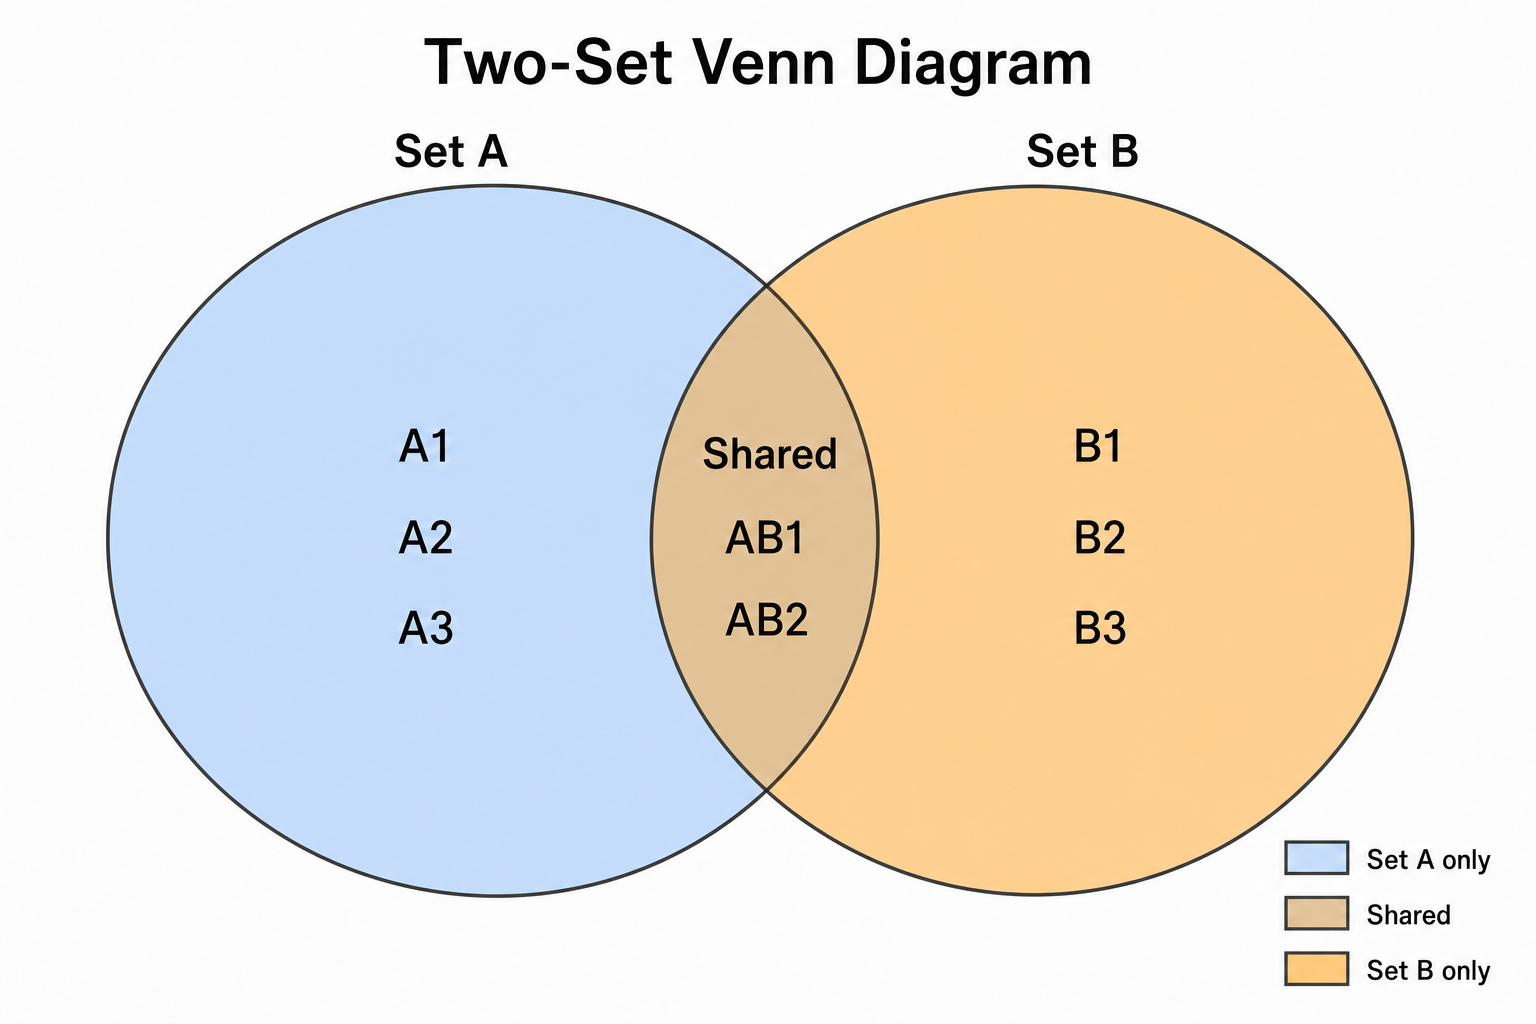
Créateur de diagramme de Venn
Des modèles vierges et des diagrammes de Venn complétés en quelques secondes
Décrivez la comparaison dont vous avez besoin et générez un diagramme de Venn complété, ou un modèle vierge à deux ou trois cercles que les élèves remplissent comme fiche d'exercices.
Exemples de diagrammes de Venn vierges et complétés
Partez d'un exemple prêt à l'emploi ou décrivez le vôtre : de la comparaison complétée au modèle vierge que les élèves remplissent.
Que fait ce créateur de diagramme de Venn ?
Il transforme une description de vos ensembles en un diagramme de Venn net et annoté — ces cercles qui se recouvrent et montrent ce que deux groupes ou plus partagent et ce qui est propre à chacun. Vous décrivez les ensembles, ce qui se recouvre et les éléments ou effectifs qui appartiennent à chaque région, et l'IA dessine des cercles régulièrement espacés, des couleurs de remplissage distinctes, une légende et des annotations lisibles, de sorte que les parties communes et propres ressortent au premier coup d'œil, sans aucun outil de dessin ni alignement manuel. Conçu pour un usage scientifique — recouvrements de gènes et de jeux de données, comparaisons de concepts et d'études — tout en gérant les diagrammes courants à 2 et 3 cercles. La même description donne aussi la version pour la classe : demandez des cercles vides avec des étiquettes à remplir, et vous obtenez une fiche prête à imprimer que les élèves complètent eux-mêmes ; générez ensuite la comparaison remplie, qui servira de corrigé.
Pourquoi utiliser un créateur de diagramme de Venn
- Les diagrammes de Venn sont la façon standard de montrer le recouvrement entre des ensembles dans une seule figure.
- Aligner les cercles, équilibrer les recouvrements et placer les annotations à la main est fastidieux et lent.
- Des régions claires et une légende rendent les éléments communs et propres évidents pour tout lecteur.
- Les chercheurs ont besoin de figures nettes et présentables pour les articles, les posters et les exposés, rapidement.
- Régénérer à partir d'une description est plus rapide que de redessiner à chaque changement d'ensembles, d'annotations ou de couleurs.
Comment réaliser un diagramme de Venn
Déterminez combien d'ensembles vous avez — deux cercles, trois cercles ou plus — et nommez chacun d'eux. Décrivez ce qui est propre à chaque ensemble et ce qu'ils partagent, et énumérez les éléments ou effectifs qui vont dans chaque région, y compris le recouvrement central. Précisez les couleurs et si vous souhaitez une légende. Générez le diagramme, puis vérifiez les annotations, les recouvrements et les couleurs, et affinez jusqu'à ce qu'il corresponde à vos données. Précisez si vous voulez la comparaison déjà remplie ou un modèle vide à compléter par les élèves, et ajoutez « fond blanc, adapté à l'impression » lorsque le diagramme est destiné à une fiche.
Les éléments d'un diagramme de Venn
- Ensembles — chaque cercle (ou ellipse) représente un groupe, avec une annotation claire.
- Régions propres — les parties de chaque cercle qui ne se recouvrent pas.
- Intersections — les zones de recouvrement partagées entre les ensembles.
- Recouvrement central — la région partagée par tous les ensembles dans un diagramme à 3 cercles ou plus.
- Annotations et effectifs — les éléments ou nombres placés à l'intérieur de chaque région.
- Légende et couleurs — des remplissages distincts qui identifient chaque ensemble au premier coup d'œil.
FAQ du créateur de diagramme de Venn
Qu'est-ce qu'un diagramme de Venn ?
Un diagramme de Venn utilise des cercles qui se recouvrent pour montrer les relations entre des ensembles. Chaque cercle est un ensemble, les recouvrements montrent ce que les ensembles partagent et les parties qui ne se recouvrent pas montrent ce qui est propre à chacun — rendant les intersections et les différences faciles à voir dans une seule figure.
Puis-je créer un diagramme de Venn à 2 ou 3 cercles ?
Oui. Indiquez simplement combien d'ensembles vous avez. Le créateur gère un simple diagramme de Venn à 2 cercles, la version standard à 3 cercles avec ses sept régions, et quatre ensembles ou plus dessinés à l'aide d'ellipses pour que chaque recouvrement reste lisible.
Puis-je placer des éléments ou des effectifs dans chaque région ?
Oui. Décrivez ce qui appartient à chaque zone propre et à chaque recouvrement — qu'il s'agisse d'une liste d'éléments ou d'un nombre — et le générateur les place dans la bonne région, y compris l'intersection centrale.
Est-il utile pour des données de recherche ?
Oui. Il est conçu pour un usage scientifique, comme les recouvrements entre ensembles de gènes, jeux de données ou résultats d'études. Annotez chaque cercle avec son groupe et son effectif et décrivez les éléments communs et propres, et le diagramme est prêt pour un panneau de figure.
Puis-je choisir les couleurs et ajouter une légende ?
Oui. Indiquez les couleurs de remplissage de chaque ensemble et demandez une légende dans votre prompt. Le générateur utilise des couleurs distinctes et semi-transparentes pour que les recouvrements se fondent clairement et que chaque ensemble soit facile à identifier.
Puis-je exporter une figure modifiable ?
SciDraw AI peut exporter vers des formats vectoriels afin que vous puissiez ajuster ensuite les annotations, les couleurs et les éléments de chaque région. Vérifiez toujours le diagramme par rapport à vos données avant de le remettre.
Puis-je générer un modèle de diagramme de Venn vierge ?
Oui. Demandez deux ou trois cercles qui se recouvrent, tracés en contours nets, avec un cadre de titre vide et des étiquettes à remplir, et aucun texte à l'intérieur des cercles. Laissez les zones vides et généreuses pour que les élèves aient la place d'écrire.
Puis-je utiliser le diagramme de Venn généré comme fiche d'exercices et comme corrigé ?
Oui. Générez d'abord le modèle vierge et imprimez-le comme fiche ; générez ensuite la même comparaison avec chaque zone remplie, qui servira de corrigé. Nommez les mêmes deux ou trois sujets dans les deux cas pour que le corrigé corresponde à l'exercice.
Vous rédigez un article, une thèse ou une demande de financement ?
SciDraw AI crée aussi des figures de recherche prêtes à publier : résumés graphiques, schémas de mécanisme, workflows et cadres conceptuels.
Découvrir plus d'outils
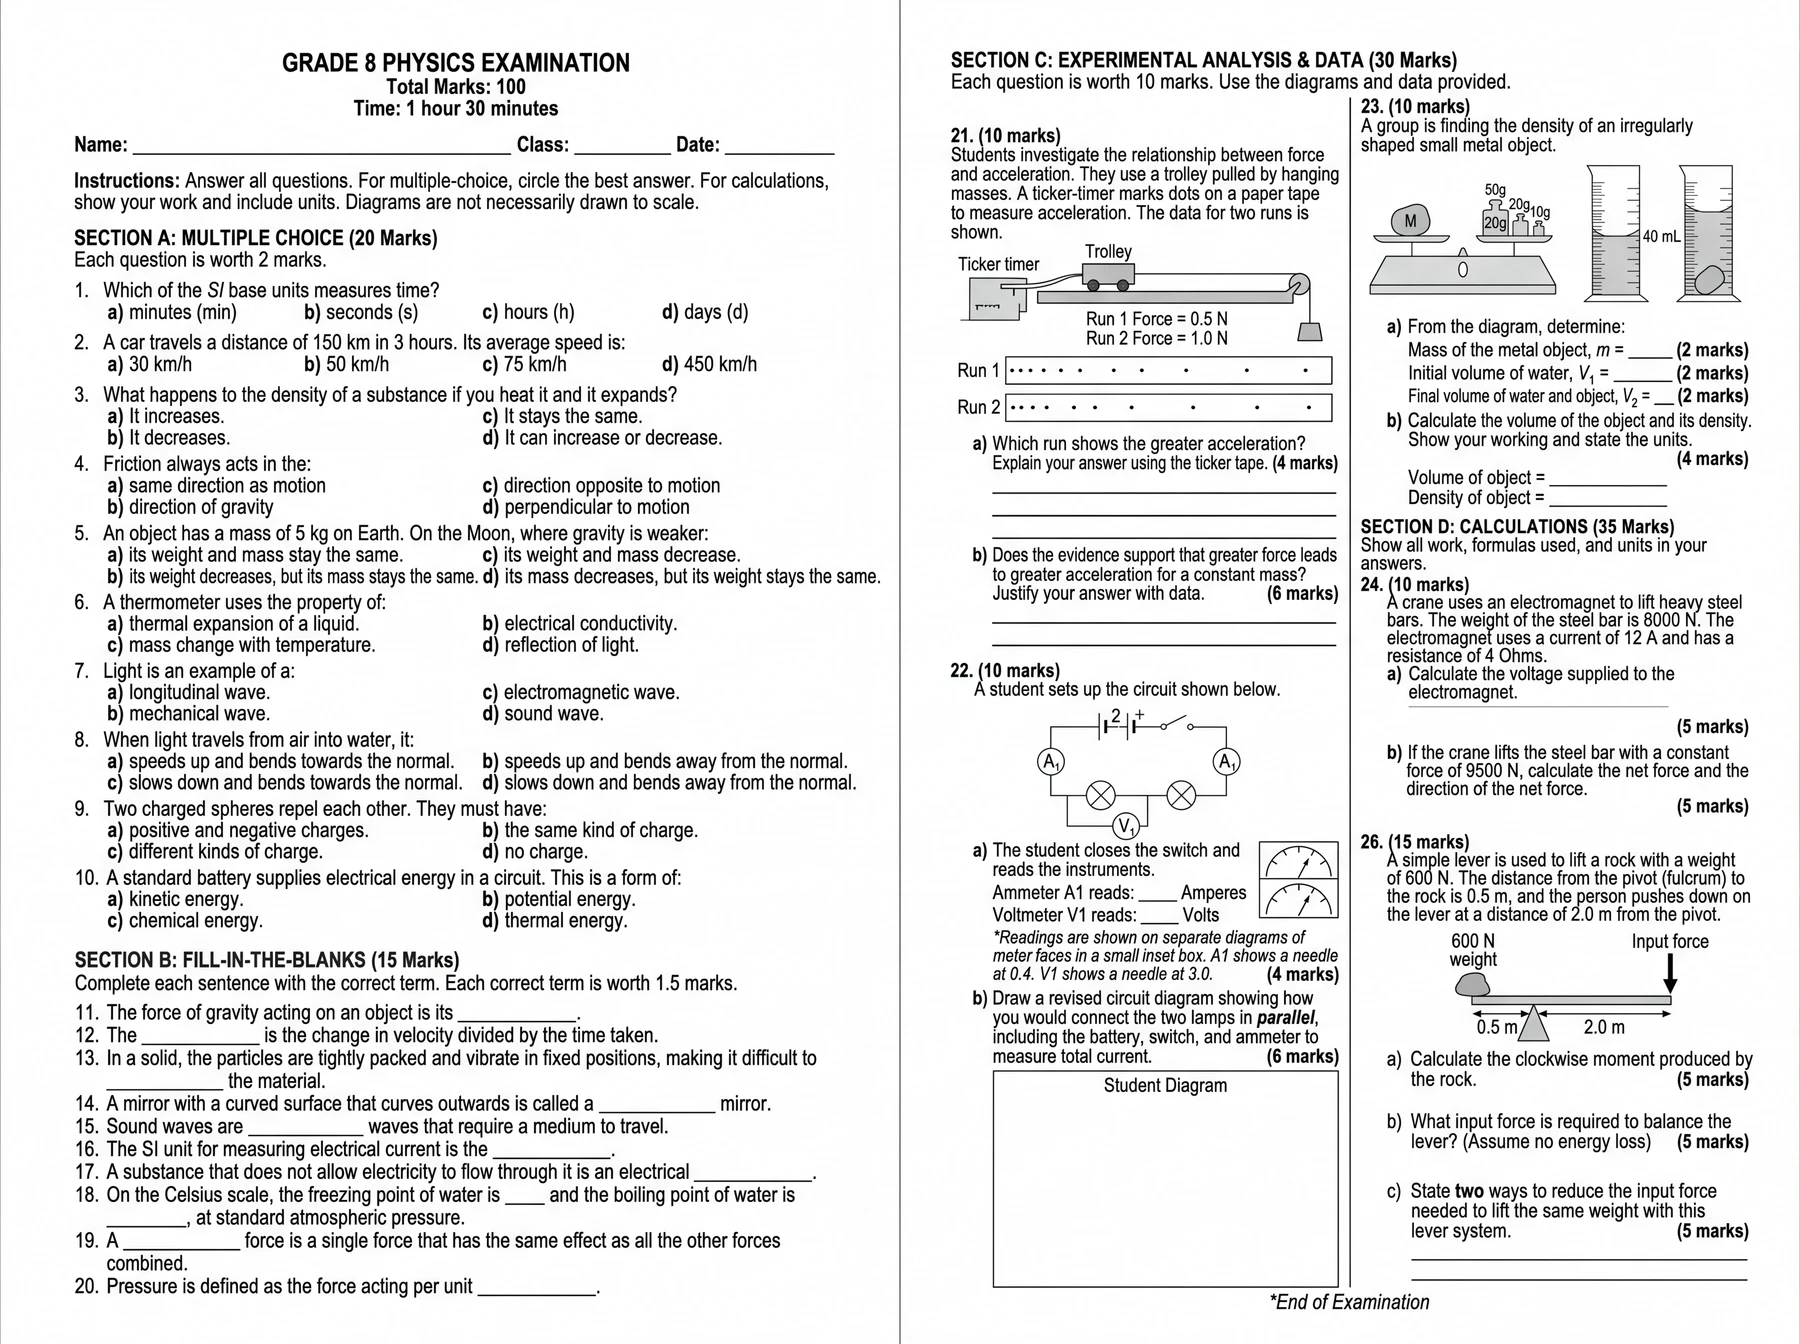
Générateur d'examens et de fiches d'exercices par IA
Une seule consigne. Un sujet d'examen complet.
Essayer gratuitement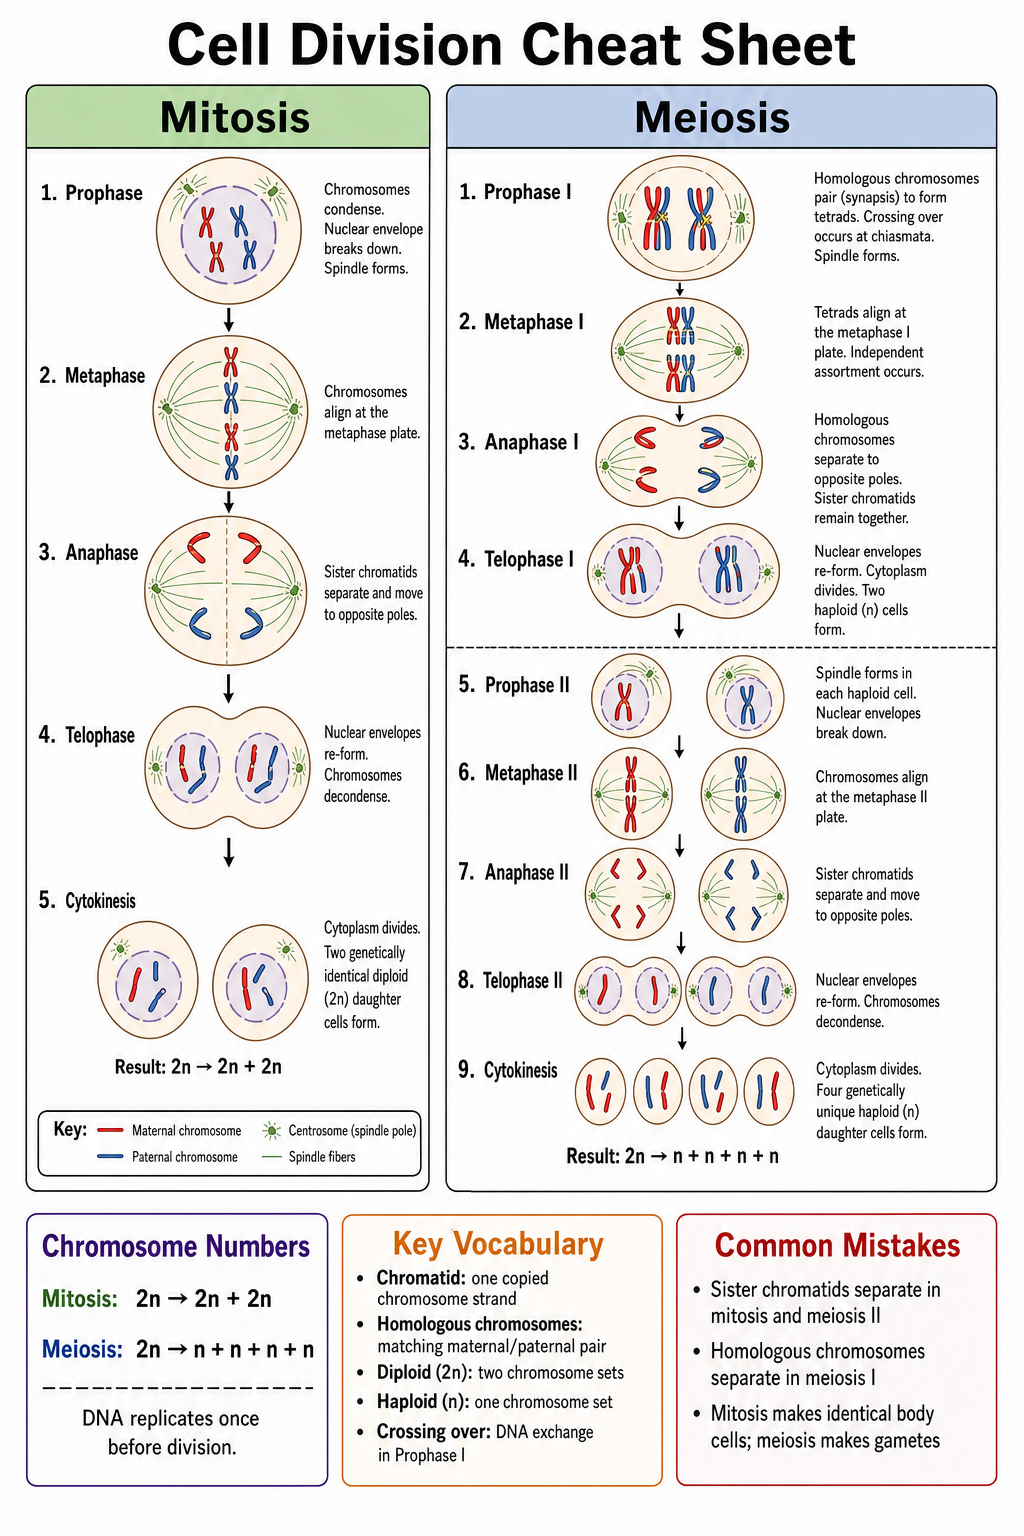
Créateur de fiches de révision par IA
Transformez un sujet ou vos notes en fiche de révision visuelle d'une page pour les examens.
Essayer gratuitement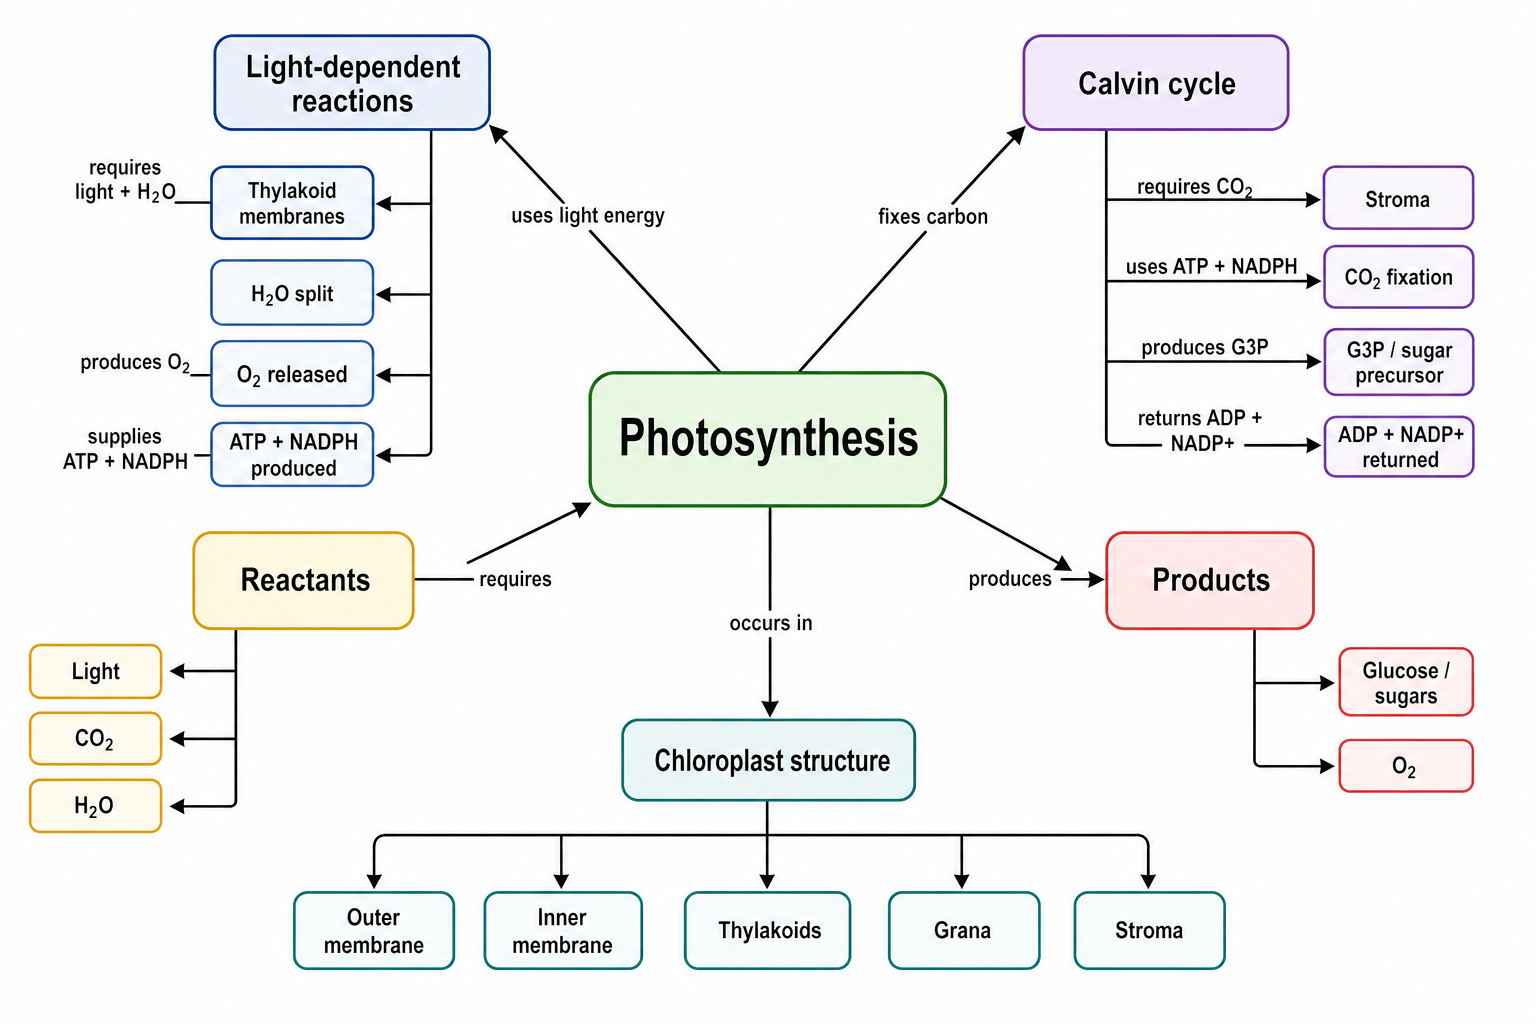
Générateur de cartes conceptuelles
Transformez un sujet scientifique en carte conceptuelle annotée montrant les concepts et leurs relations.
Essayer gratuitementBesoin d'autres figures de recherche ?
Générez un diagramme de Venn complété ou un modèle vierge que les élèves remplissent. Idéal pour les comparaisons en biologie, en français et dans toutes les autres matières.