Com este guia de TOC graphics generator você cria rapidamente a imagem de sumario; comece no Graphical Abstract Maker e finalize o layout no Scientific Figure Maker.
Os gráficos do Sumário (TOC) tornaram-se essenciais para publicações científicas. Esses resumos visuais aparecem ao lado do título do seu artigo em bancos de dados de periódicos, ajudando os leitores a entender rapidamente as descobertas da sua pesquisa. Um gráfico TOC atraente pode aumentar significativamente a visibilidade e a contagem de citações do seu artigo.
Este guia abrangente ensinará tudo sobre como criar gráficos TOC profissionais usando ferramentas com tecnologia de IA como o SciDraw AI.
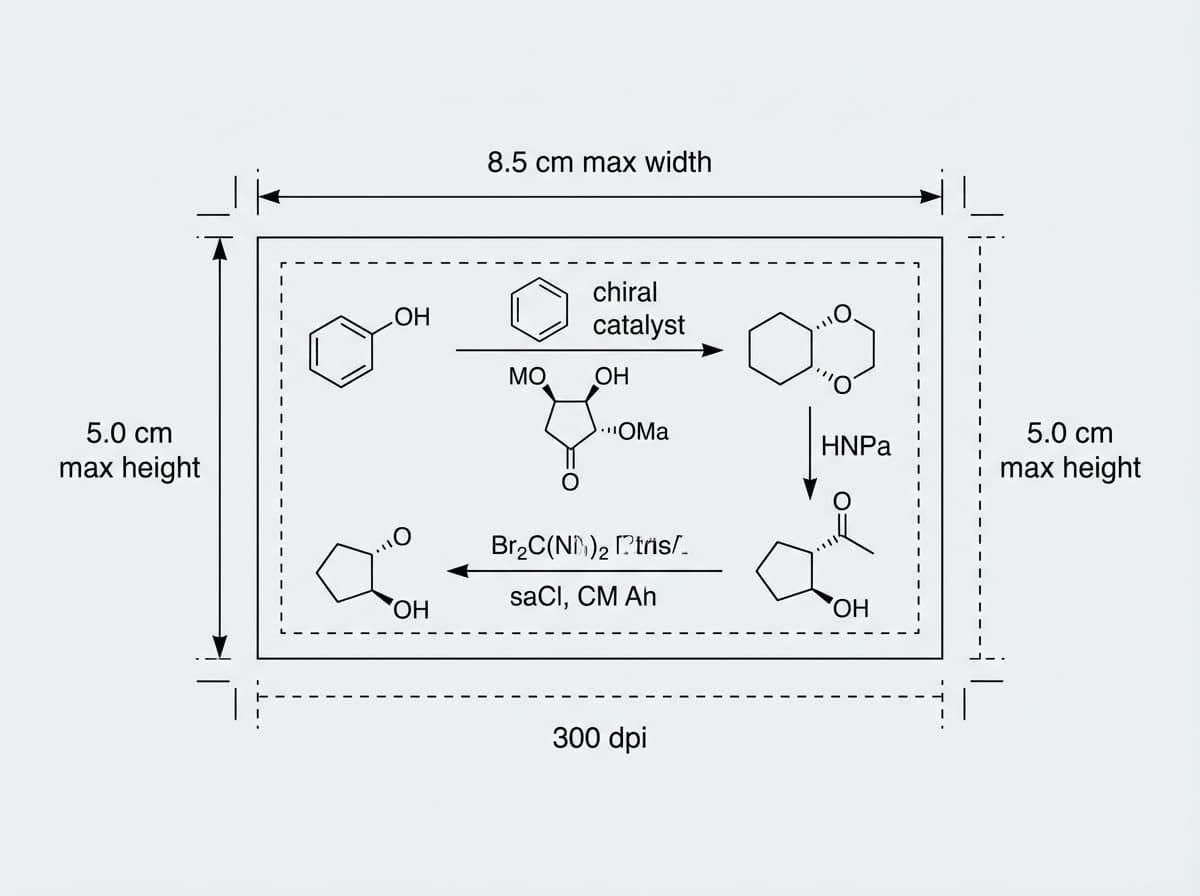
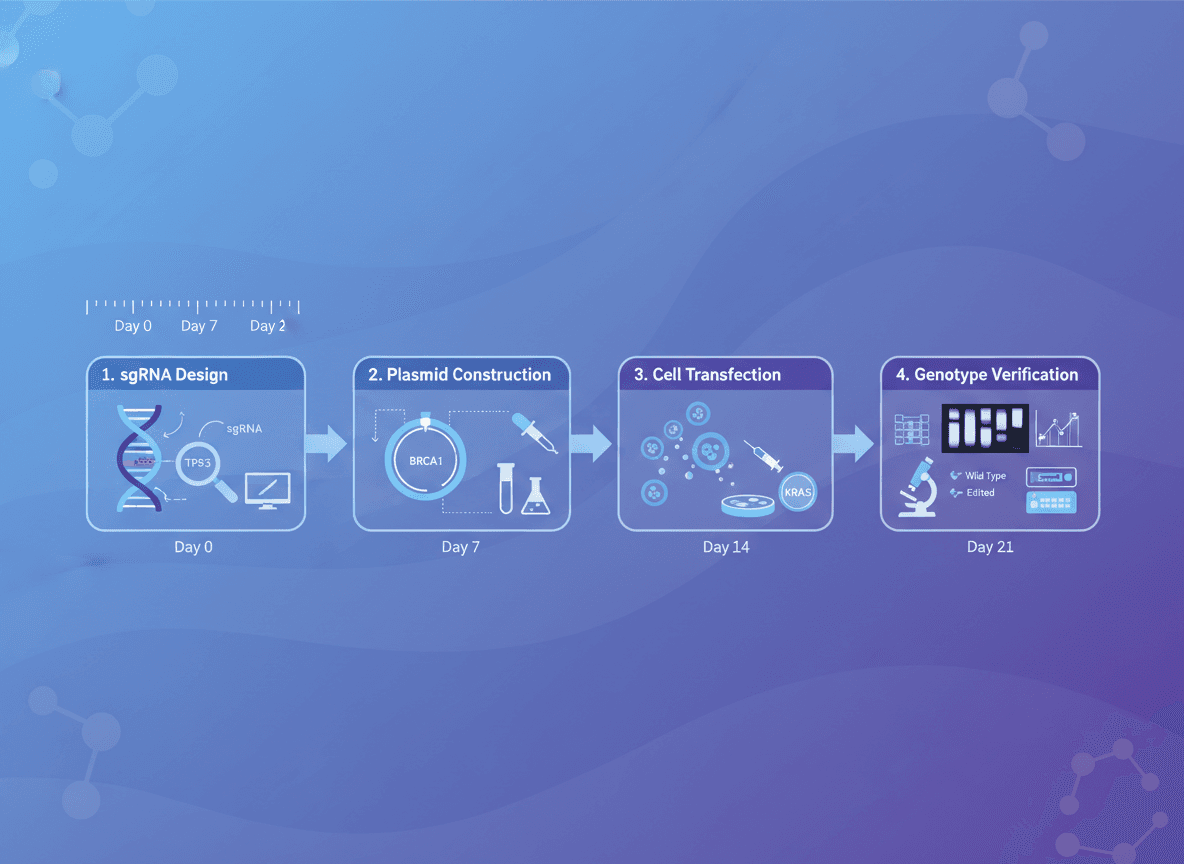
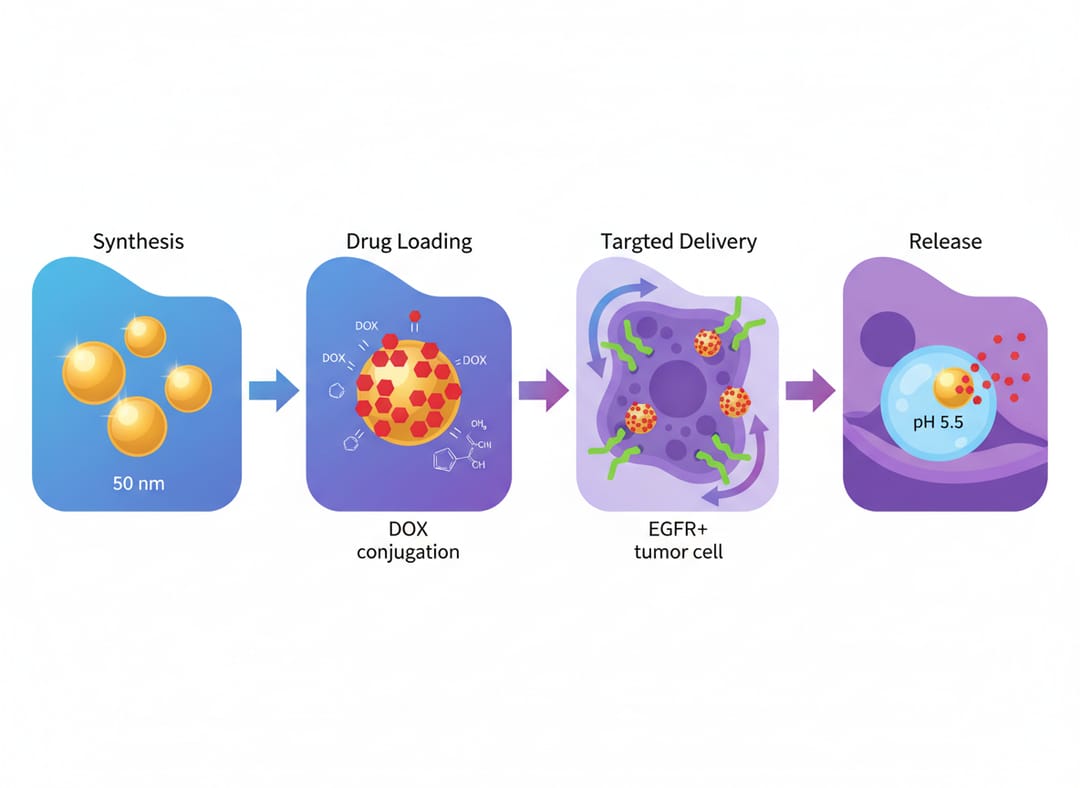 Exemplo de um gráfico TOC pronto para publicação criado com o SciDraw AI
O Que São Gráficos TOC?
Gráficos TOC (também chamados de resumos gráficos ou resumos visuais) são pequenas imagens que resumem seu artigo de pesquisa visualmente. Eles aparecem em:
- Páginas de sumário de periódicos
- Listagens de artigos online
- Resultados de pesquisa em bancos de dados (PubMed, Google Scholar)
- Compartilhamentos em mídias sociais
- Alertas por e-mail para assinantes
Por Que os Gráficos TOC São Importantes
Pesquisas mostram que artigos com resumos visuais atraentes recebem:
- 2-3x mais visualizações em sites de periódicos
- Maior engajamento nas mídias sociais
- Taxas de citação aumentadas
- Melhor capacidade de descoberta nos resultados de pesquisa
Requisitos de Periódicos para Gráficos TOC
Diferentes editoras têm requisitos específicos para gráficos TOC:
ACS (American Chemical Society)
- Tamanho: 3,25 × 1,75 polegadas (827 × 445 pixels)
- Formato: TIFF ou EPS
- Resolução: 300 DPI mínimo
- Proporção: Aproximadamente 2:1 paisagem
RSC (Royal Society of Chemistry)
- Tamanho: 8,5 × 4,75 cm
- Formato: TIFF
- Resolução: 600 DPI recomendado
Wiley
- Tamanho: Varia de acordo com o periódico
- Formato: TIFF, EPS ou JPEG de alta resolução
- Proporção: 16:9 ou 4:3 recomendado
Nature/Science
- Formato: TIFF ou EPS de alta resolução
- Resolução: 300-600 DPI
- Estilo: Limpo, profissional, texto mínimo
Como Criar Gráficos TOC com IA
Criar gráficos TOC profissionais tradicionalmente exigia software caro e habilidades de design. Ferramentas de IA como o SciDraw AI revolucionaram este processo.
Passo 1: Defina Sua Mensagem Chave
Antes de gerar qualquer imagem, identifique:
- A descoberta mais importante do seu artigo
- A metáfora visual que melhor a representa
- Principais moléculas, estruturas ou processos a incluir
Passo 2: Escreva um Prompt Eficaz
Um bom prompt para gráficos TOC deve incluir:
[Assunto principal] + [Contexto científico] + [Estilo visual] + [Especificações técnicas]Exemplo de prompt:
Graphical abstract showing CRISPR-Cas9 gene editing mechanism,
DNA double helix being cut by Cas9 protein scissors,
guide RNA highlighted in blue, target sequence in red,
clean white background, minimal design,
4:3 landscape format, scientific illustration style,
suitable for Nature journal TOC graphic
Passo 3: Selecione Modelos Apropriados
O SciDraw AI oferece modelos especializados para gráficos TOC:
- TOC Graphical Abstract: Otimizado para requisitos de periódicos
- Mechanism Illustration: Perfeito para mecanismos de reação
- Process Diagram: Ideal para fluxos de trabalho e caminhos
Passo 4: Escolha um Estilo Visual
Combine seu estilo com o seu periódico alvo:
- Flat Illustration: Visual limpo e moderno para periódicos de alto impacto
- Scientific Illustration: Representações detalhadas e realistas
- Isometric 3D: Adiciona profundidade para estruturas complexas
- Minimalist: Máxima clareza com elementos mínimos
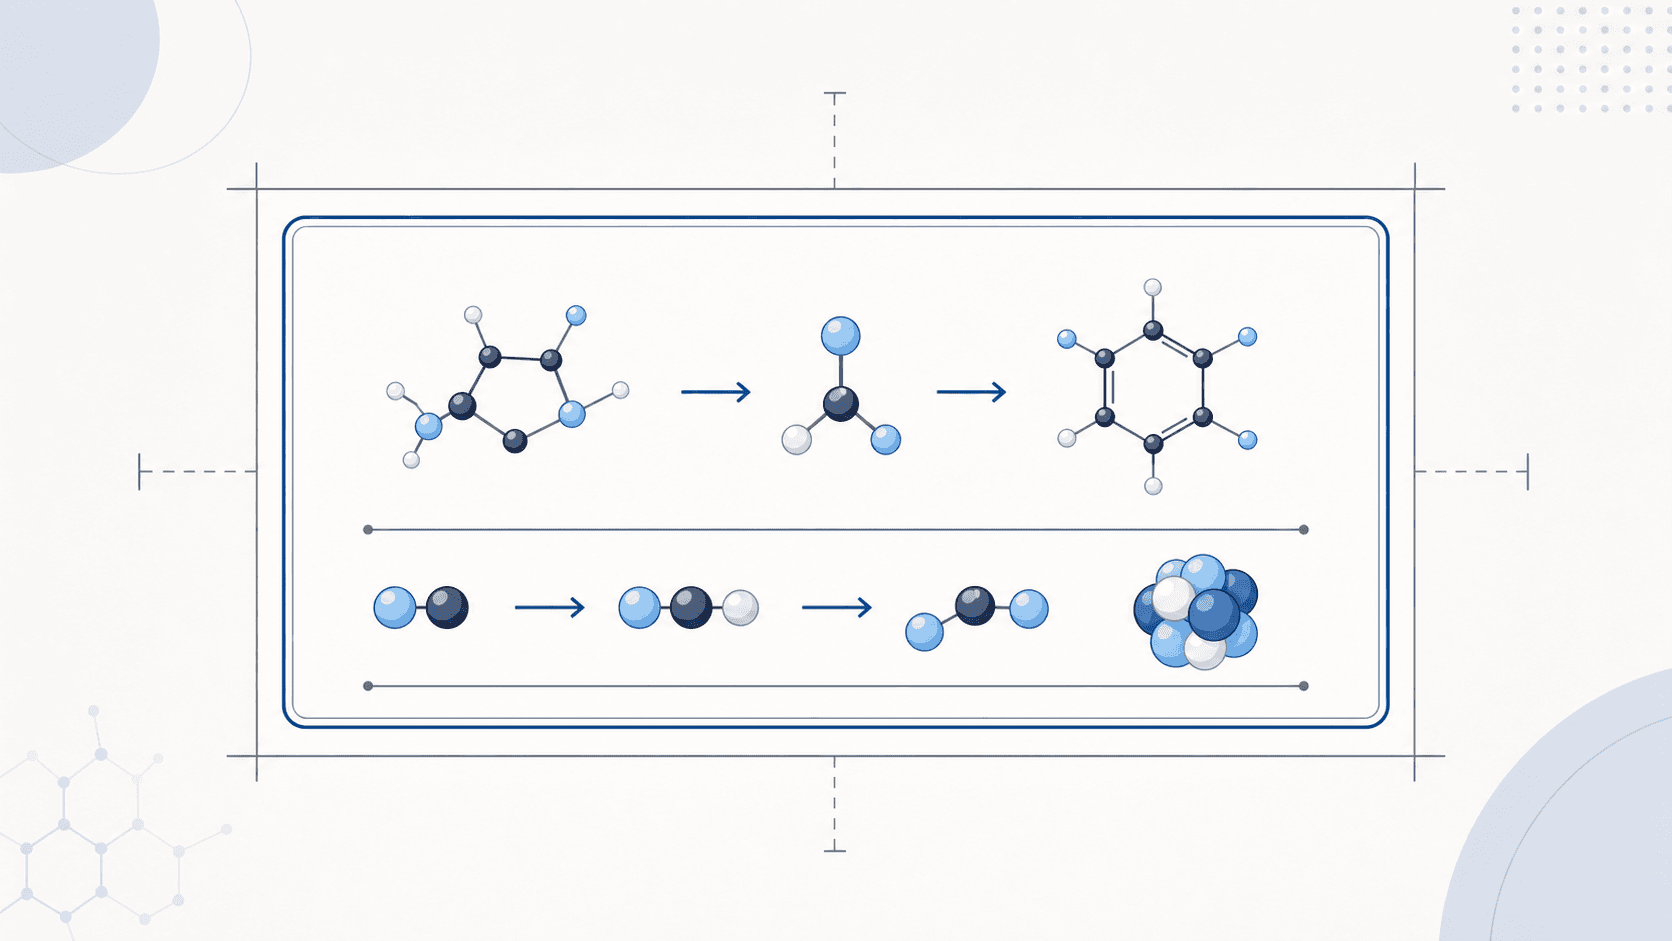
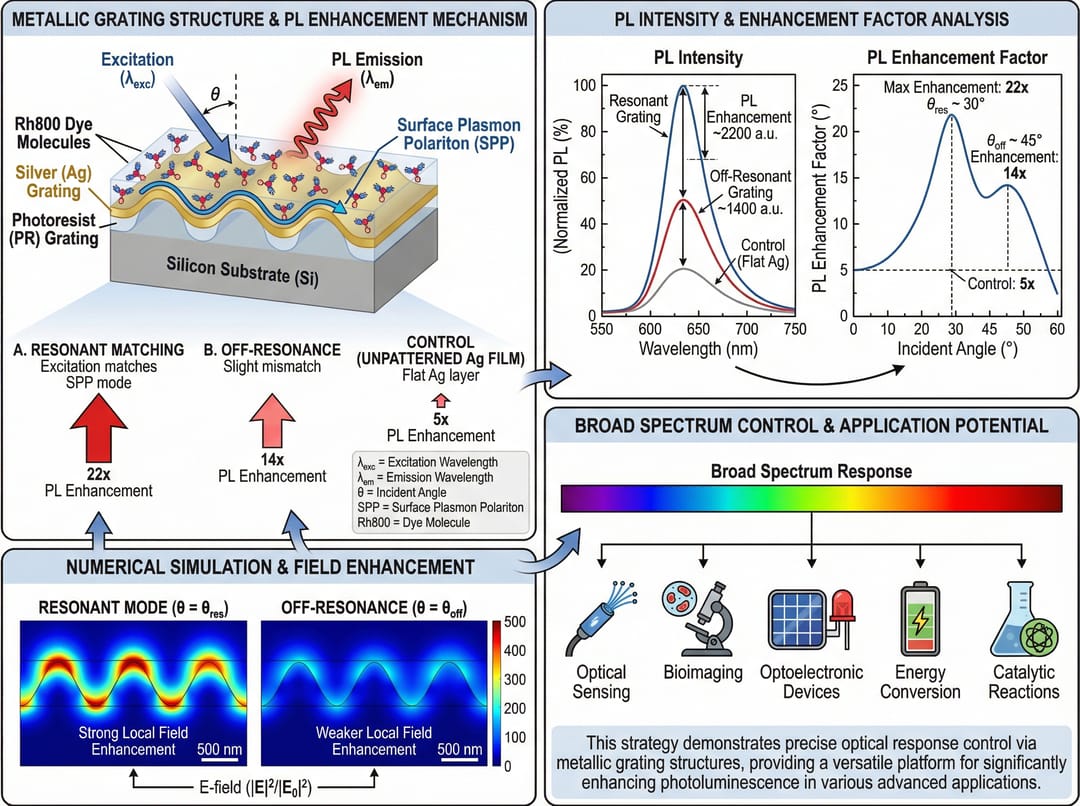 Diferentes estilos de ilustração disponíveis no SciDraw AI
Melhores Práticas para Gráficos TOC
FAÇA:
- Mantenha simples: Um conceito principal por gráfico
- Use rótulos claros: Legíveis em tamanhos pequenos
- Mantenha a consistência: Combine com as figuras do seu artigo
- Inclua resultados chave: Números, porcentagens, melhorias
- Teste no tamanho real: Os leitores entenderão quando pequeno?
NÃO FAÇA:
- Entulhe muita informação
- Use texto minúsculo que se torna ilegível
- Inclua imagens protegidas por direitos autorais
- Esqueça de verificar as diretrizes do periódico
- Envie imagens de baixa resolução
Exemplos de Gráficos TOC por Área
Química
Concentre-se em estruturas moleculares, esquemas de reação e mecanismos:
Organic synthesis TOC graphic showing retrosynthetic analysis,
target molecule center with disconnection arrows,
key building blocks labeled with prices,
reaction conditions "Pd catalyst, 80°C, 12h",
yield percentage "92% yield" highlighted,
clean white background, chemistry journal style
Biologia
Enfatize processos celulares, vias e organismos:
Cell signaling pathway TOC graphic,
receptor activation to gene expression cascade,
membrane receptor, kinase cascade, transcription factors,
key proteins labeled "RTK, RAS, MAPK, ERK",
nucleus with DNA and mRNA output,
cell biology journal style, 4:3 format
Ciência dos Materiais
Destaque estruturas, propriedades e aplicações:
Nanomaterial synthesis and application TOC graphic,
left: synthesis process with precursors,
center: nanoparticle structure with size "50 nm",
right: application in solar cell,
efficiency improvement "η = 23.5%",
materials science journal format
Erros Comuns a Evitar
- Muito texto: Gráficos TOC são resumos visuais, não resumos
- Dimensões erradas: Sempre verifique os requisitos do periódico
- Baixo contraste: Garanta a visibilidade em fundos brancos
- Falta de contexto: Inclua informações suficientes para entender o conceito
- Estilo inconsistente: Combine com a estética do seu periódico alvo
Comece a Criar Seus Gráficos TOC
Pronto para criar gráficos TOC prontos para publicação? A plataforma com tecnologia de IA do SciDraw AI pode ajudá-lo a gerar visuais profissionais em minutos:
- Visite SciDraw AI Drawing
- Selecione o modelo "TOC Graphical Abstract"
- Descreva as descobertas da sua pesquisa
- Gere e baixe seu gráfico TOC
Com a assistência da IA, você pode se concentrar em sua pesquisa, garantindo que suas publicações tenham o impacto visual que merecem.
Artigos Relacionados:
- How to Write Effective AI Prompts for Scientific Illustrations (Como Escrever Prompts de IA Eficazes para Ilustrações Científicas)
- Getting Started with SciDraw AI: 3 AI Drawing Modes Explained (Começando com o SciDraw AI: 3 Modos de Desenho de IA Explicados)
FAQ
Qual e a forma mais rápida de TOC graphics generator?
Comece com um rascunho focado e evolua em iteracoes curtas. Para resultados prontos para periódicos, combine AI Scientific Illustration com Scientific Figure Maker.
Como manter compatibilidade com requisitos editoriais?
Defina tamanho e DPI no inicio, revise rotulos antes da exportação e mantenha um arquivo editável para revisoes.
Qual página devo abrir depois deste guia?
Para visuais conceituais rapidos use Graphical Abstract Maker e para comparar recursos e preco veja BioRender Alternative.