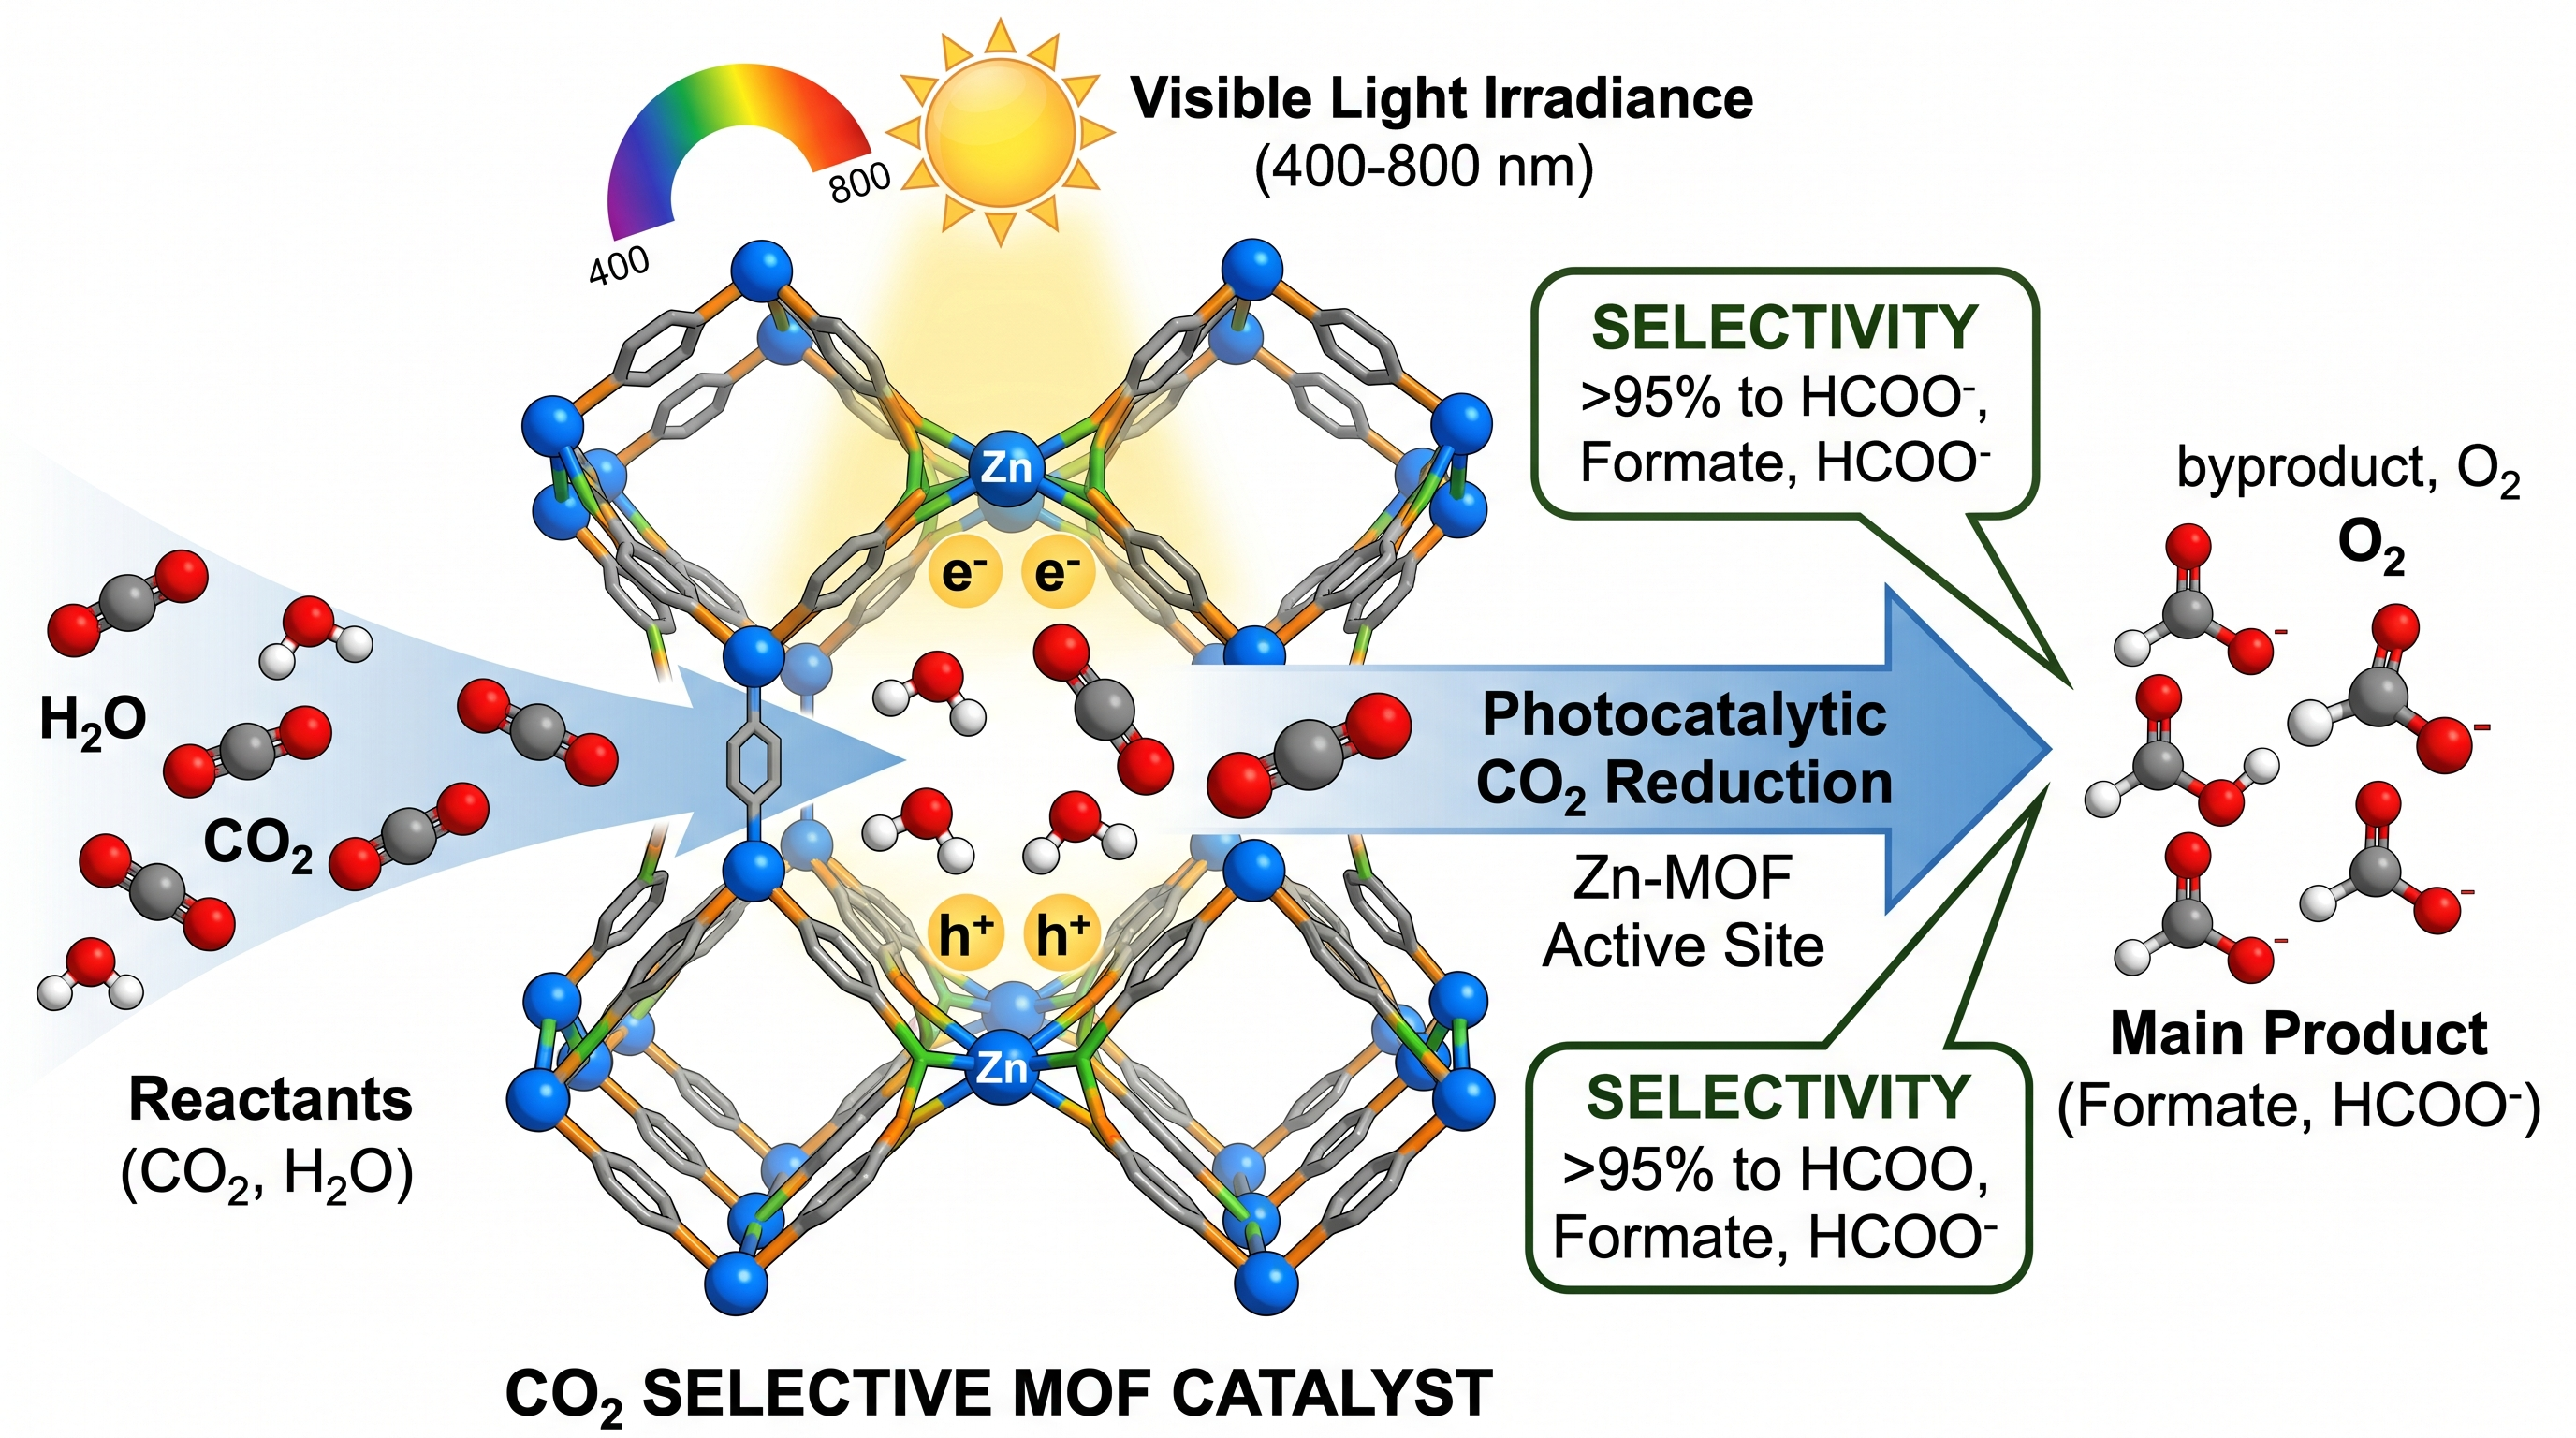
Generatore Gratuito di Grafica TOC
Crea una grafica per il sommario di una rivista scientifica dal testo
Descrivi il risultato chiave del tuo articolo e l'AI genera una grafica TOC compatta e pronta per la pubblicazione — la figura incorniciata che riviste come ACS, RSC, Wiley ed Elsevier mostrano accanto al tuo articolo nel loro sommario.
Esempi di grafica TOC
Clicca su un esempio per caricare il suo prompt, o adattalo come punto di partenza per la tua grafica del sommario.
Cosa fa questo generatore di grafica TOC?
Converte una descrizione in testo semplice del risultato centrale del tuo articolo in una figura per il sommario (TOC) grafica rifinita — la piccola immagine incorniciata che le riviste mostrano accanto al titolo del tuo articolo nel loro sommario online e cartaceo. Descrivi le molecole chiave, le strutture, i processi o i concetti, e l'AI li compone in un'immagine pulita ed etichettata che soddisfa i requisiti tipici di dimensioni e stile delle riviste, senza software di illustrazione.
Perché usare un generatore di grafica TOC
- La maggior parte delle riviste di chimica, scienza dei materiali e scienze biologiche richiede o incoraggia fortemente una grafica TOC come parte del pacchetto di invio.
- Creare illustrazioni scientifiche di qualità editoriale in strumenti come Adobe Illustrator o ChemDraw richiede molto tempo, specialmente sotto le scadenze di invio.
- Una grafica TOC ben progettata aumenta il tasso di clic e citazione rendendo immediatamente visibile il contributo del tuo articolo a chi naviga il sommario.
- Iterare su layout, colori e posizionamento delle etichette è molto più veloce da una descrizione testuale che riorganizzare i livelli in software di disegno.
- I ricercatori senza formazione illustrativa formale possono produrre grafiche che corrispondono agli standard visivi delle migliori riviste.
Come creare una grafica TOC
Scrivi una o due frasi che catturano la singola idea visiva più importante del tuo articolo — la molecola chiave, la reazione, il dispositivo, il meccanismo o il confronto. Includi le strutture, le etichette o le annotazioni specifiche necessarie (es. nomi dei composti, frecce di reazione, valori di misura). Facoltativamente specifica una palette di colori o uno stile (minimale, schematico, renderizzato in 3D). Genera l'immagine, poi confrontala con le specifiche TOC della rivista target (dimensioni tipiche: 8 × 4 cm o 3,25 × 1,75 pollici, 300 dpi). Raffina la descrizione e rigenera finché la figura comunica chiaramente il tuo risultato in un solo colpo d'occhio.
Parti di una grafica TOC per rivista
- Motivo visivo centrale — la molecola, il dispositivo, lo schema di reazione o il processo che incarna il risultato chiave dell'articolo.
- Freccia di reazione o processo — indica direzionalità, trasformazione o meccanismo quando rilevante.
- Strutture chimiche o formule — disegnate in notazione scheletrica standard o con sfere e bastoncini 3D.
- Annotazioni e callout — etichette per gruppi funzionali chiave, valori di misura o caratteristiche evidenziate.
- Codifica a colori — tonalità o ombreggiature distinte per differenziare reagenti, prodotti, fasi o componenti.
- Cornice e spazio bianco — un bordo pulito e un padding adeguato assicurano che la grafica sia ben leggibile in formato miniatura.
FAQ sul Generatore di Grafica TOC
Che cos'è una grafica per il sommario (TOC graphic)?
Una grafica TOC (chiamata anche TOC art o abstract visivo) è una piccola figura autonoma che sintetizza il risultato chiave di un articolo scientifico in un'unica immagine. Appare accanto al titolo dell'articolo nel sommario online e cartaceo della rivista, aiutando i lettori a decidere rapidamente se leggere l'intero articolo.
Quali riviste richiedono una grafica TOC?
Molte riviste di punta in chimica, scienza dei materiali e biologia richiedono o accettano grafiche TOC, incluse le riviste ACS (JACS, ACS Nano, ecc.), le riviste RSC (Chemical Science, Nanoscale), le riviste Wiley (Angewandte Chemie, Advanced Materials) e i titoli Elsevier. Controlla le linee guida per gli autori della rivista target per i requisiti esatti di dimensioni, risoluzione e formato del file.
Quali dimensioni e risoluzione deve avere una grafica TOC?
Le specifiche comuni sono circa 8 × 4 cm (3,25 × 1,75 pollici) a 300 dpi per la stampa, o equivalente in pixel come 1300 × 650 px. Le riviste ACS, ad esempio, specificano 8,5 × 4,75 cm. Controlla sempre le istruzioni per gli autori della rivista specifica prima di finalizzare.
Posso includere strutture chimiche nella grafica TOC?
Sì — descrivi la struttura nel tuo prompt (es. «formula scheletrica della caffeina con il sistema ad anello xantinico etichettato») e l'AI la renderizzerà. Per nomi IUPAC complessi o InChI/SMILES specifici, includere una descrizione in linguaggio semplice delle caratteristiche strutturali chiave produce i risultati più chiari.
Qual è la differenza tra una grafica TOC e un abstract grafico?
Una grafica TOC è tipicamente più piccola e compatta — progettata per essere leggibile chiaramente in formato miniatura nel sommario di una rivista. Un abstract grafico può essere più grande e includere più dettagli, assomigliando talvolta a un mini-poster. Alcune riviste usano i termini in modo intercambiabile; altre li trattano come elementi di invio distinti.
Il generatore è gratuito da usare?
Ogni generazione utilizza un piccolo numero di crediti. I nuovi account ricevono crediti gratuiti alla registrazione, quindi puoi creare la tua prima grafica TOC senza abbonamento.
Scopri altri strumenti
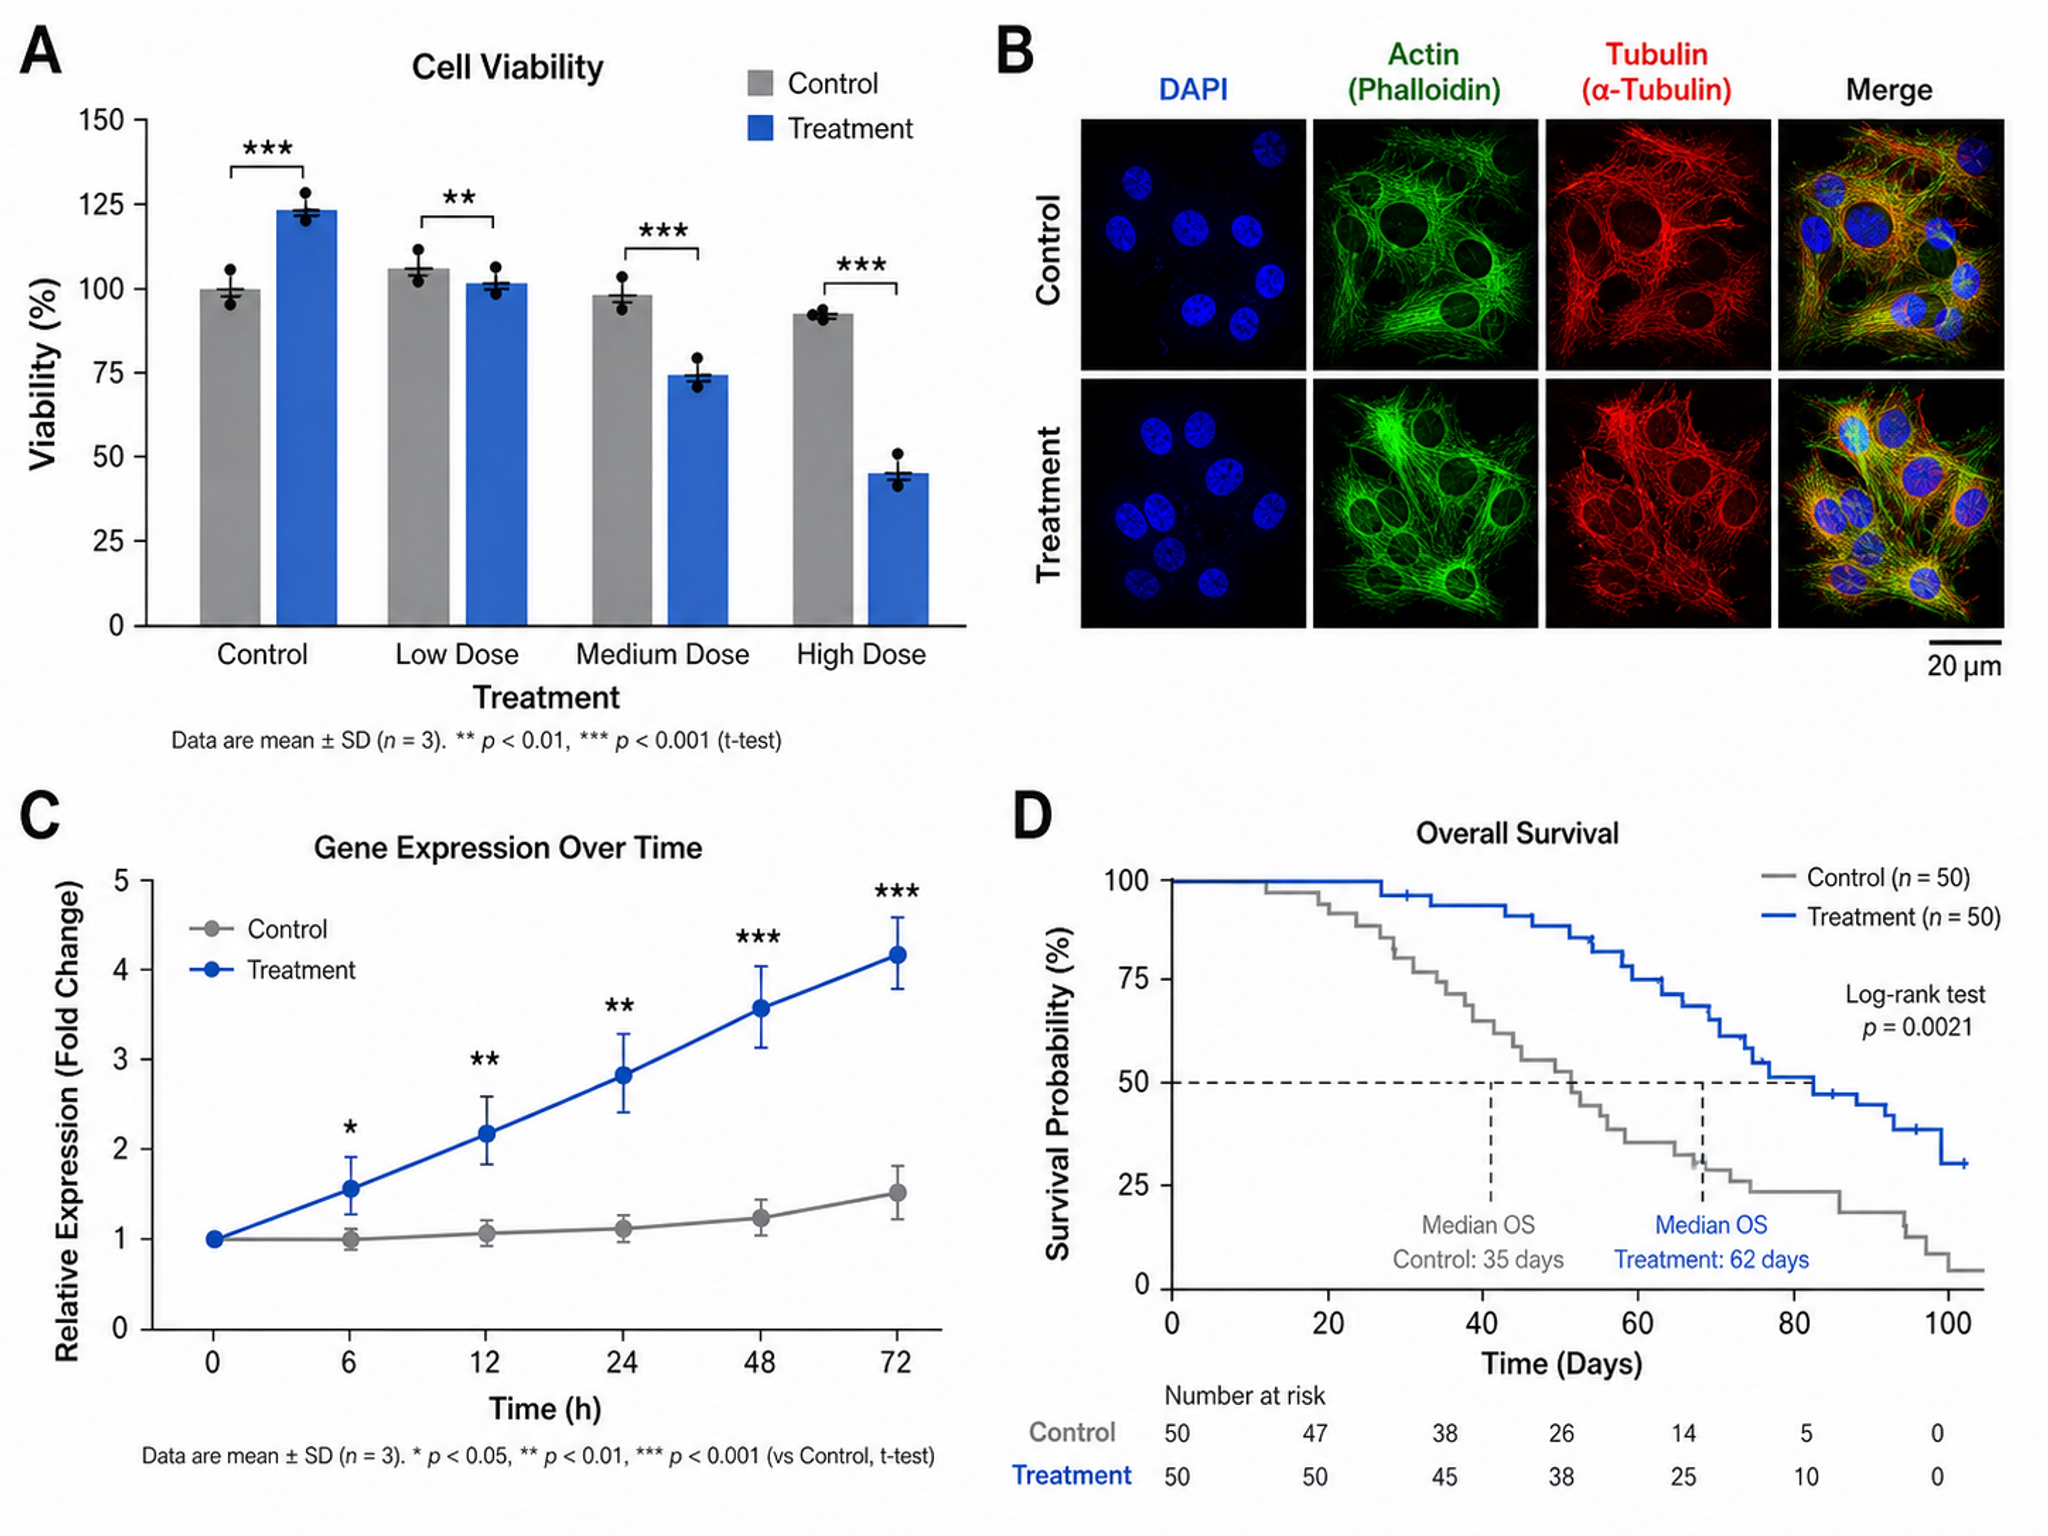
Creatore di Figure Scientifiche
Crea figure pronte per la pubblicazione per articoli di ricerca
Provalo gratis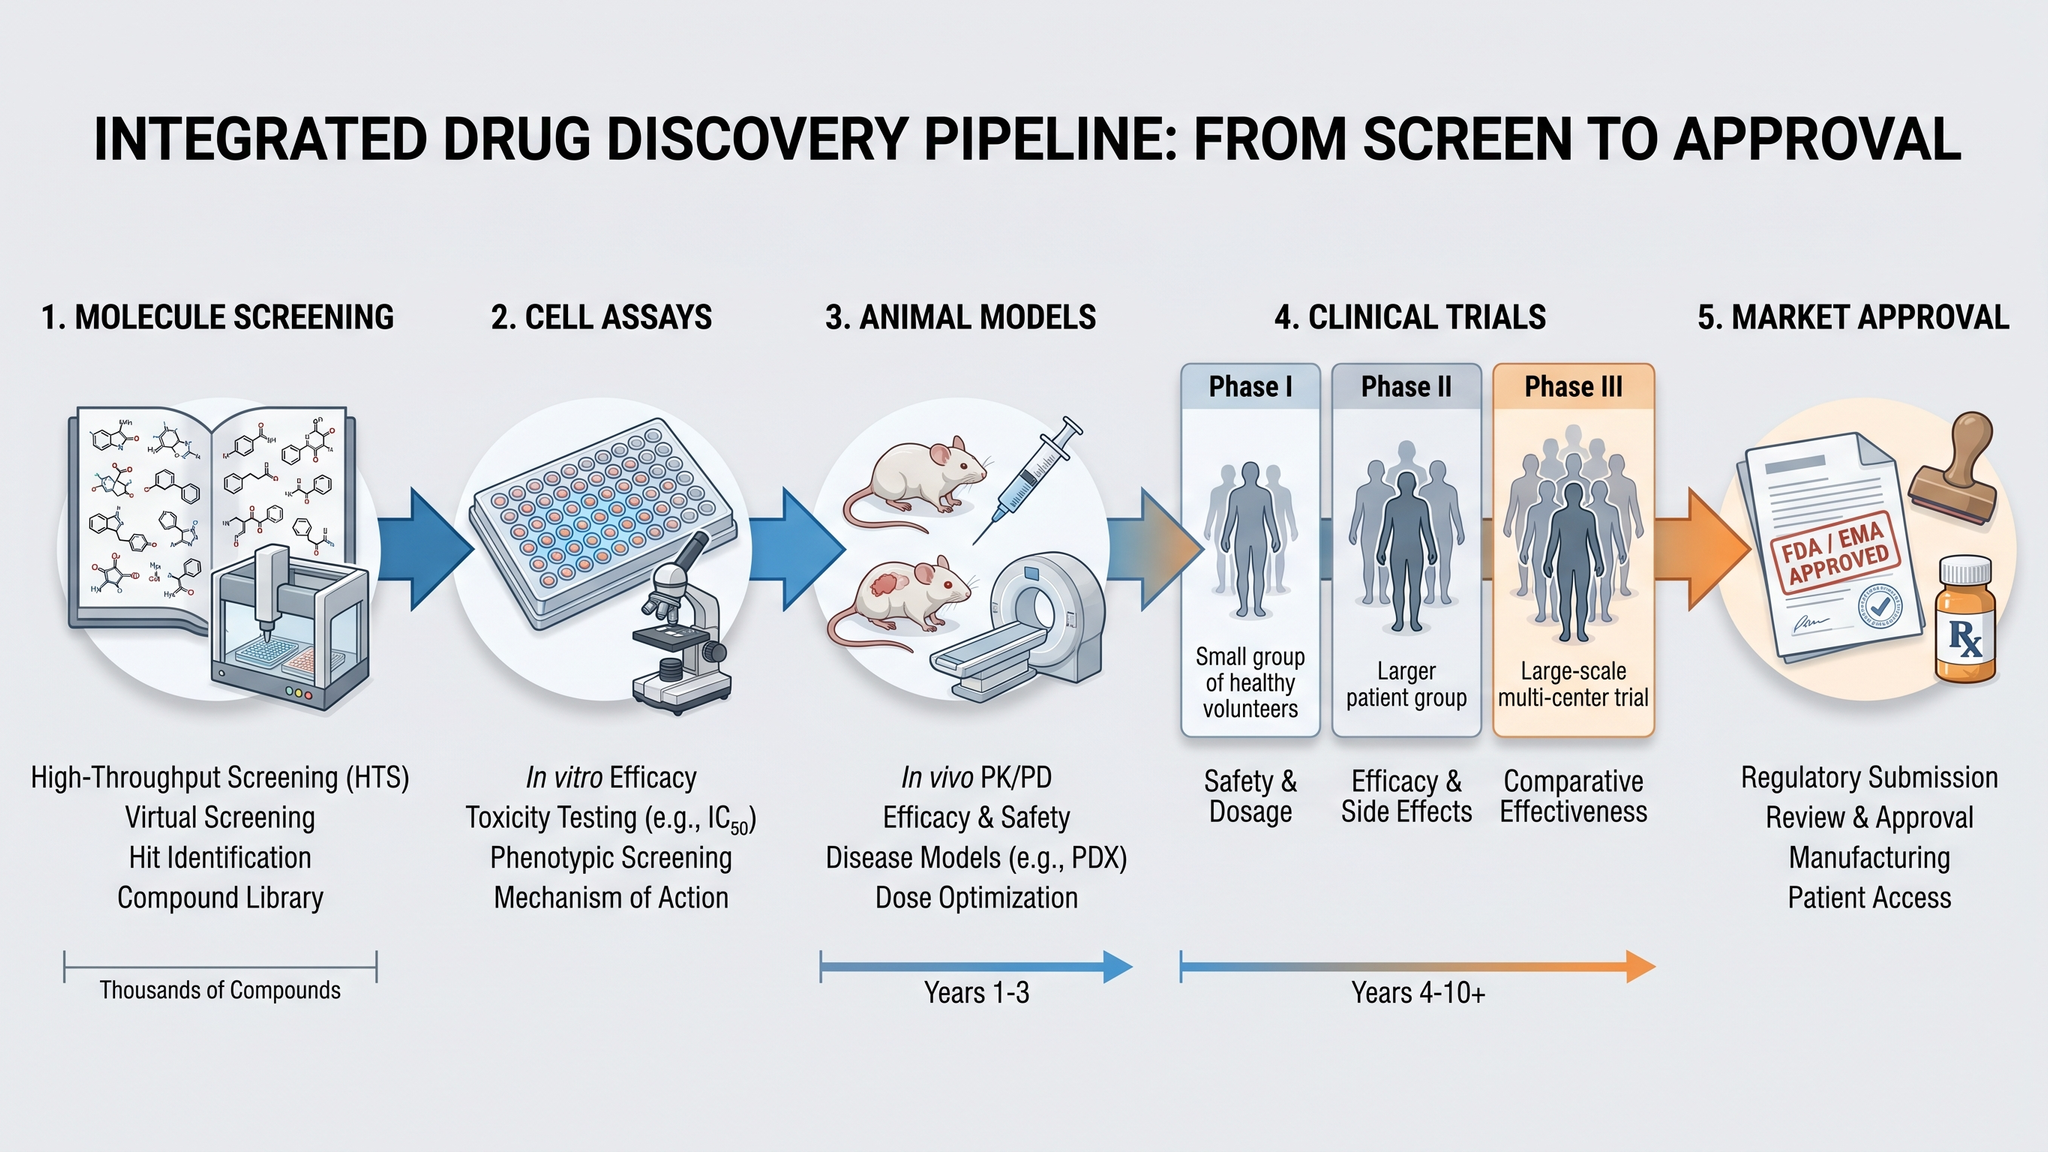
Creatore di Abstract Grafici
Crea abstract grafici eleganti per le tue pubblicazioni
Provalo gratis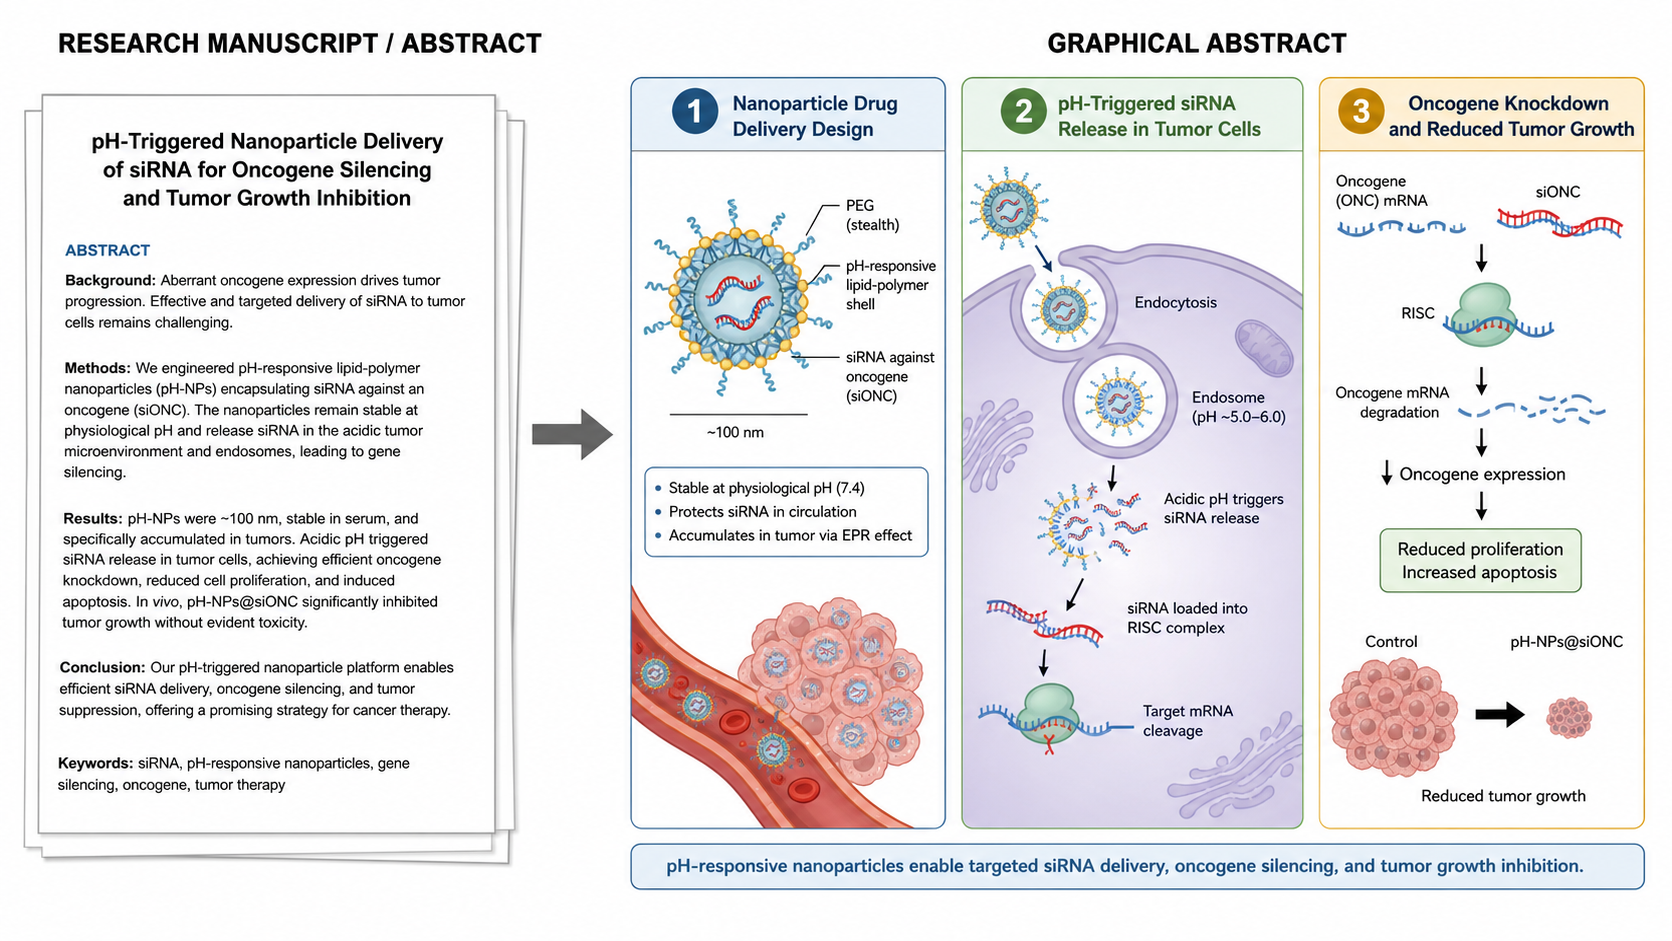
Generatore di figure da manoscritto
Strumento IA per Generatore di figure da manoscritto, con struttura chiara, etichette e layout esportabile.
Provalo gratisHai bisogno di altre figure scientifiche?
Genera schemi di reazione, diagrammi proteici, grafici di dati e altro ancora con SciDraw AI.