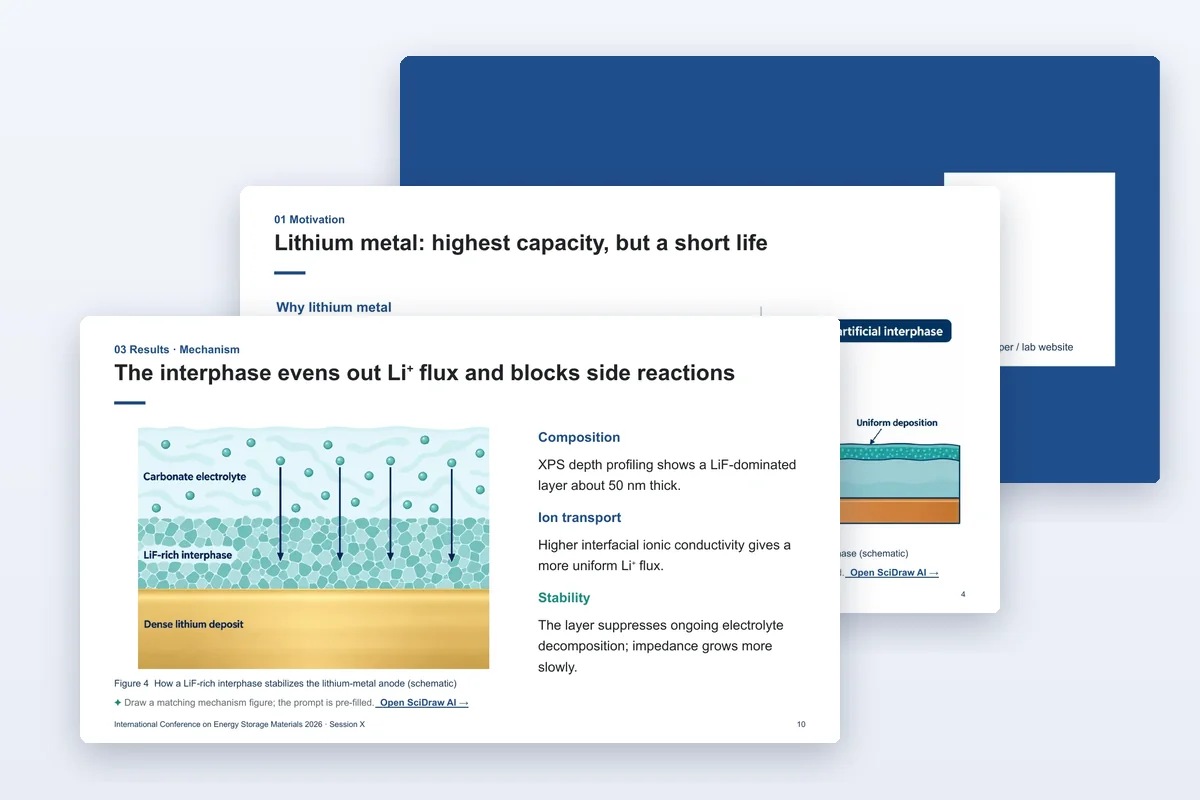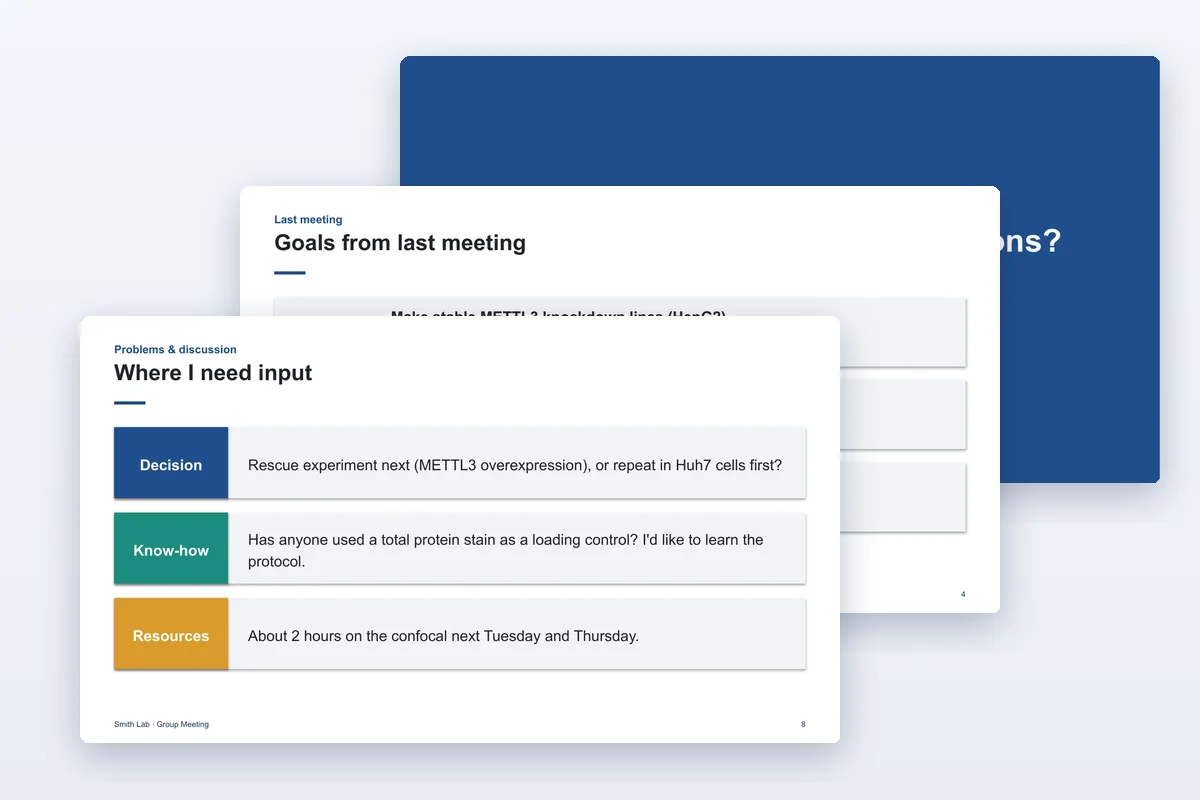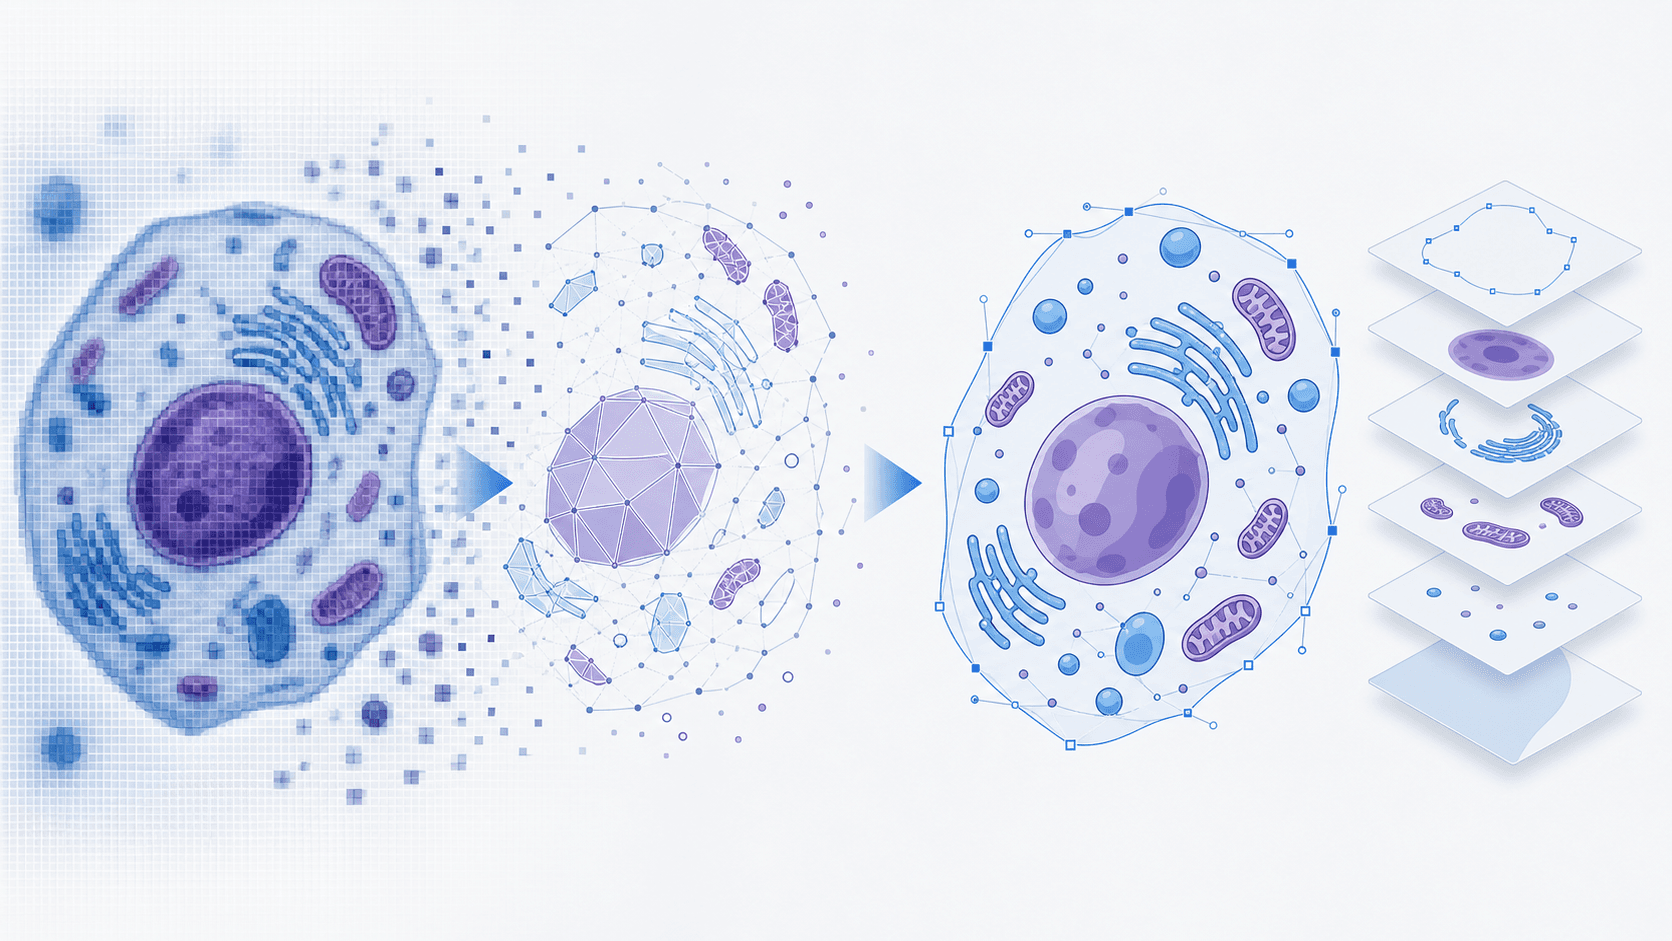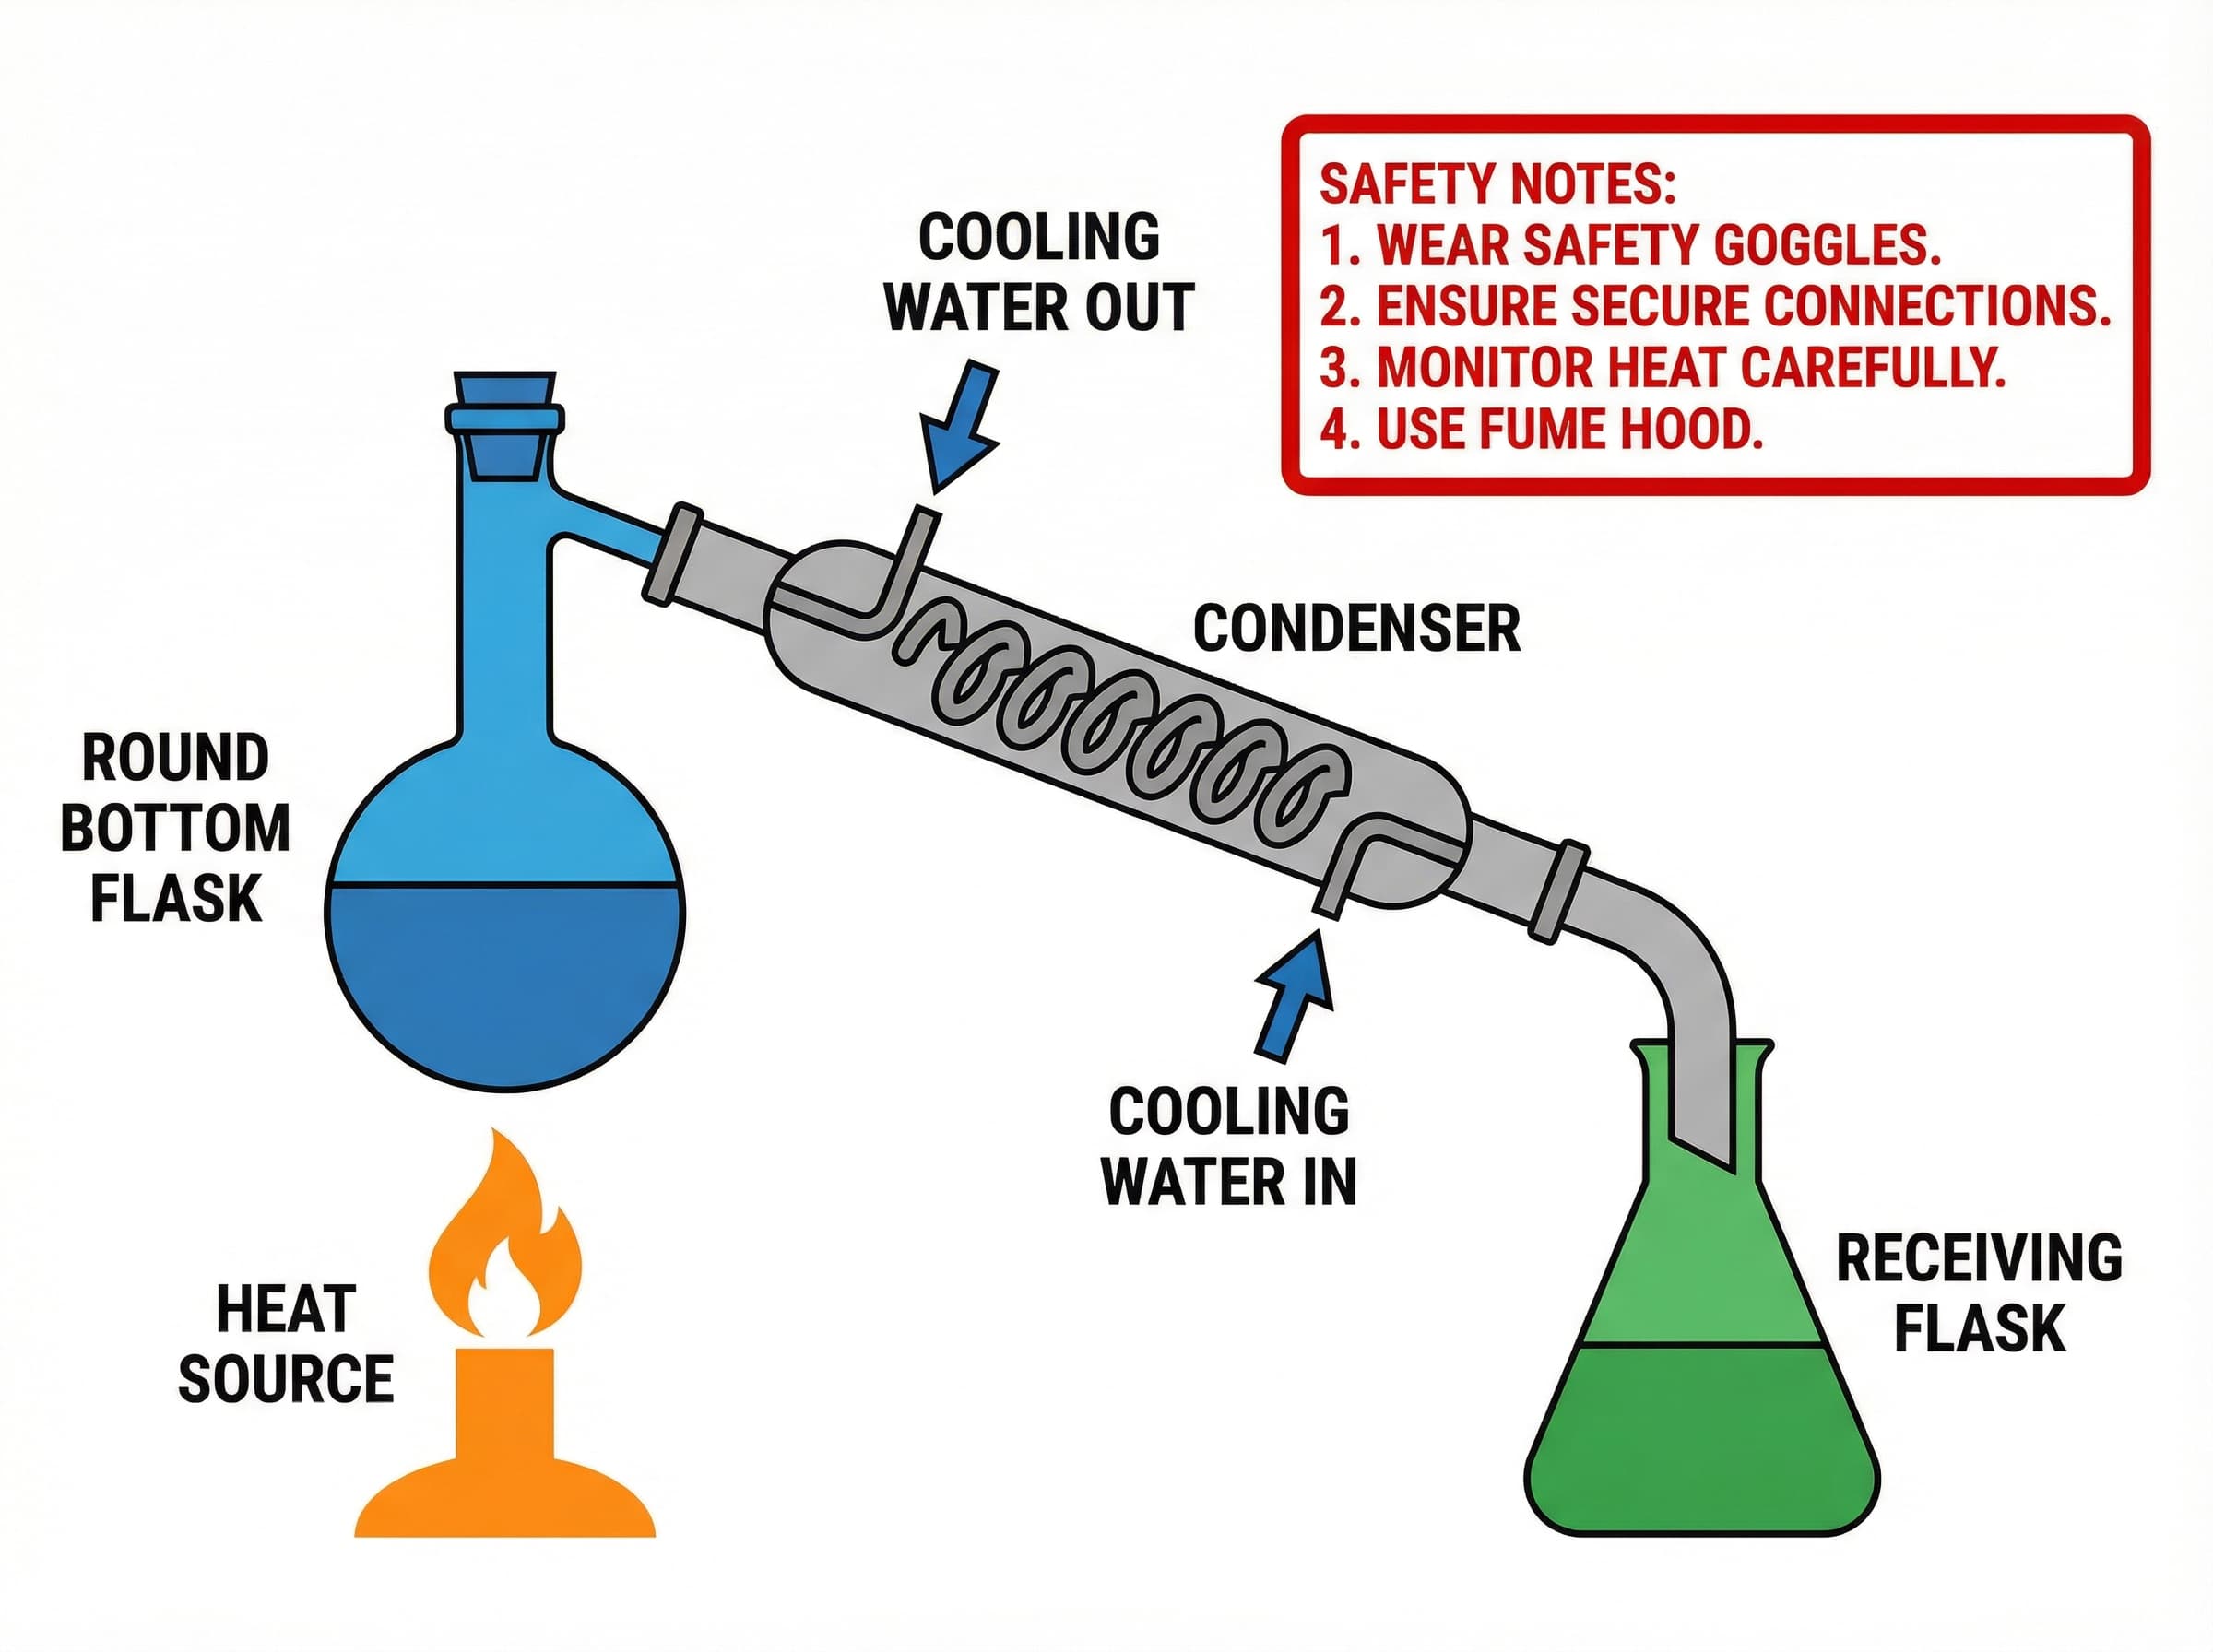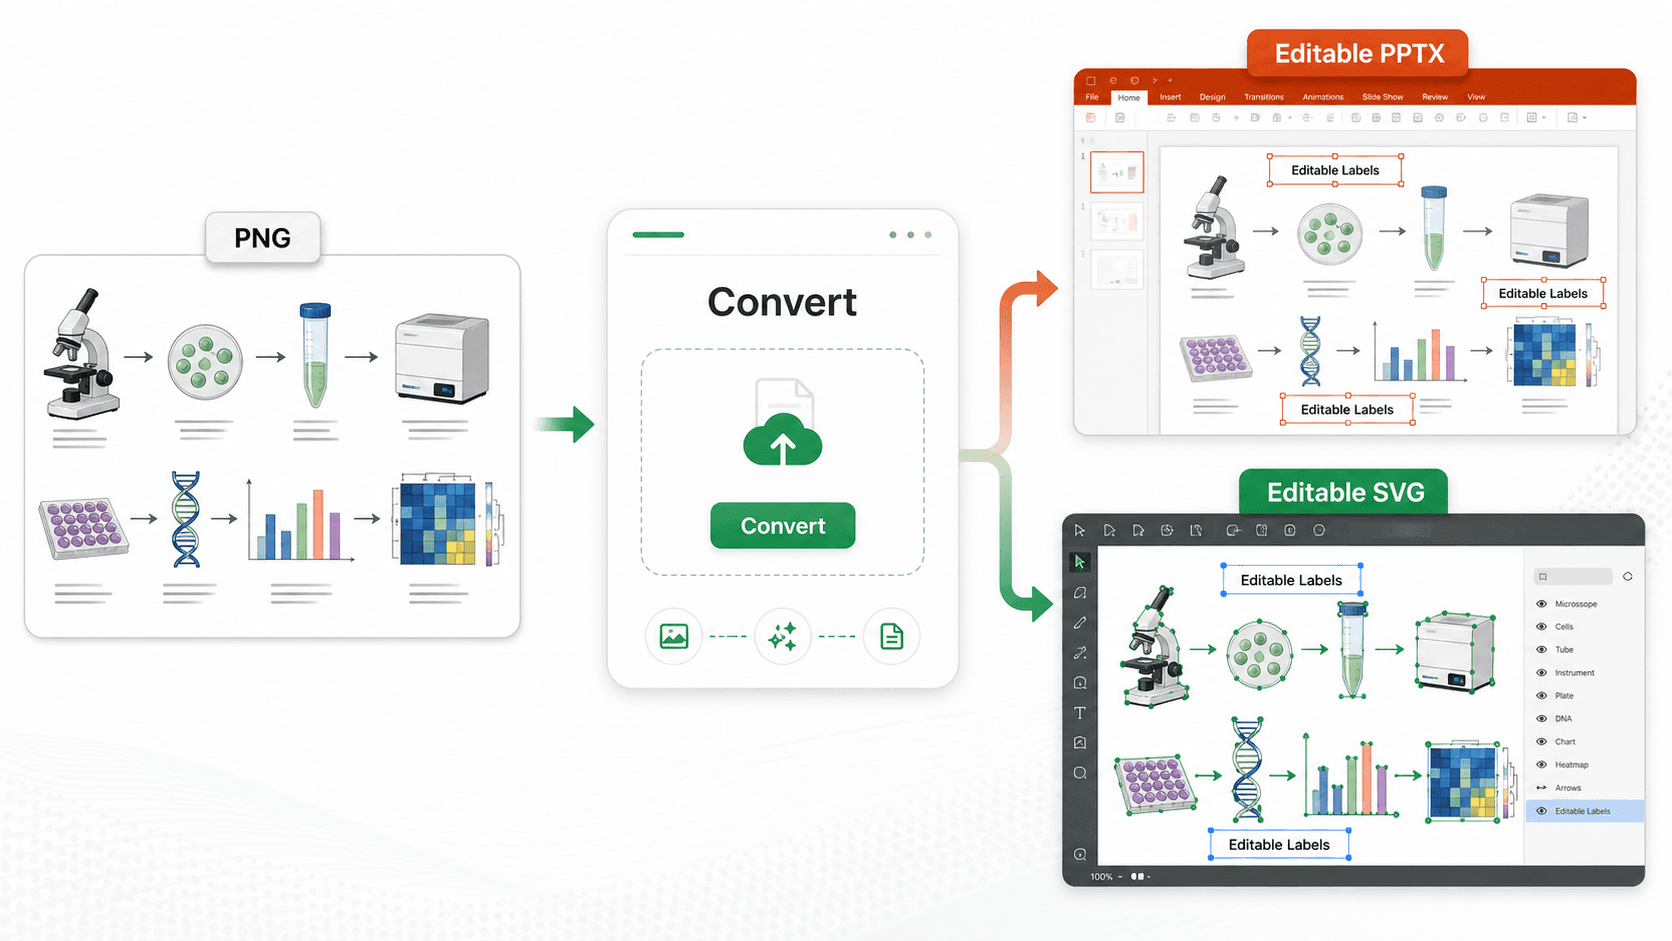
Quick answer: if you only have a PNG, JPG, or WebP scientific figure, use SciDraw AI Convert to rebuild it as either an editable PowerPoint PPTX or an editable SVG. Choose PPTX when the next person will revise the figure in PowerPoint. Choose SVG when the next step is Illustrator, Inkscape, Figma, journal production, or vector refinement.
The important change is not just "another export format." PPTX and SVG solve different editing problems. PPTX gives coauthors native PowerPoint text boxes for fast label changes. SVG gives designers and journal workflows vector layers for color, line, and layout cleanup.
The Real Problem
Many research teams lose the editable source long before submission. A figure starts in a drawing tool, an AI image generator, BioRender, matplotlib, PowerPoint, or a vendor-provided PDF. Someone exports a PNG for Slack, email, or a draft manuscript. Two weeks later a reviewer asks for one of these small changes:
- Rename "Control" to "Vehicle".
- Increase panel labels from 8 pt to 10 pt.
- Change a pathway color to match the journal palette.
- Move one arrow so it no longer touches a legend.
- Translate the labels for a conference slide.
If the only remaining file is a flat image, PowerPoint cannot select the text. Illustrator sees pixels instead of objects. A normal screenshot-to-slide workflow only pastes the raster image into a deck, so the next edit still requires redrawing.
SciDraw AI's conversion flow is designed for this exact situation: preserve the visual figure, recover editable labels where possible, and export the result in the format that fits the next editing tool.
Common Mistakes Before Converting
Mistake 1: Choosing a format by habit. Researchers often export SVG because it sounds more professional. But if the next editor is a PI using PowerPoint, an SVG may create friction. In that case, PPTX is usually faster.
Mistake 2: Using a generic vectorizer for scientific labels. Many vectorizers trace every letter as an outline. The result scales nicely, but the text is no longer text. That is fine for logos, but painful for figures with labels, gene names, units, and panel captions.
Mistake 3: Converting after heavy compression. A tiny screenshot from a chat app gives OCR less information. Use the largest original PNG, JPG, or WebP you have. If you can export again from the source, export at 2x or 3x size before conversion.
Mistake 4: Expecting every pixel to become a perfect native shape. A converted PPTX is not magic reconstruction of the original authoring file. It is best understood as a rebuilt slide with editable labels and a clean visual base. SVG conversion can recover more vector structure for element editing, but complex microscopy images, heatmaps, and shaded 3D renders should stay as image regions.
One Upload, Two Editable Outputs
The same upload can lead to two useful outputs. The decision should be based on the next edit, not on the file extension.
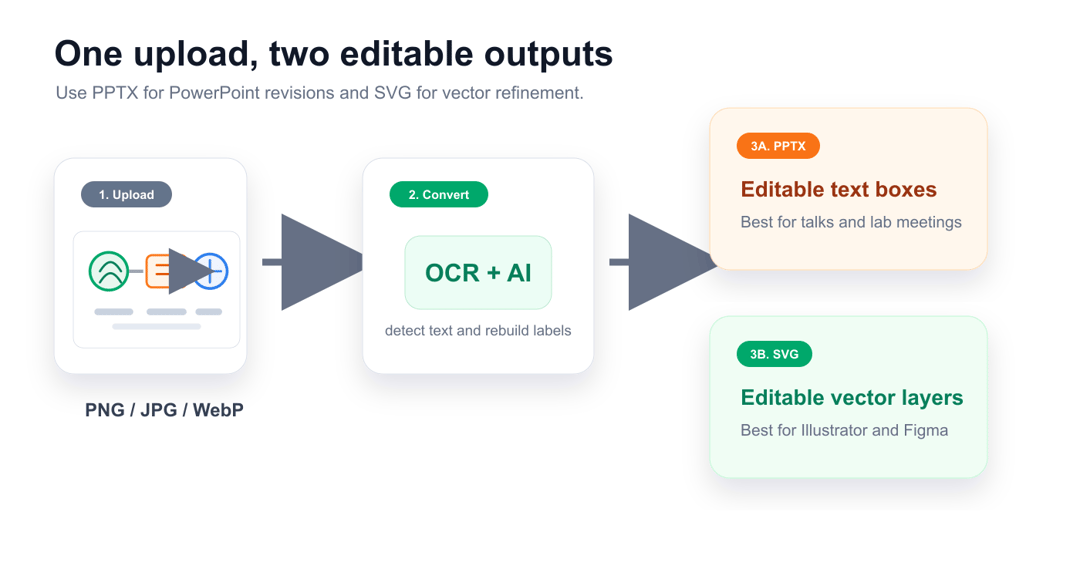
In the convert panel:
- Upload a PNG, JPG, or WebP scientific figure.
- Choose Editable PPTX when you need a PowerPoint file with editable text labels.
- Choose Extract Text SVG when the priority is recovering label text as SVG text layers.
- Choose Convert All Elements SVG when the priority is a more complete vector reconstruction of the image.
- Download the generated file and make final edits in the tool your team already uses.
The PPTX option is especially useful for lab meetings, thesis defenses, grant-review slides, course materials, and quick coauthor revisions. The SVG options are better for final figure polish, Illustrator cleanup, Figma-based layout work, and journal-ready vector assets.
What "Editable" Means
For scientific figures, "editable" should be precise. Otherwise users expect a perfect recreation of a file that may never have existed.
In the PPTX workflow, editable usually means:
- Text labels are rebuilt as PowerPoint text boxes when OCR can read them.
- The figure is placed on a slide in a presentation-friendly layout.
- The downloaded file can be opened and revised in Microsoft PowerPoint, Keynote through import, or compatible office suites.
- The image base remains visible, so the figure is still usable even if some labels need manual correction.
In the SVG workflow, editable usually means:
- Text can be preserved as SVG text where the conversion recognizes it.
- Simple lines, arrows, boxes, icons, and color regions may become vector objects depending on the conversion mode.
- The file can be opened in Illustrator, Inkscape, Figma, PowerPoint, or a web browser.
- Elements can be recolored, scaled, regrouped, and exported again without the same raster quality loss.
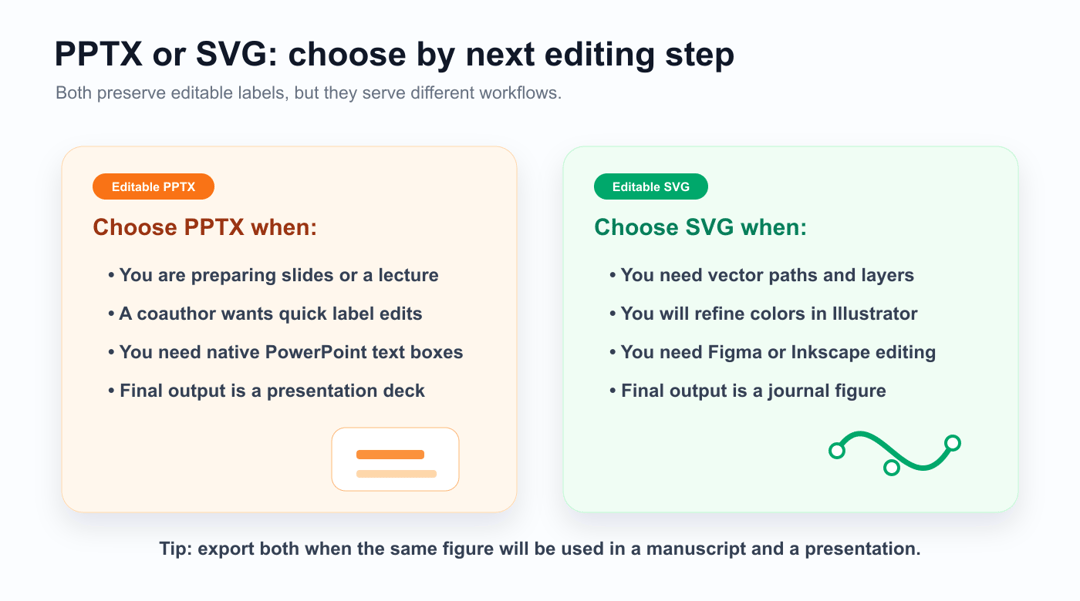
This distinction matters. If you need to change a few labels before tomorrow's talk, PPTX is the most practical output. If you need to clean up line weights, colors, and individual vector paths for a manuscript, SVG is the better starting point.
PPTX or SVG: Choose by the Next Editing Step
| Need | Best output | Why |
|---|---|---|
| Edit labels in PowerPoint | PPTX | Text boxes are easier for coauthors to select and revise |
| Prepare lecture or defense slides | PPTX | The output is already a slide deck |
| Send a figure to Illustrator | SVG | Illustrator works best with vector objects and paths |
| Refine colors and line weights | SVG | Vector layers are easier to select and restyle |
| Use the same figure in slides and a manuscript | Both | PPTX speeds presentation edits; SVG protects publication quality |
| Preserve a heatmap, blot, microscopy image, or photo | PPTX or SVG with image base | These regions should usually remain raster images |
Step-by-Step: Convert an Image to Editable PPTX
Use this workflow when your next destination is a presentation.
- Open SciDraw AI Convert.
- Upload the cleanest image you have. Prefer the original export over a screenshot from WeChat, Slack, or email.
- Select Editable PPTX.
- Wait for the conversion result.
- Download the PPTX file.
- Open it in PowerPoint and click the labels you want to revise.
- Fix OCR mistakes, adjust font size, and align text boxes to match the original figure.
- Save the deck or export a high-resolution image for your slide workflow.
Practical PowerPoint tips:
- Use the same font family across the converted figure before sending it to collaborators.
- Keep scientific units attached to numbers, such as
10 µM,37 °C, andp < 0.05. - Check Greek letters, superscripts, subscripts, gene names, and italic species names manually.
- If a label is split into multiple text boxes, select them and align them as a group.
Step-by-Step: Convert an Image to Editable SVG
Use this workflow when your next destination is Illustrator, Inkscape, Figma, or a journal figure package.
- Open SciDraw AI Convert.
- Upload your image.
- Choose Extract Text if labels are the main issue.
- Choose Convert All Elements if you need a more complete vector rebuild.
- Download the SVG.
- Open it in Illustrator, Inkscape, Figma, or PowerPoint.
- Inspect text layers, arrows, and grouped elements.
- Re-export as SVG, PDF, TIFF, or PNG based on the journal requirement.
Practical SVG tips:
- Keep a copy of the original SVG before ungrouping or flattening.
- Use common fonts such as Arial, Helvetica, Times New Roman, or Noto Sans for safer cross-platform rendering.
- Convert final text to outlines only at the very end if a journal or printer requires it.
- For manuscript submission, also check figure size, DPI, font size, and color mode after conversion.
Better Source Images Convert Better
Conversion quality depends heavily on the input image. If you are generating a new scientific illustration with AI, write the prompt so the figure is easier to convert later.
Poor prompt:
Make a diagram of cell signaling.
Better prompt:
Create a clean scientific pathway diagram for EGFR signaling in a 16:9 layout. Use large readable labels, simple flat vector-style icons, no tiny paragraph text, white background, separate arrows between receptor, RAS, RAF, MEK, ERK, and nucleus. Keep all labels horizontal and leave spacing around each label so they can be edited later.
The better prompt gives the converter cleaner structure: fewer overlapping objects, larger labels, clearer arrows, and less decorative noise. That means OCR has a better chance of recovering text, and the final PPTX or SVG needs less manual cleanup.
Before You Submit or Present
Run this checklist after conversion:
- Every label is readable at final size.
- Panel letters use a consistent font, size, and position.
- Units, Greek letters, subscripts, superscripts, and gene symbols are correct.
- Arrows do not touch text or data points.
- Colors remain distinguishable in grayscale or color-blind-safe palettes.
- The final figure meets the journal's width and DPI requirements.
- You saved both an editable source file and a flattened export.
For presentations, also test the converted PPTX on the actual display or projector. Thin lines that look elegant on a laptop may disappear in a seminar room. For journals, export a final PNG, TIFF, PDF, or SVG according to the instructions for authors.
Troubleshooting
The text is wrong. Use a higher-resolution input and avoid compressed screenshots. Scientific abbreviations often need manual review even after good OCR.
The PPTX opens but looks slightly different. Font substitution is the usual cause. Switch labels to a common font and save again.
Some objects are not selectable. They may be part of the raster base. Use SVG Convert All Elements for deeper vector reconstruction, or manually redraw only the specific object you need to edit.
The SVG is too complex. Open it in Illustrator or Inkscape, remove unnecessary groups, simplify paths, and keep the final file organized by panel.
The result is good but not journal-ready. Conversion is the recovery step. Final publication prep still requires checking figure dimensions, font size, resolution, and journal-specific export settings.
Recommended Workflow
For most teams, the safest workflow is:
- Generate or collect the best-quality image.
- Convert it to PPTX for fast coauthor and slide edits.
- Convert it to SVG for final vector cleanup.
- Keep both editable files next to the final exported image.
That gives the lab a practical PowerPoint file for communication and a vector file for publication. It also prevents the same painful situation from returning when a reviewer asks for one more label change.
Start with SciDraw AI Convert, or create a fresh figure in AI Scientific Drawing and export editable files from the same workflow.