Many teams use the wrong figure type for the job. The result is usually the same: a visually "nice" image that fails to communicate the key message.
This guide helps you choose the right figure format for scientific communication. For each type, you get:
- when to use it
- what it should include
- one ready-to-use prompt
- one generated example
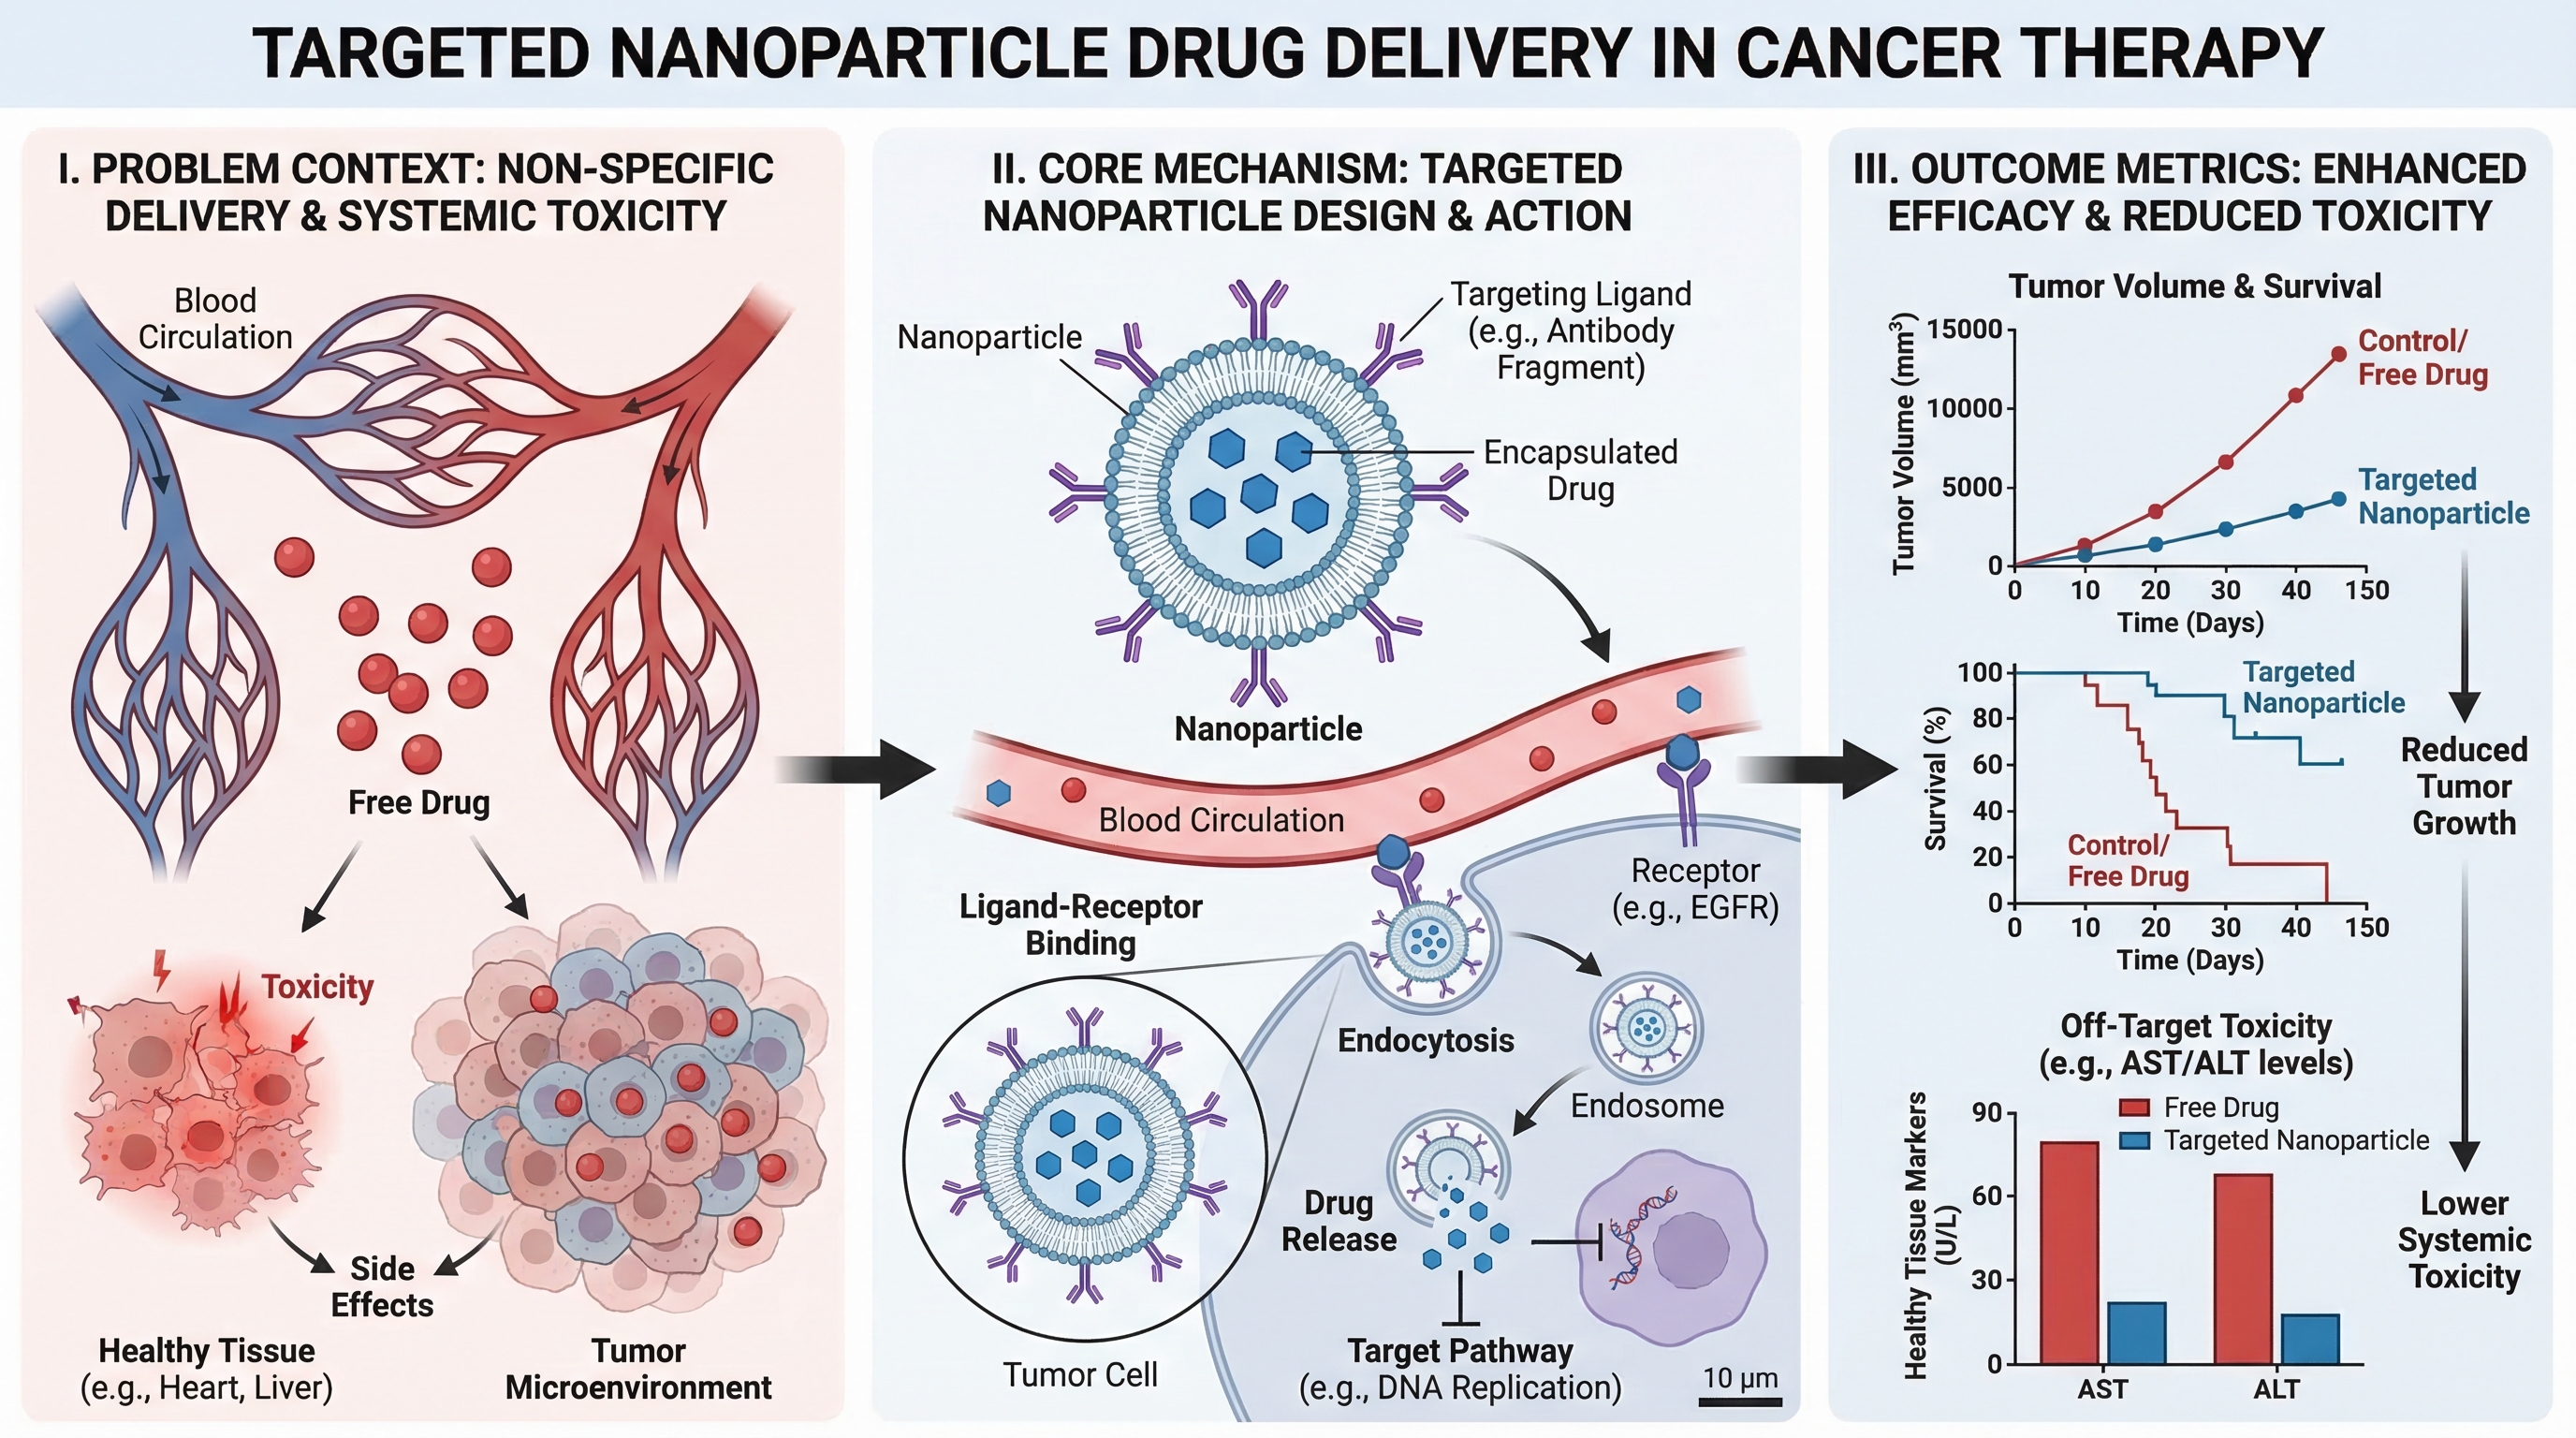
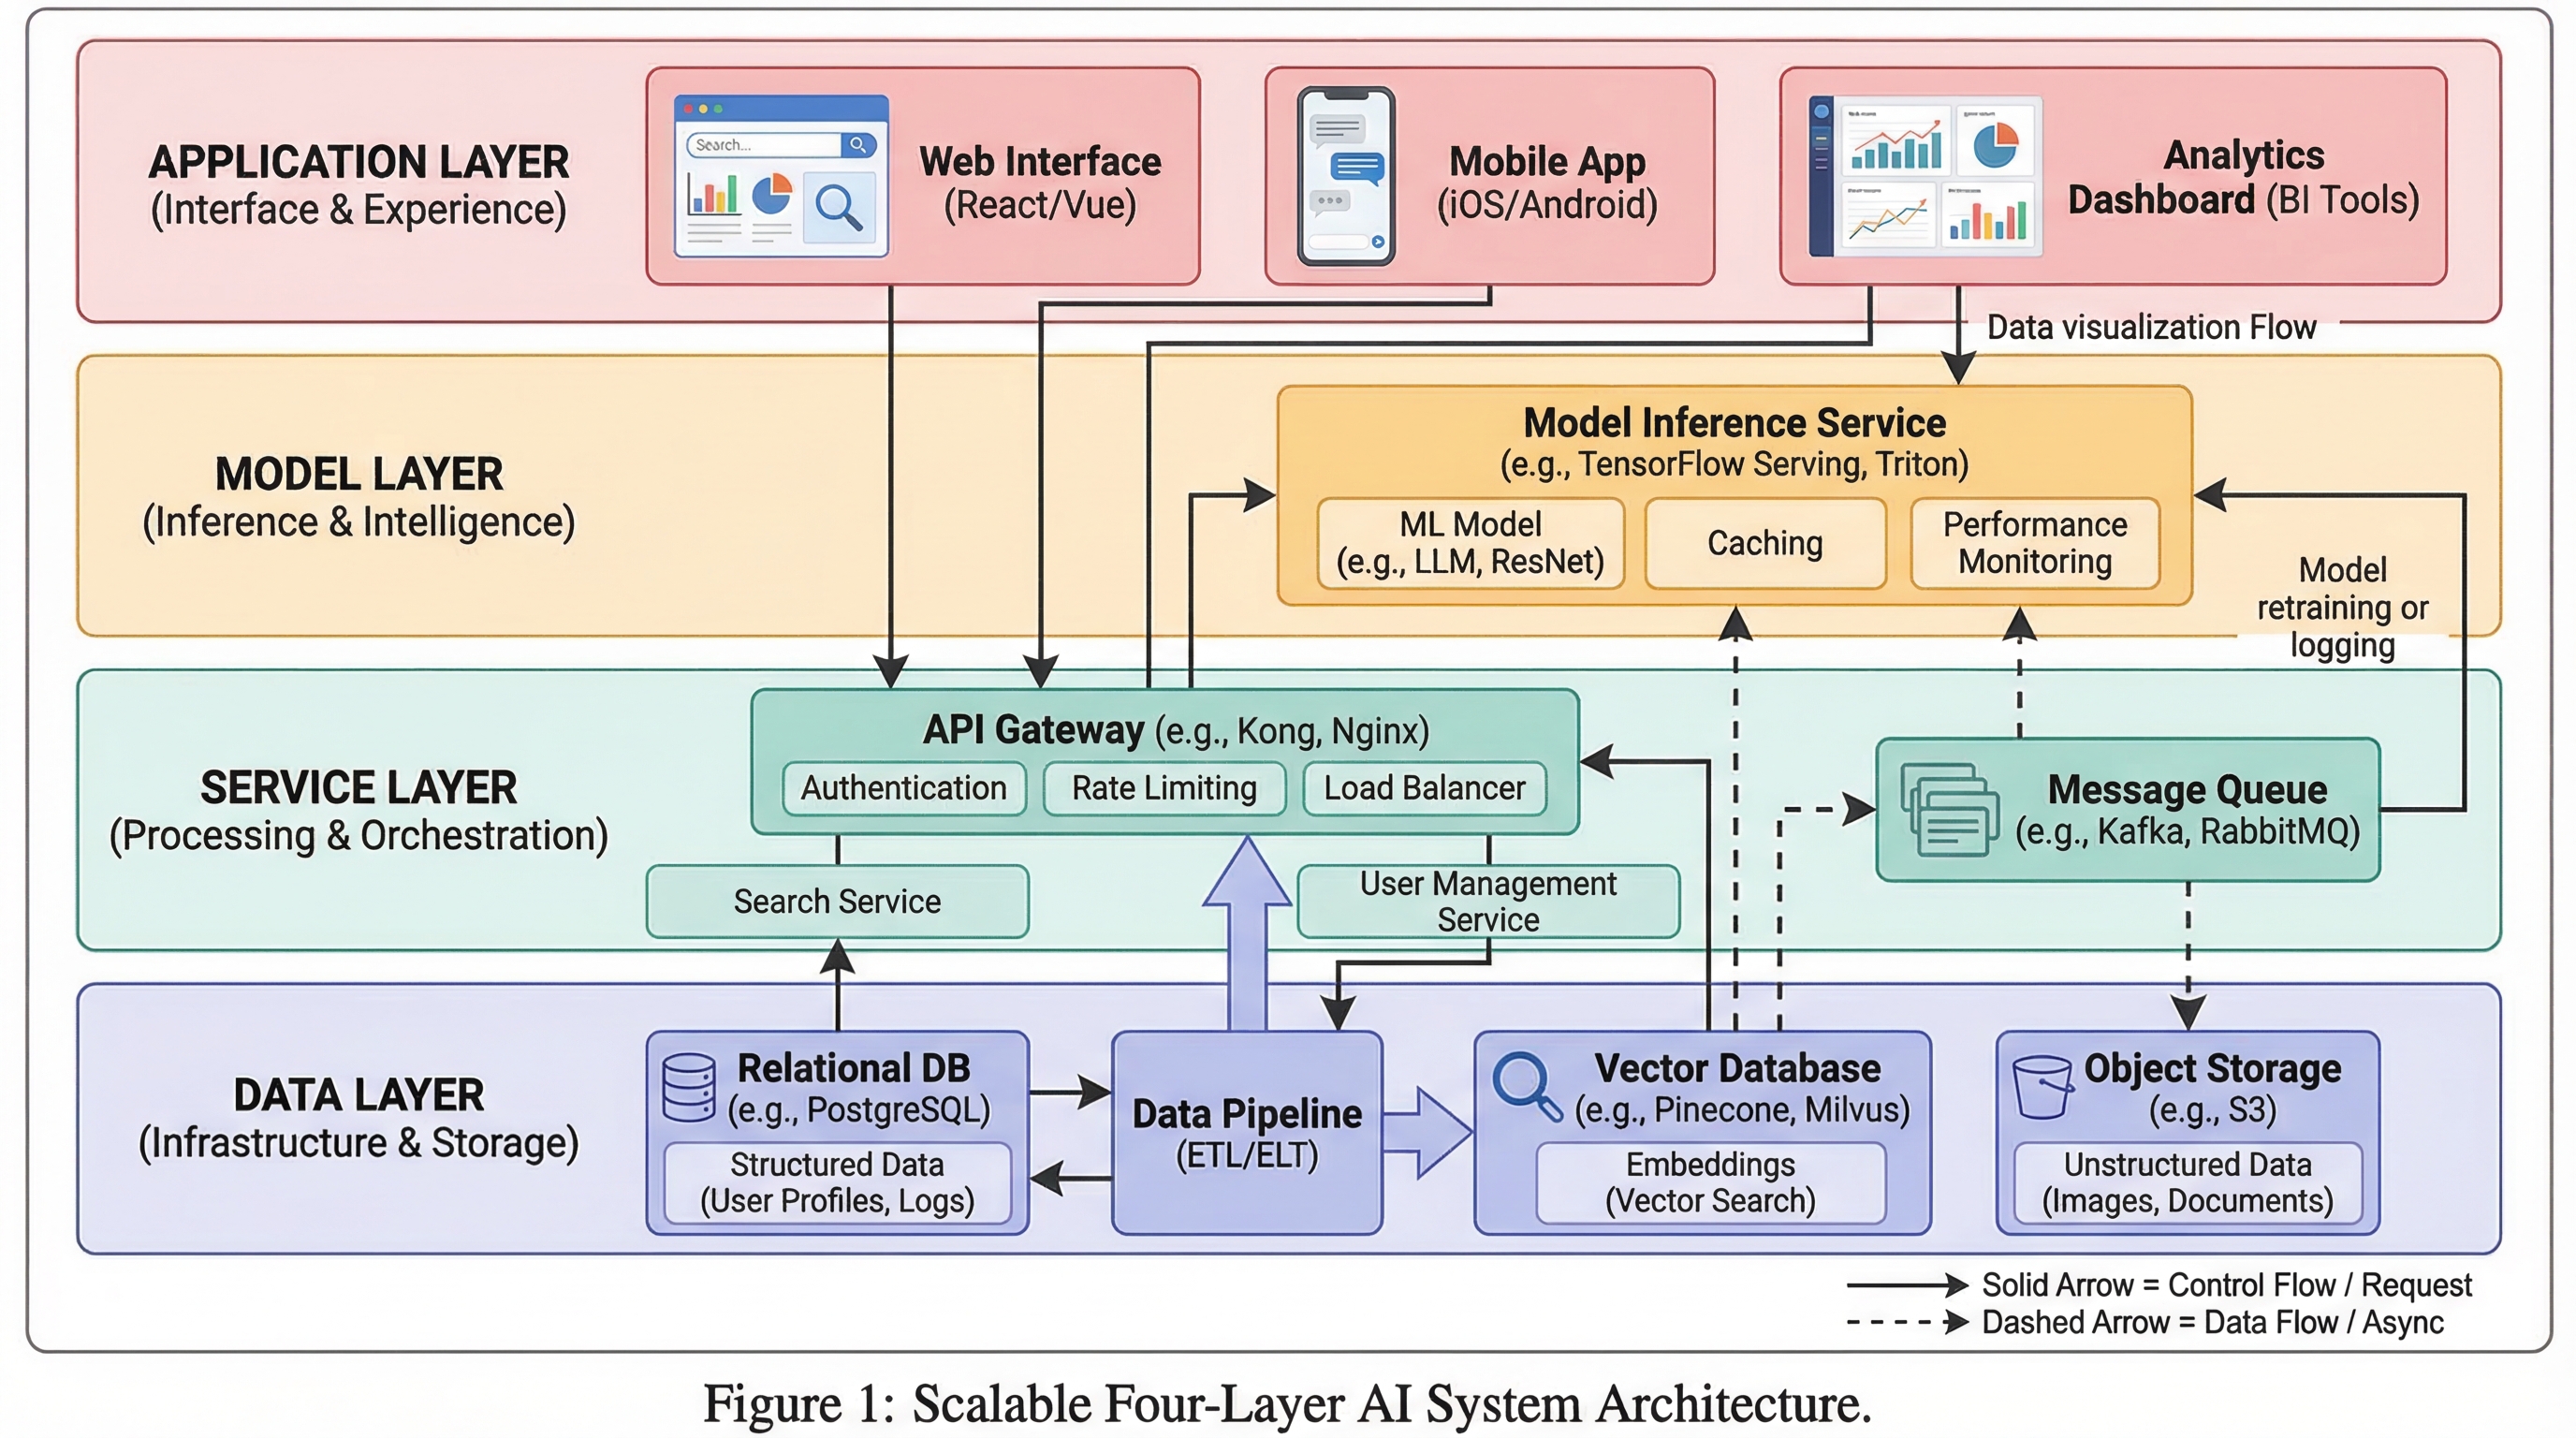
1) Graphical Abstract
Use this when you need a one-screen summary of the entire study story: problem, method, and outcome.
Best for:
- journal submission
- paper landing pages
- social sharing of research highlights
Prompt template
Create a graphical abstract for [study topic].
Three connected panels: problem context, core method, key outcome.
Use concise English labels, directional arrows, and high information density.
Clean white background, publication-ready scientific style.
2) Mechanism Diagram
Use this when you need to explain "how" something works step by step at the molecular, cellular, or system level.
Best for:
- mechanism sections in papers
- grant rationale figures
- drug action explanation
Prompt template
Create a mechanism diagram for [process].
Show numbered causal steps from trigger to downstream effect.
Include key actors, arrows, inhibition/activation markers, and concise labels.
White background, textbook-level scientific clarity.
π Create mechanism figures instantly with the Mechanism Figure Generator
3) Pathway Diagram
Use this when you need branching relationships and crosstalk across multiple biological or technical pathways.
Best for:
- signaling pathway summaries
- systems biology interpretation
- multi-factor causal models
Prompt template
Create a pathway diagram for [topic].
Map upstream inputs, branch nodes, cross-talk links, and final outputs.
Use color-coded branches, legend, and concise English labels.
High readability, publication-ready style.
4) Workflow Diagram
Use this when you need operational sequence: what happens first, next, and under which conditions.
Best for:
- methods sections
- SOP documentation
- reproducibility and training
Prompt template
Create a workflow diagram for [process].
Show end-to-end steps from input to output, with decision nodes and checkpoints.
Include artifacts produced at each stage and concise labels.
Clean white background, process-centric layout.
π Create workflow diagrams instantly with the Workflow Diagram Generator
5) Architecture Diagram
Use this when you need to show system structure and component interactions instead of chronological steps.
Best for:
- platform documentation
- AI/ML system communication
- proposal and technical design review
Prompt template
Create a system architecture diagram for [platform].
Use layered structure (data, service, model, application).
Show key modules, interfaces, and data/control flows.
Concise labels, modern technical style, white background.
π Create architecture diagrams instantly with the AI Architecture Diagram Generator
6) Comparison Figure
Use this when your core message is difference: old vs new, baseline vs improved, method A vs method B.
Best for:
- ablation/result explanation
- reviewer-facing clarity
- decision support slides
Prompt template
Create a comparison figure for [A] vs [B].
Two-column aligned layout with matched dimensions.
Include key metrics, strengths/limitations, and callout arrows.
Clean white background, objective scientific presentation style.
7) Infographic
Use this when you need high-level synthesis for non-specialist readers or fast decision communication.
Best for:
- executive summary
- conference poster snippets
- cross-functional team updates
Prompt template
Create a scientific infographic for [topic].
Include key metric cards, trend summary, category breakdown, and takeaways.
Use icon-supported sections, concise English labels, and strong visual hierarchy.
Readable at presentation distance, white background.
Quick Selection Rule
If your primary question is:
- "What is the whole story?" β Graphical Abstract
- "How does it work?" β Mechanism
- "How do branches interact?" β Pathway
- "What is the process order?" β Workflow
- "How is the system built?" β Architecture
- "What is better/different?" β Comparison
- "What should people remember quickly?" β Infographic
Use the right type first, then optimize style. This alone improves figure clarity more than any color tweak.
π Create your own scientific figures in SciDraw
Start Creating Your Figures
Choose the right figure type and create it with AI assistance β Try SciDraw Free.
Related Tools
- Workflow Diagram Generator β create workflow diagrams with AI
- Mechanism Figure Generator β create mechanism and pathway diagrams
- Schematic Diagram Generator β create experimental schematics
- AI Architecture Diagram Generator β create system architecture diagrams
- Cell Illustration Generator β create cell biology illustrations
- Materials Science Figure Generator β create materials science diagrams
- Clinical Illustration Generator β create medical and clinical illustrations
- Graphical Abstract Maker β create visual abstracts
Related Guides
- Nature, Science & Cell Figure Requirements β size, DPI, and format specs
- Experimental Workflow Diagrams β create clear methods figures
- Scientific Figure Generator β AI tool for research papers
- Graphical Abstract Maker β create visual abstracts quickly
- Scientific Figure Maker Tool β online figure creation tool


