Almost everyone has read a lateral flow test — a home pregnancy kit, a COVID-19 antigen strip, a food-safety dipstick. Far fewer can draw one correctly. When a reviewer opens a paper on a new immunochromatographic assay, the structure diagram is the first place they check whether the authors actually understand their own device: does the conjugate sit in the right pad, does the flow run the right way, is the control line downstream of the test line?
This guide walks through how to draw a clear lateral flow assay (LFA) structure diagram for a paper, patent, or teaching slide. It covers the physical layers, the two detection chemistries most readers care about — colloidal gold and fluorescent — and the difference between sandwich and competitive formats, which is where most diagrams go wrong.

If you want a first draft before reading further, you can describe the strip in plain language to the SciDraw AI Lateral Flow Assay Diagram Generator and refine the layout it produces.
The physical layers, in flow order
A lateral flow strip is a stack of overlapping pads mounted on a backing card. Draw them left to right in the direction the liquid moves, with a small overlap between neighbors so the reader sees that fluid is wicked from one pad to the next:
- Sample pad — where the specimen is applied. It often conditions the sample (pH, filtering out cells) before it reaches the chemistry.
- Conjugate pad — holds the dried, labeled detection antibody (the colloidal-gold or fluorescent conjugate). When the sample rehydrates it, the label is released and carried downstream.
- Nitrocellulose (NC) membrane — the reaction stage. Two lines of capture reagent are striped across it: the test line (T) and, further along, the control line (C).
- Absorbent (wicking) pad — the sink at the far end. It pulls fluid through the membrane and keeps flow moving in one direction.
- Backing card — the adhesive base every pad sits on.
The single most common structural error is drawing the control line upstream of the test line. Flow reaches T first, then C. The control line has to be last, because it reports that the fluid front actually traveled the full length of the strip.
Show capillary flow, don't just imply it
The whole device runs on capillary action — no pumps, no power. Make that visible. A left-to-right arrow beneath the strip labeled "capillary flow" tells the reader everything about direction and mechanism in one stroke. Keep every other arrow, every gradient, and every label consistent with that one direction. If your sample pad is on the left, the absorbent pad must be on the right, and the conjugate must migrate the same way.
Sandwich vs. competitive: the part diagrams get wrong
This distinction changes what a positive result looks like, so your diagram must match the format you are describing.
Sandwich format (for larger analytes with multiple epitopes — hormones, proteins, whole viruses):
- The labeled antibody binds the analyte in solution.
- At the test line, an immobilized capture antibody grabs the analyte–conjugate complex, forming an antibody–analyte–antibody "sandwich."
- Signal at T = positive. More analyte, stronger line.
Competitive format (for small analytes with a single epitope — many toxins, drugs, pesticides):
- The test line is coated with the analyte (or an analyte–protein conjugate).
- Free analyte from the sample competes with the immobilized analyte for the labeled antibody.
- Signal at T = negative; no line = positive. More analyte, weaker line.
In both formats the control line works the same way: it captures excess conjugate regardless of analyte, so a visible C confirms the test ran. Label your result panel explicitly — a small legend showing "negative / positive / invalid" strip states prevents readers from misreading a competitive assay as a broken sandwich one.
Colloidal gold vs. fluorescent
The detection chemistry mostly changes the conjugate label and how the reader "sees" the result:
- Colloidal gold — the classic red-to-purple line visible to the naked eye. Draw the conjugate as small gold spheres on the conjugate pad; the T and C lines appear as colored bands. This is the format to use when your diagram needs to look like a familiar rapid test.
- Fluorescent (europium, quantum dots, or dye-loaded microspheres) — the label emits under a specific excitation wavelength and is read by a strip reader, giving quantitative output. In the diagram, show an excitation/emission cue near the membrane and note that the lines are read by an instrument, not the eye.
Keep the layer structure identical between the two — only the conjugate label and the read-out changes. Do not redraw the whole strip just to switch chemistries.
A prompt you can adapt
If you are generating the figure with AI, describe the layers in flow order and state the format explicitly. A vague prompt produces a strip with the control line in the wrong place. A specific one does not:
A horizontal cross-section schematic of a lateral flow immunochromatographic
test strip on a backing card. Left to right: sample pad, conjugate pad with
colloidal-gold labeled antibodies, nitrocellulose membrane with a test line (T)
and, downstream, a control line (C), then an absorbent pad. A labeled arrow
beneath the strip reads "capillary flow" pointing left to right. Sandwich
format: analyte captured between two antibodies at the test line. Clean flat
vector style, thin labels with leader lines, white background.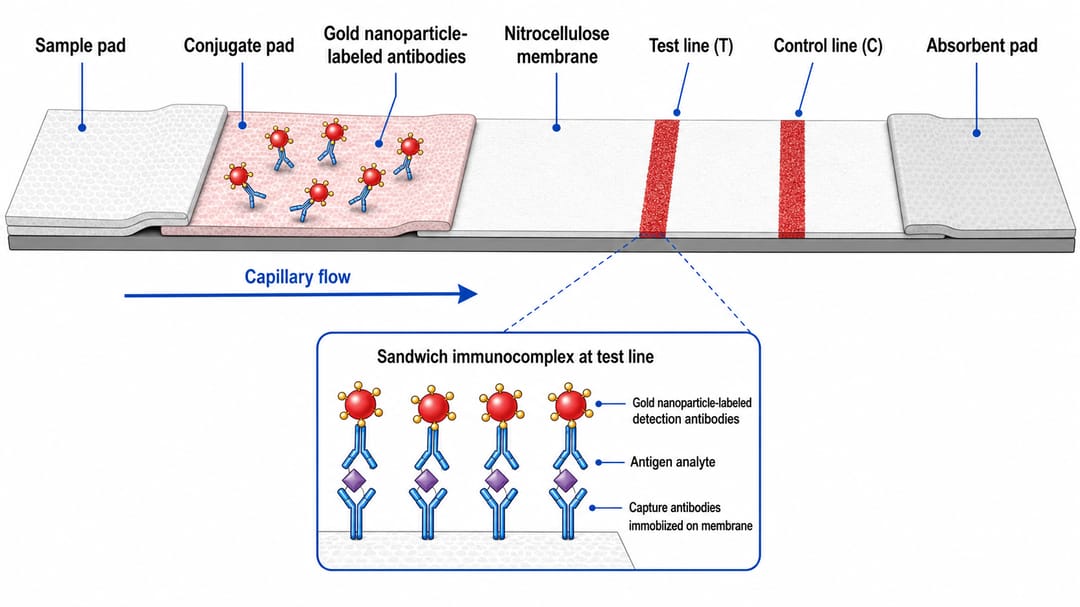 A lateral flow strip cross-section in flow order — sample pad to absorbent pad, with the sandwich complex at the test line.
Swap "colloidal-gold" for "europium fluorescent" and "sandwich" for "competitive" to generate the variants, and keep everything else fixed so the set stays visually consistent.
Common mistakes
- Control line before the test line. C is always the last line the fluid reaches.
- No overlap between pads. Butt-jointed pads suggest the fluid can't cross; overlap them.
- Missing flow arrow. Without it, the reader cannot tell which end the sample goes on.
- Wrong positive logic for competitive assays. Drawing a strong test line as "positive" on a competitive strip is a factual error that a reviewer will catch instantly.
- Mixing chemistries in one legend. If the figure is a gold strip, don't label the readout as fluorescence intensity.
A final checklist
Before you submit, confirm the diagram answers each of these on its own:
- Are all five zones present and in the correct flow order?
- Is the control line downstream of the test line?
- Does a flow arrow make the capillary direction unambiguous?
- Does the result panel match the format — sandwich (line = positive) or competitive (line = negative)?
- Is the detection chemistry — gold or fluorescent — stated and consistent with the readout?
A structure diagram that passes this checklist tells the reader, before they read a word of your Methods, that you understand exactly how your device works.
Related Guides
- How to Draw Scientific Figures: Complete Guide — layout, color, and typography principles for research figures
- How to Make an Experimental Workflow Diagram — for the assay-development pipeline around your device
- Writing Prompts for Scientific Figures — how to describe a diagram so an AI draws it right
Ready to draft your strip? Describe the layers and format to the SciDraw AI Lateral Flow Assay Diagram Generator and iterate until every zone, line, and arrow is exactly where it belongs.