Cladograms are the backbone of modern evolutionary biology. Whether you're a student building one for the first time or a researcher refreshing your method, the process is straightforward once you understand the logic. This guide walks you through every step — from picking your taxa to drawing the final branching tree.
What you'll learn in this post:
- How to choose taxa and an outgroup
- How to build a character table
- How to identify shared derived traits (synapomorphies)
- How to order clades from general to specific
- How to draw a clean, publication-ready cladogram
- The difference between a cladogram and a phylogenetic tree
- A worked example from start to finish
What Is a Cladogram?
A cladogram is a branching diagram that shows hypothetical relationships among taxa based on shared derived characteristics (synapomorphies). Unlike a full phylogenetic tree, a cladogram does not show evolutionary time or branch lengths — it only shows the relative order in which groups share common ancestors.
Each branching point (node) represents a hypothetical common ancestor shared by all the taxa above it. Taxa that branch off together are called a clade — a monophyletic group containing an ancestor and all its descendants.
Cladogram vs. Phylogenetic Tree
Many people use these terms interchangeably, but they are technically different:
| Feature | Cladogram | Phylogenetic Tree |
|---|---|---|
| Branch lengths | Arbitrary (no meaning) | Proportional to evolutionary change or time |
| Shows time? | No | Often yes (if time-calibrated) |
| Shows amount of change? | No | Yes (if scaled) |
| Purpose | Topology of relationships | Full evolutionary history |
| Data used | Presence/absence of characters | Can include molecular rates, fossils |
| Common in | Systematics, taxonomy courses | Molecular biology, evolutionary studies |
For teaching purposes and basic taxonomy, a cladogram is the right tool. For publication-level molecular work, a fully scaled phylogenetic tree is more appropriate. SciDraw AI supports both formats — use the phylogenetic tree maker when you need branch lengths, and the cladogram maker for clean topological diagrams.
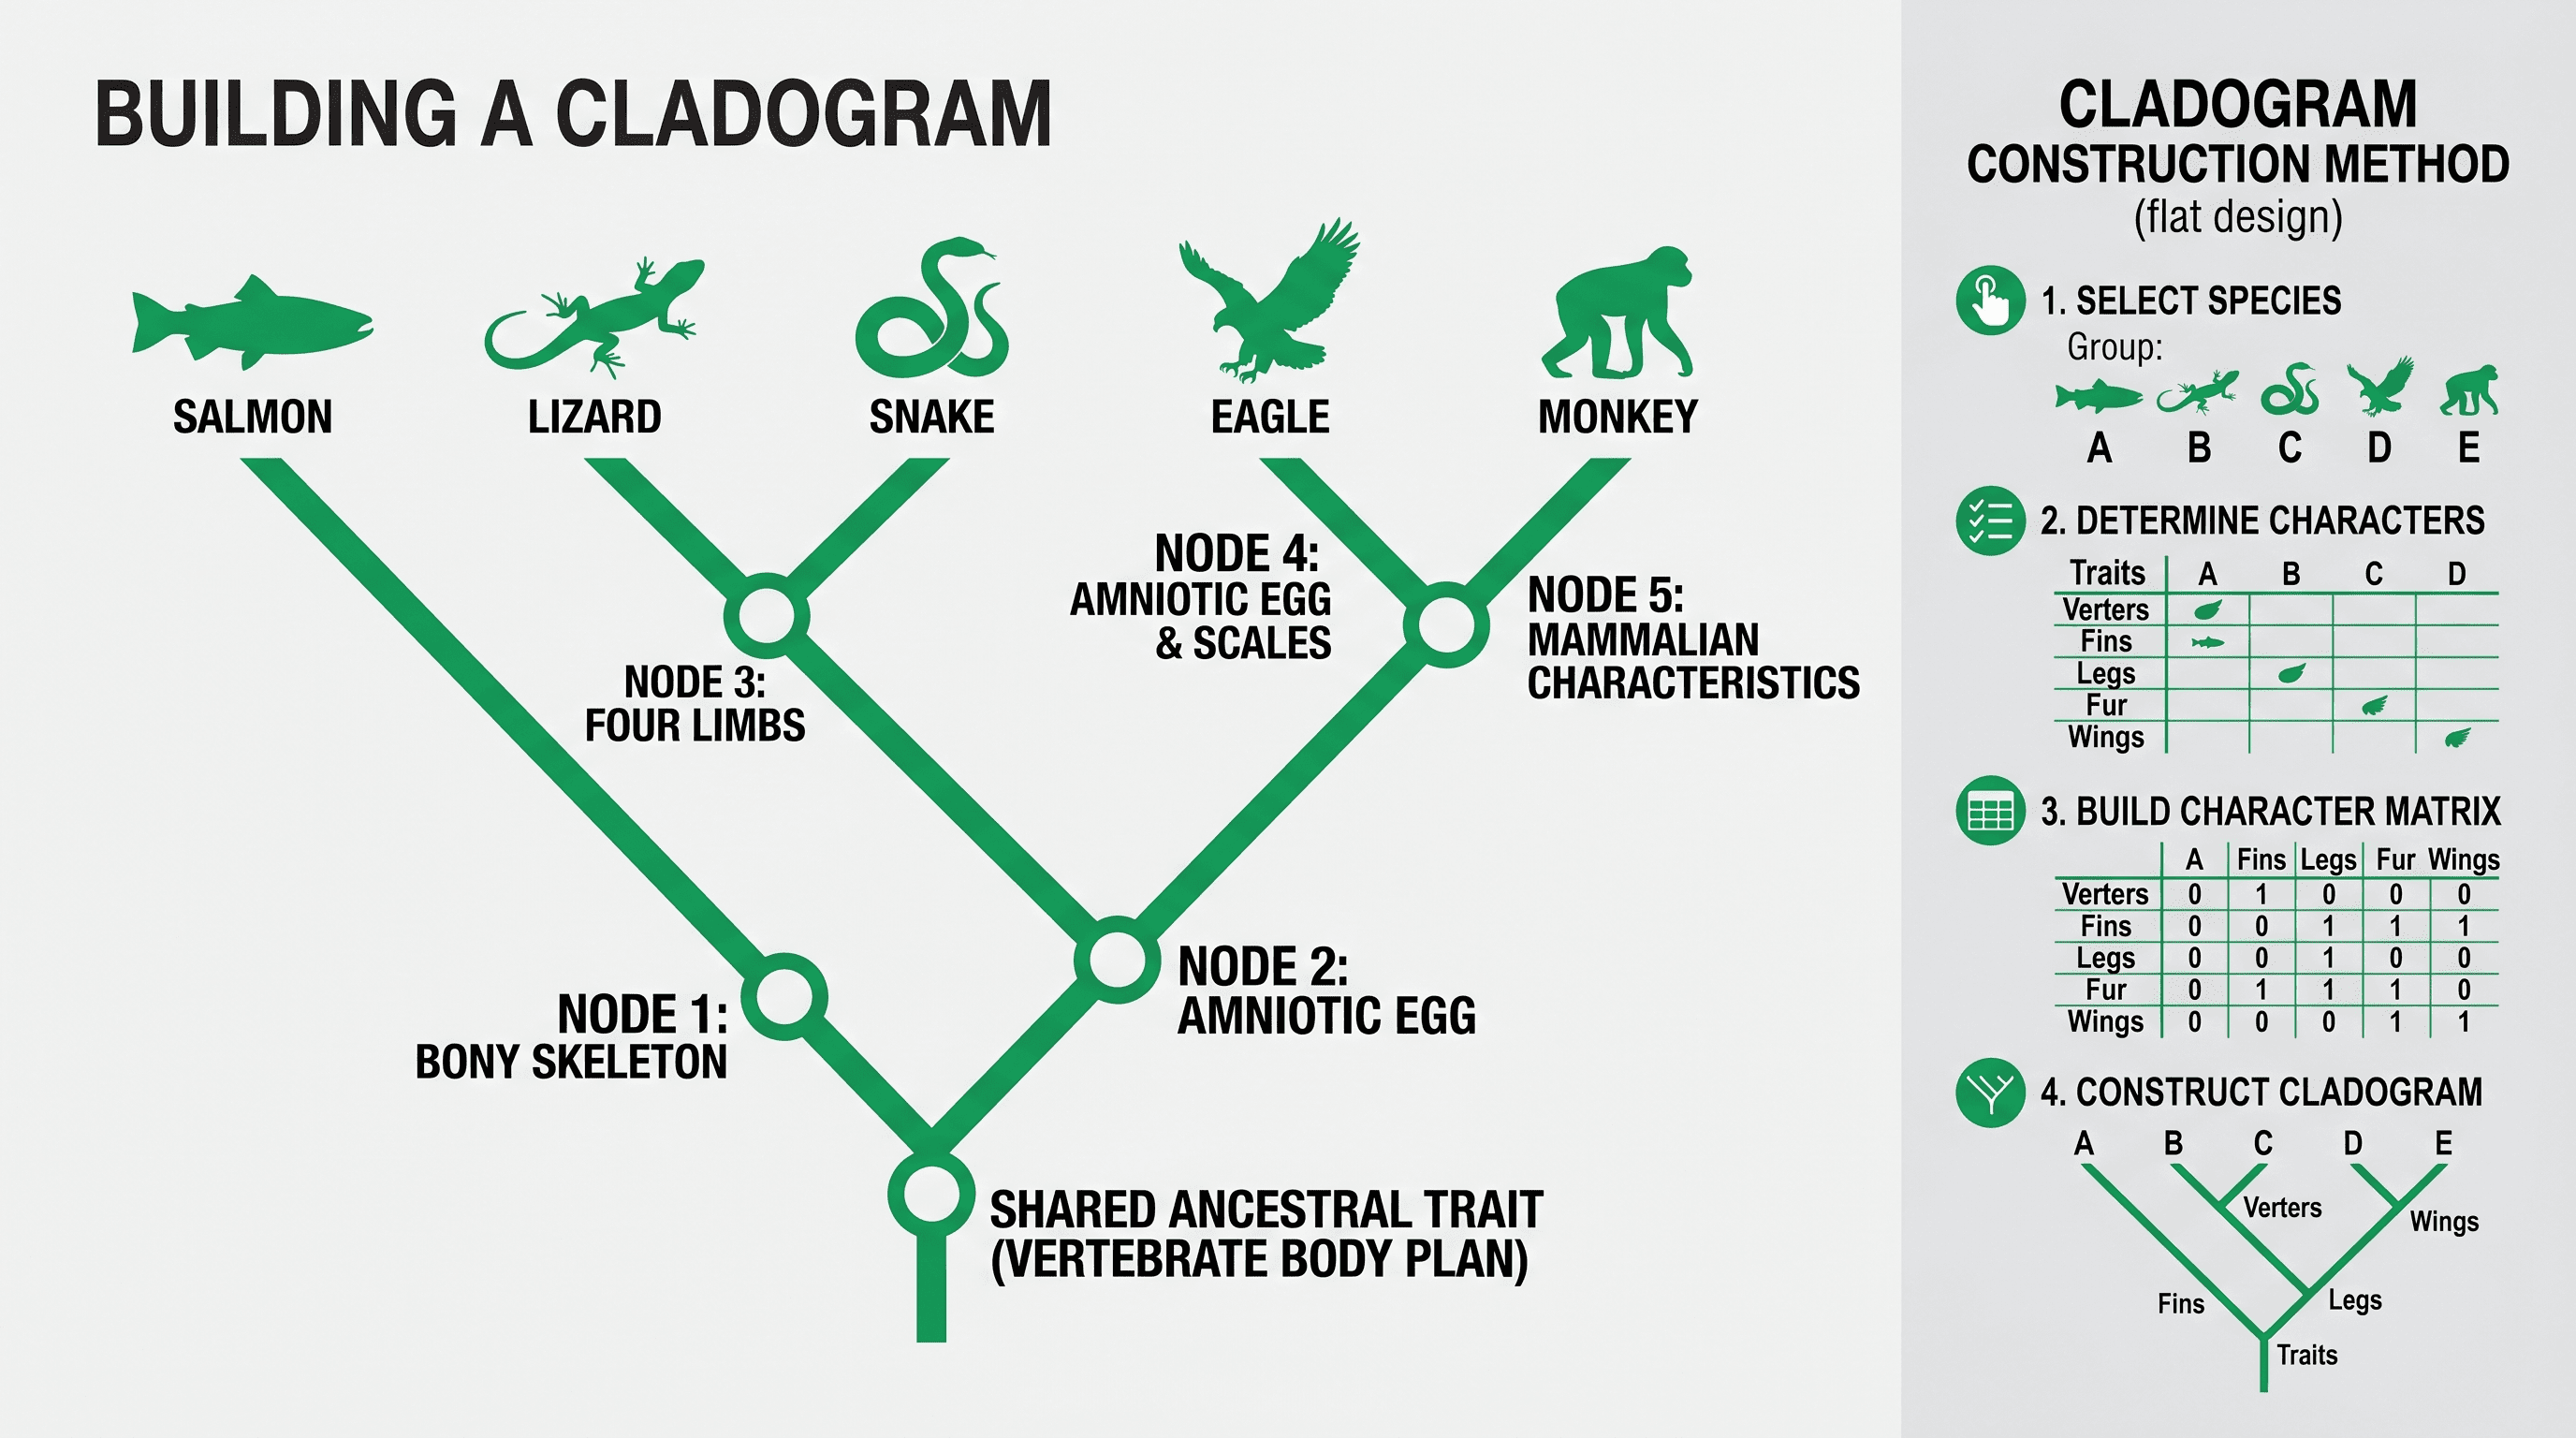
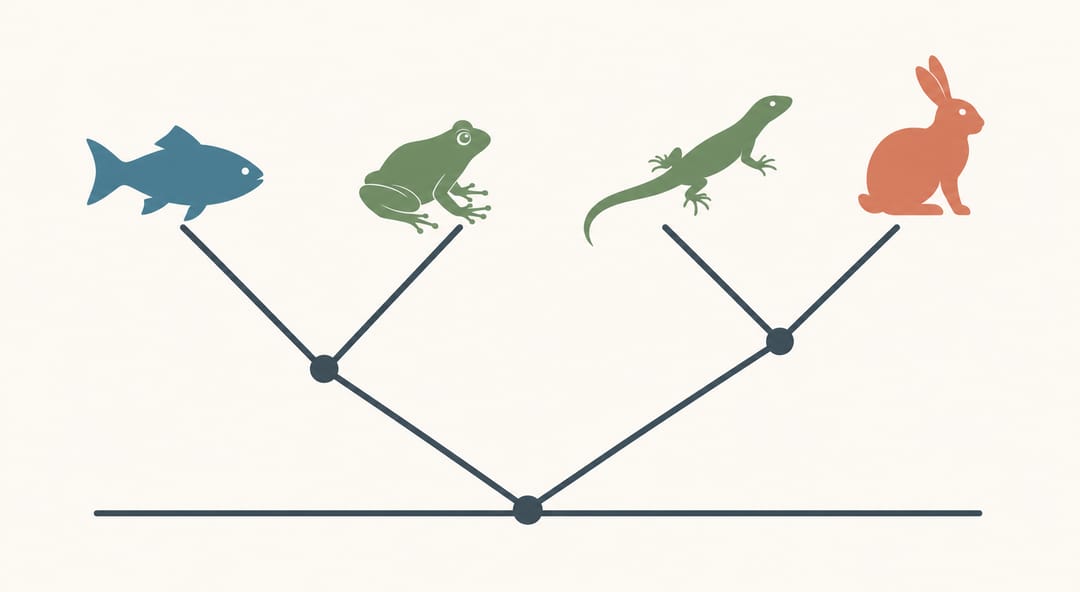 A cladogram branches taxa by shared ancestry — silhouettes mark each tip.
Step 1 — Choose Your Taxa
Start by deciding which organisms (or groups) you want to compare. These are your ingroup taxa — the organisms you're studying.
Guidelines for choosing taxa:
- Pick 5–10 taxa for a teaching or practice cladogram. Too few gives no resolution; too many becomes unwieldy by hand.
- Choose taxa that span a clear range of complexity or evolutionary distance.
- Make sure you have reliable character data for each taxon.
Example ingroup (used throughout this guide):
- Lamprey
- Shark
- Salmon
- Frog
- Lizard
- Rabbit
- Human
Step 2 — Add an Outgroup
An outgroup is a taxon that is closely related to your ingroup but sits outside it. The outgroup acts as the reference point — it defines which character states are ancestral (plesiomorphic) and which are derived (apomorphic).
For our vertebrate example, a good outgroup is a lancelet (amphioxus), which is a chordate but not a vertebrate.
Rules for outgroup selection:
- The outgroup must be related to the ingroup, but not a member of it.
- It should share some characters with the ingroup but lack the most derived ones.
- Using more than one outgroup improves accuracy.
Step 3 — Build a Character Table
A character table (also called a data matrix) is the raw material for any cladogram. Each row is a taxon; each column is a character. You fill in 0 (absent/ancestral) or 1 (present/derived) for each cell.
Choosing Characters
Good characters for a cladogram are homologous — they arise from the same ancestral structure. Avoid using analogous characters (similar function, different origin, like bat wings and insect wings).
Useful character types:
- Morphological: presence of a jaw, paired limbs, hair, amniotic egg
- Biochemical: specific proteins, DNA sequences
- Behavioral: rarely used alone, but valid
Example Character Table
| Taxon | Vertebrae | Jaws | Paired limbs | Amniotic egg | Hair/fur | Mammary glands |
|---|---|---|---|---|---|---|
| Lancelet (outgroup) | 0 | 0 | 0 | 0 | 0 | 0 |
| Lamprey | 1 | 0 | 0 | 0 | 0 | 0 |
| Shark | 1 | 1 | 0 | 0 | 0 | 0 |
| Salmon | 1 | 1 | 0 | 0 | 0 | 0 |
| Frog | 1 | 1 | 1 | 0 | 0 | 0 |
| Lizard | 1 | 1 | 1 | 1 | 0 | 0 |
| Rabbit | 1 | 1 | 1 | 1 | 1 | 1 |
| Human | 1 | 1 | 1 | 1 | 1 | 1 |
Step 4 — Identify Shared Derived Traits (Synapomorphies)
A synapomorphy is a derived character state shared by two or more taxa that they inherited from a common ancestor. This is the key concept in cladistics.
- Plesiomorphy: ancestral character state (shared with outgroup)
- Apomorphy: derived character state
- Synapomorphy: derived character state shared by a clade (what unites a clade)
- Autapomorphy: derived character unique to one taxon (doesn't help define clades)
From our table:
- Vertebrae unites all ingroup taxa (lamprey through human) — one clade
- Jaws unites shark, salmon, frog, lizard, rabbit, human — a nested clade
- Paired limbs unites frog, lizard, rabbit, human — another nested clade
- Amniotic egg unites lizard, rabbit, human
- Hair + mammary glands unites rabbit and human
Step 5 — Order Clades from General to Specific
Think of cladogram construction as nesting boxes inside boxes:
- The most broadly shared character defines the outermost (most inclusive) clade.
- Each additional character nests a smaller group inside it.
Nesting order for our example:
All ingroup taxa → share: vertebrae
  ↳ Jawed vertebrates → share: jaws
      ↳ Tetrapods → share: paired limbs
          ↳ Amniotes → share: amniotic egg
              ↳ Mammals → share: hair + mammary glands
The lamprey branches off first (has vertebrae but no jaws). Shark and salmon branch off next (have jaws but no limbs). And so on.
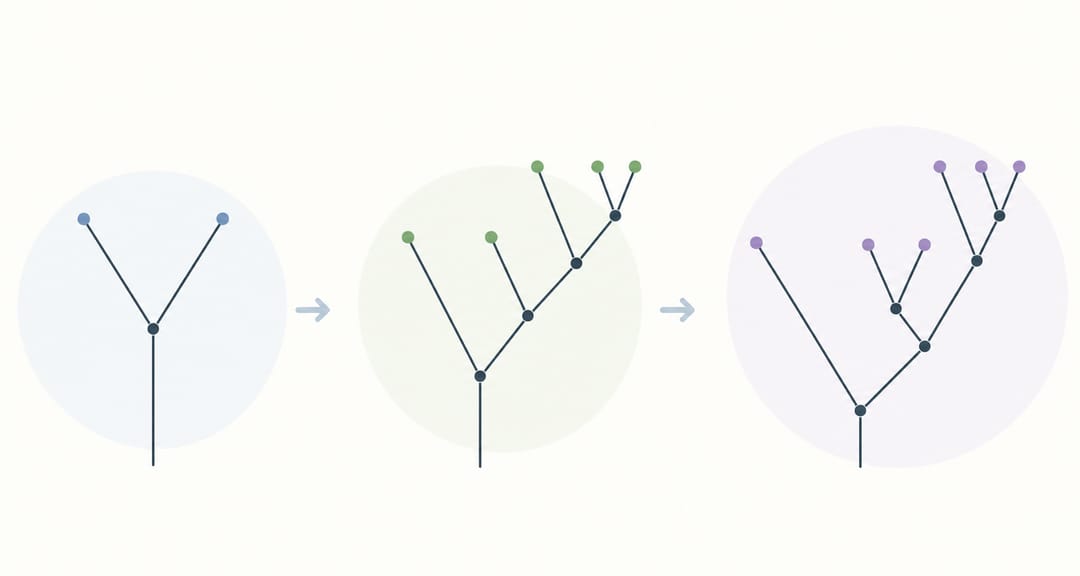 Nesting clades step by step: each new branch adds one shared derived trait.
Step 6 — Draw the Cladogram
Now convert the nested structure into a branching diagram. Here is the standard drawing convention:
- Draw a horizontal baseline (the "stem").
- Add vertical lines rising from the baseline; each vertical line leads to a taxon name or a node.
- At each node (branching point), write or annotate the synapomorphy that defines that clade.
- Place the outgroup on the far left.
- Taxa branch from left (most basal) to right (most derived) — or bottom to top in vertical layouts.
Annotating the tree:
- Mark synapomorphies on the branch where they first appear, not at the tips.
- Use tick marks or labeled bars on branches.
- Do NOT label the outgroup's characters as if they are shared with the ingroup.
Quick-Reference Drawing Checklist
| Step | What to do |
|---|---|
| 1 | Draw outgroup on far left/bottom |
| 2 | Extend a single branch to all ingroup taxa |
| 3 | Mark the first synapomorphy at the ingroup node |
| 4 | Branch off the taxon(a) that lack the next character |
| 5 | Continue nesting inward for each additional character |
| 6 | Label all nodes and character transitions |
| 7 | Check: every clade is monophyletic |
Step 7 — Check Your Tree
Before you call it finished, run these sanity checks:
- Parsimony: Does your tree require the fewest possible evolutionary changes? If a character appears twice on your tree, consider whether a different topology would need fewer changes.
- Monophyly: Every clade should contain an ancestor and ALL its descendants — no paraphyletic or polyphyletic groups.
- Outgroup contrast: Every character coded as "1" in the ingroup should be coded "0" in the outgroup (if you chose your outgroup correctly).
- Character independence: No two characters should be redundant (e.g., "has wings" and "can fly" often co-occur and may not be independent).
Worked Example: Vertebrate Cladogram
Putting it all together, the final vertebrate cladogram looks like this (described in words since this is text):
Lancelet ─────────────────────────────────────┐
                                              │ (outgroup)
Lamprey ──────────────────────────┐           │
                                  │ vertebrae │
Shark ───────────────┐            │           │
Salmon ──────────────┤ jaws       │           │
                     │            │           │
Frog ──────┐         │            │           │
           │ limbs   │            │           │
Lizard ──┐ │         │            │           │
         │ amniote   │            │           │
Rabbit ─┐│           │            │           │
Human ──┘│ mammals   │            │           │
Reading from bottom (or left) to top (or right), each nested group adds one new synapomorphy. The cladogram clearly shows that rabbits and humans are more closely related to each other than either is to a frog, and frogs are more closely related to lizards than to sharks.
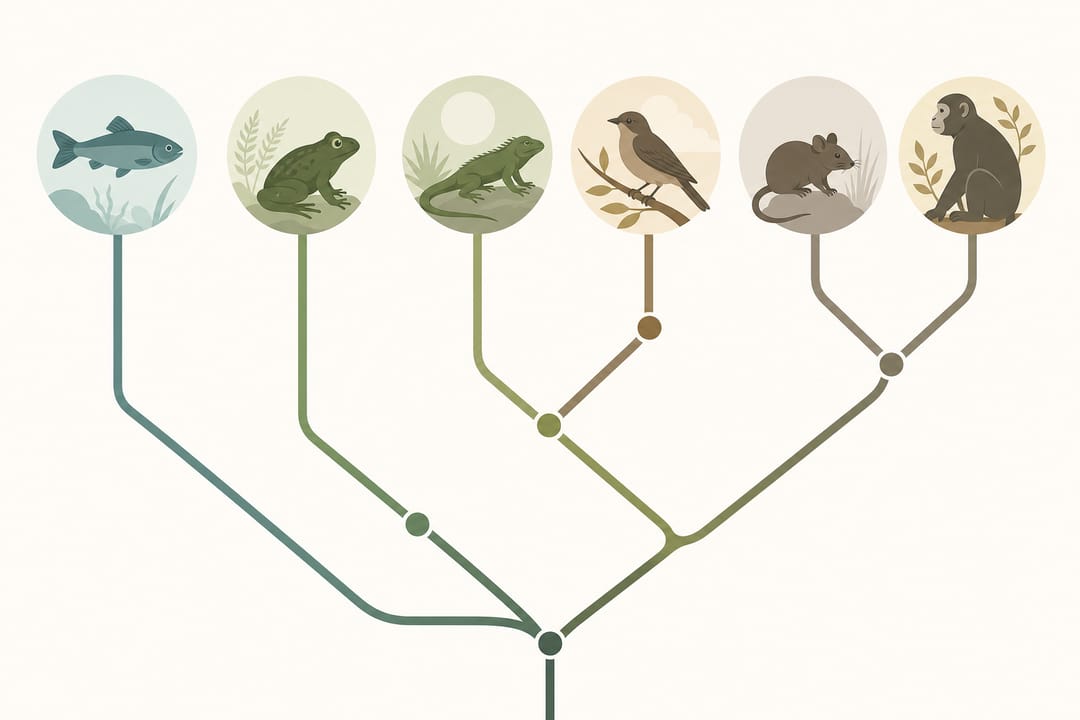 The finished tree: more recent shared nodes mean more closely related taxa.
How to Read a Cladogram
Once you have a cladogram, here's how to interpret it:
- Sister taxa: Two taxa that share a most-recent common ancestor. Rabbit and human are sister taxa in our example at the mammal node.
- Recency of common ancestry: The more recently two taxa share a node, the more closely related they are.
- Branch rotation: Rotating branches around a node does NOT change the relationships. A cladogram rotated 180° represents exactly the same topology.
- Tip order: The left-to-right (or top-to-bottom) order of tips does not indicate relatedness — only the nodes do.
Common Mistakes to Avoid
- Confusing branch order with relatedness — only nodes matter.
- Using analogous characters — convergent evolution will mislead your tree.
- Forgetting the outgroup — without one, you cannot polarize characters.
- Too few characters — a tree built on one or two characters is unreliable.
- Coding polymorphic characters carelessly — if a character is present in some but not all members of a species, decide on a principled rule (e.g., majority rule).
Building Cladograms with SciDraw AI
Drawing a cladogram by hand on paper is good for learning. Drawing one in a presentation or paper requires a cleaner result. SciDraw AI's cladogram maker lets you describe your taxa and their relationships in plain text and get a polished, publication-ready diagram in seconds. You can also switch to the phylogenetic tree maker when your data includes branch lengths or time calibrations.
Both tools output vector-ready figures that you can drop directly into a manuscript, poster, or slide deck — no graphic design experience needed.
FAQ
Q: What is the difference between a cladogram and a phylogram? A: A cladogram shows only the branching pattern (topology) — branch lengths have no meaning. A phylogram is a type of phylogenetic tree where branch lengths represent the amount of evolutionary change (e.g., number of substitutions per site).
Q: How many taxa should I include in a cladogram? A: For teaching, 5–10 taxa is ideal. For research, there is no hard limit — modern computational methods handle hundreds or thousands of taxa, though manual drawing is only practical for small trees.
Q: Can I make a cladogram without a character table? A: Technically yes — if you already know the topology from published literature, you can draw it directly. But building a character table is the rigorous way to derive a cladogram from raw data.
Q: What software is used to build cladograms in research? A: Common tools include PAUP*, TNT (for parsimony), RAxML and IQ-TREE (for maximum likelihood), and BEAST (for Bayesian time-calibrated trees). For figure-making, SciDraw AI's cladogram maker generates clean diagrams from simple descriptions.
Q: What is an outgroup and why is it required? A: An outgroup is a taxon outside your study group that is used as a reference. It allows you to determine which character states are ancestral (shared with the outgroup) and which are derived (unique to the ingroup), a process called character polarization.
Q: How do I know if my cladogram is correct? A: Apply the principle of parsimony — the best cladogram requires the fewest total evolutionary changes. Computer programs test thousands of possible topologies and report the most parsimonious tree. For a small hand-built tree, count the number of character-state changes required by your tree and compare it to alternative arrangements.