Free Phylogenetic Tree Maker
Generate a labeled evolutionary tree from plain text
Describe your species, genes, or sequences and the relationships between them, and AI draws a clean, labeled phylogenetic tree showing evolutionary history — ready for research papers, presentations, and biology courses.
Phylogenetic tree examples
Click any example to load its prompt, or use it as a starting point for your own evolutionary tree diagram.
What is a phylogenetic tree?
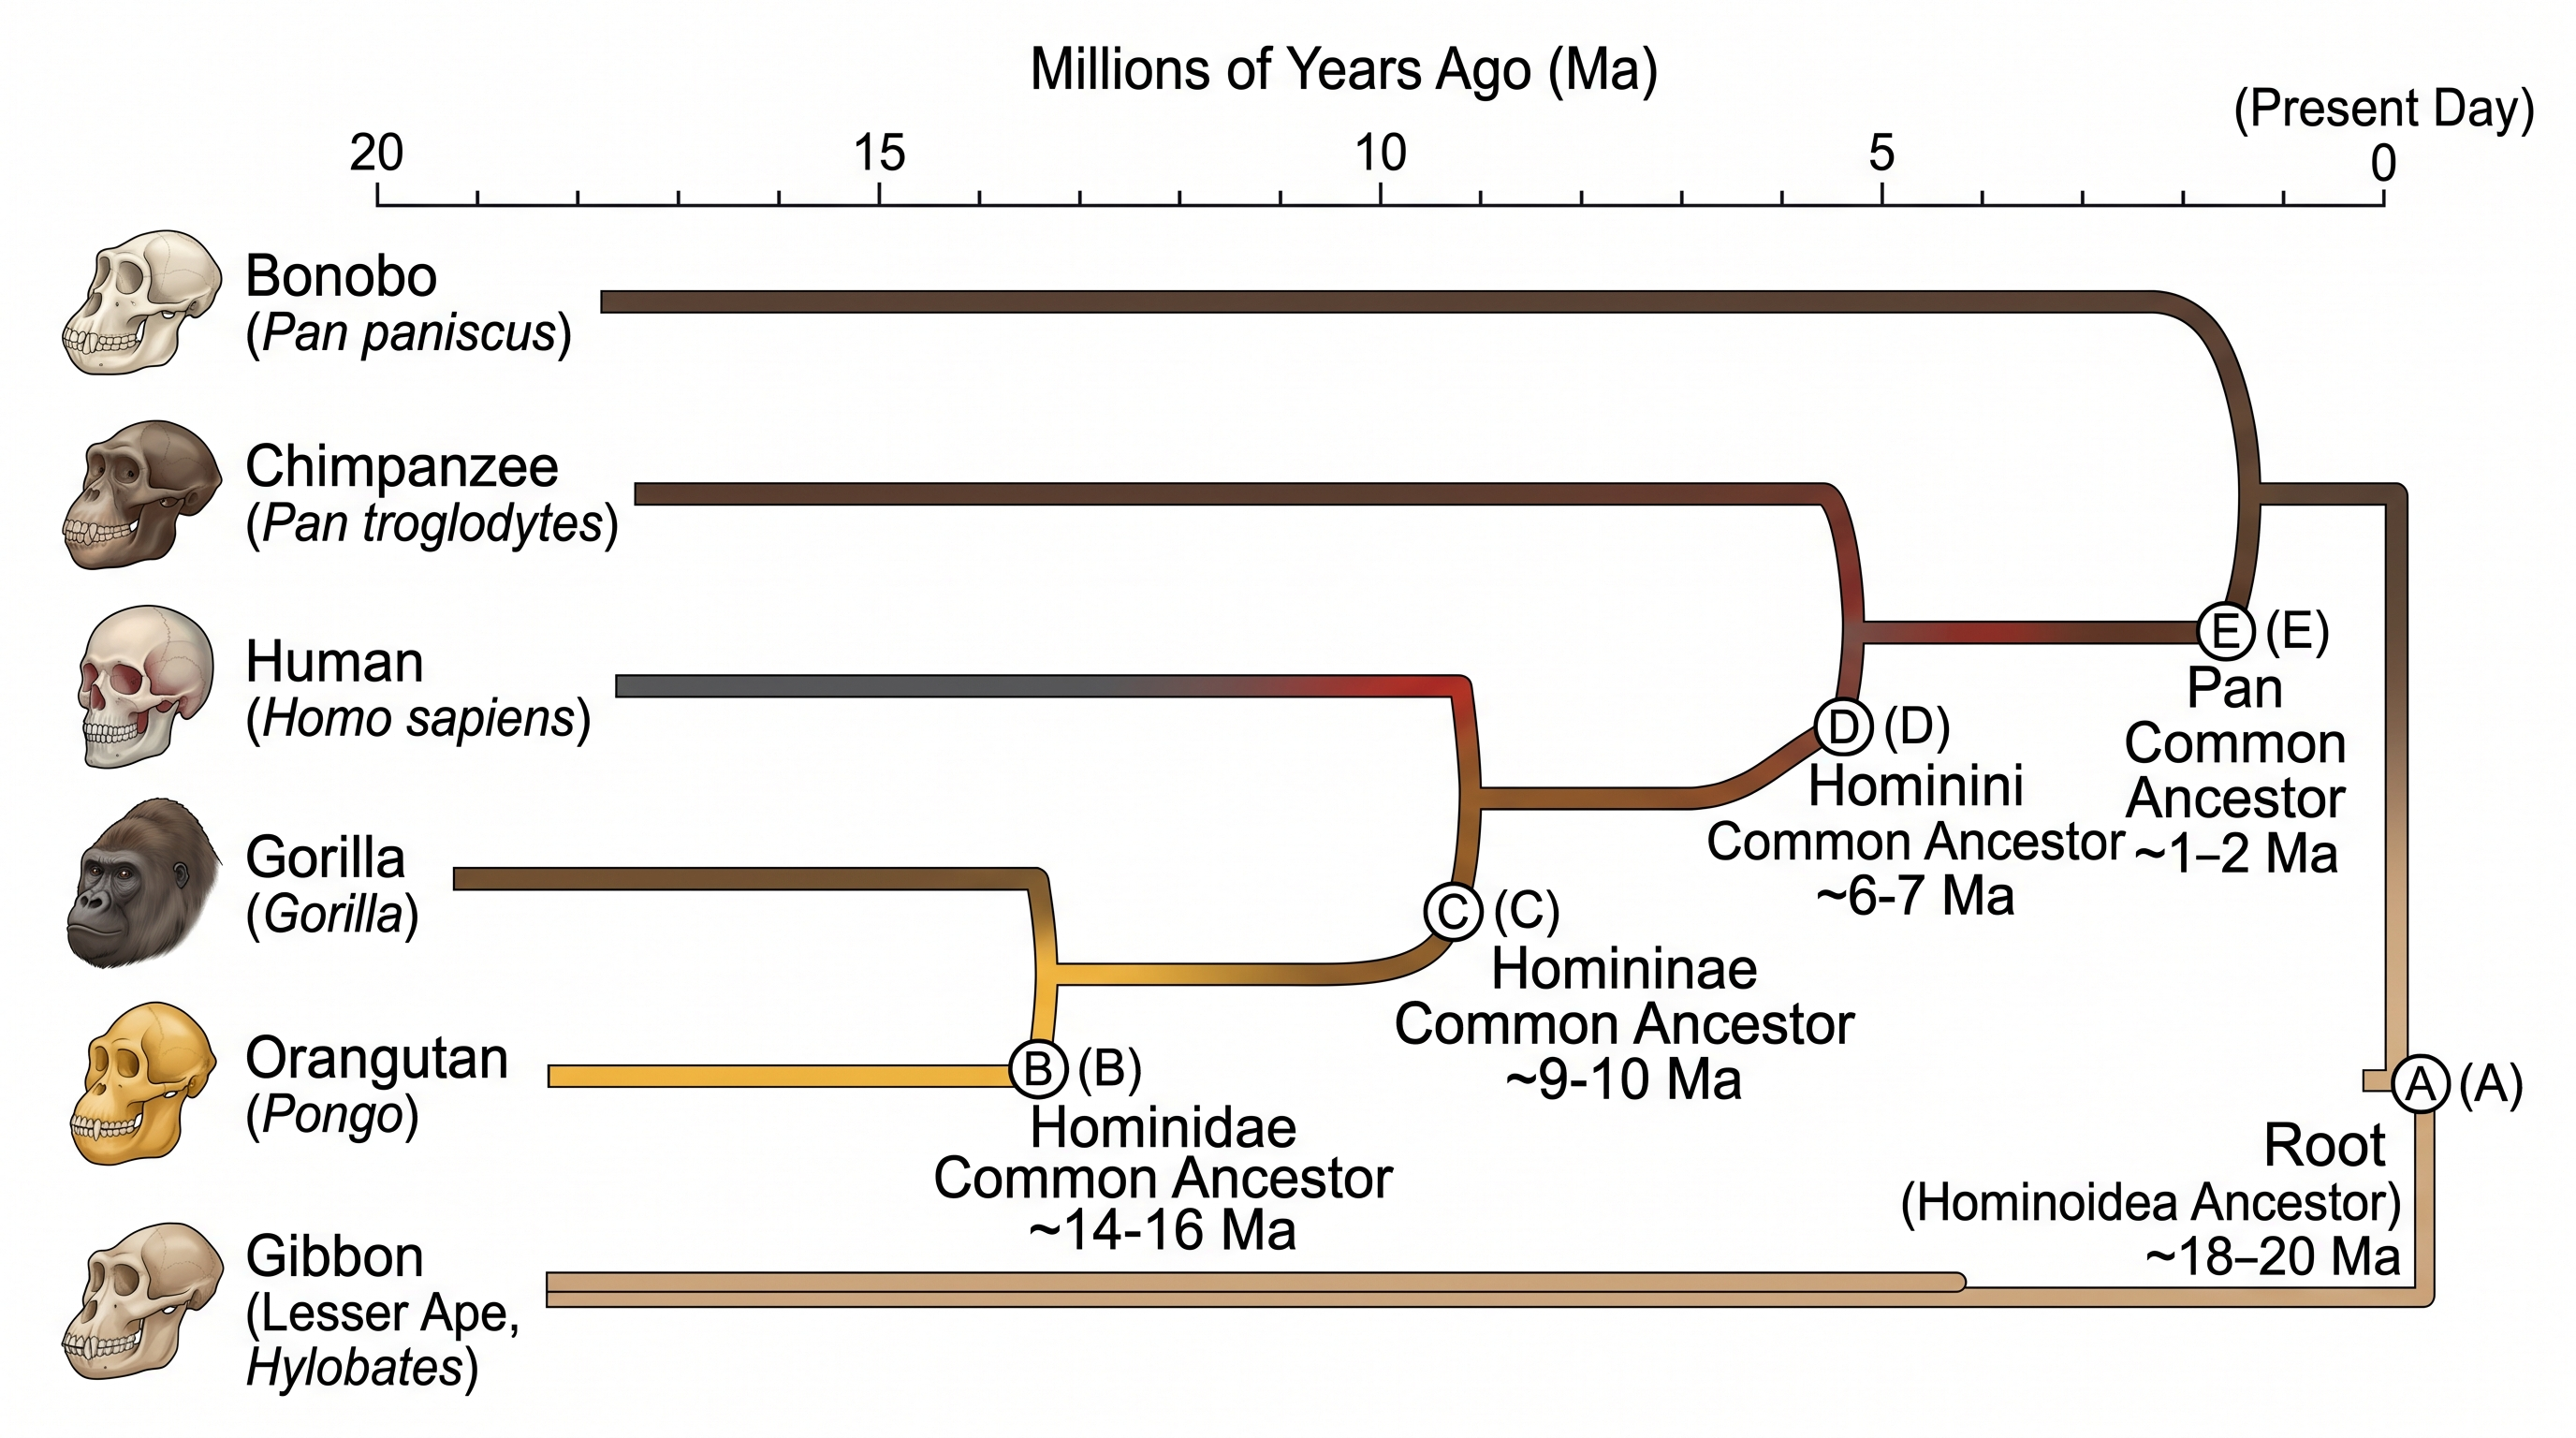
A phylogenetic tree (also called an evolutionary tree, phylogeny diagram, or part of the tree of life) is a branching diagram showing how species, genes, or strains are related through shared common ancestors. Tips at the ends represent the taxa being compared, internal nodes mark common ancestors, and branch lengths can encode genetic divergence or evolutionary time. This phylogenetic tree maker takes the taxa and relationships you describe and draws a clean, labeled phylogenetic tree diagram for you. It lays out and annotates the figure rather than inferring phylogeny from raw sequence data, so it is ideal for redrawing published trees or illustrating evolutionary relationships clearly.
Why use a phylogenetic tree maker
- Phylogenetic trees are foundational in evolutionary biology, genomics, epidemiology, and comparative anatomy — students and researchers build them constantly.
- Specialist software like MEGA, IQ-TREE, or FigTree has a steep learning curve and expects raw sequence data just to draw a figure.
- Drawing an evolutionary tree from a plain-text description is far faster than wrestling with SVG exports from bioinformatics pipelines.
- Branch lengths let a phylogenetic tree show divergence times or genetic change — quantitative meaning a simple cladogram cannot convey.
- A clean, labeled phylogeny diagram makes evolutionary relationships easy to read in papers, slides, posters, and biology lessons.
How to make a phylogenetic tree
List your taxa — species, genes, or strains — and describe the relationships you want to show: branching order, which taxon is the outgroup, any branch length information (divergence times or genetic distances), and node labels such as common ancestor names or bootstrap support. For a molecular tree, mention the marker used (e.g. 16S rRNA, cytochrome b, ITS); for a time-calibrated tree, add approximate divergence dates. Generate the tree, then check that sister groups match the evolutionary relationships you intend. Refine your description to adjust the topology, branch lengths, or labels until the phylogenetic tree diagram reads the way you want.
Parts of a phylogenetic tree
- Taxa (leaf tips) — the species, genes, or strains being compared, placed at the ends of the branches.
- Branches — the connecting lines that trace lines of descent from ancestors to their descendants.
- Internal nodes — branching points that represent the hypothetical common ancestors shared by the groups descending from them.
- Root — the oldest common ancestor of every taxon in the tree, usually set with an outgroup that orients the whole figure.
- Branch lengths — in a true phylogenetic tree (unlike a cladogram) these can be scaled to genetic change or to evolutionary time.
- Clades and labels — named groups, outgroup markers, and support values (bootstrap or posterior probabilities) that annotate the tree.
Phylogenetic Tree Maker FAQ
What is a phylogenetic tree?
A phylogenetic tree, also called an evolutionary tree or phylogeny, is a branching diagram showing the inferred evolutionary relationships among species, genes, or strains through shared common ancestors. Tips are the taxa, internal nodes are common ancestors, and branch lengths often represent genetic divergence or time — unlike a cladogram, where branch lengths carry no meaning.
How do I make a phylogenetic tree online?
Describe your taxa and how they are related — branching order, the outgroup, optional branch lengths or divergence times, and any node labels — and this online phylogenetic tree maker draws a clean, labeled evolutionary tree for you. There is no software to install: you build a phylogenetic tree from plain text, then refine the description to adjust topology, branch lengths, or annotations.
What is the difference between a phylogenetic tree and a cladogram?
A cladogram shows only the order of branching — who is more closely related to whom — with no scale, so its branch lengths are arbitrary. A phylogenetic tree keeps that topology but can scale branch lengths to genetic change (substitutions per site) or to time in a time-calibrated tree. Use a phylogenetic tree when branch lengths should carry meaning; if you only need relative relatedness, see our separate cladogram maker.
How do I read a phylogenetic tree?
Read a phylogenetic tree from the tips back toward the root. Tips are the taxa being compared; trace two tips back until their branches meet, and that node is their most recent common ancestor. Taxa that share a more recent node are more closely related. When branch lengths are scaled, longer branches mean more genetic change or elapsed time, and a clade is any ancestor together with all of its descendants.
Is it free?
Each generation uses a small number of credits, and new accounts receive free credits, so you can make a phylogenetic tree without any subscription. Additional credits are available if you need to draw many figures.
Can I use it for biology class and research paper figures?
Yes. The trees are clean and publication-quality, so they work well for biology assignments, lecture slides, posters, and figures in reviews or textbooks that summarize published phylogenies. For primary research, confirm the drawn topology matches your inferred phylogeny and cite your data source, since this tool draws and labels the tree rather than computing it from sequence alignments.
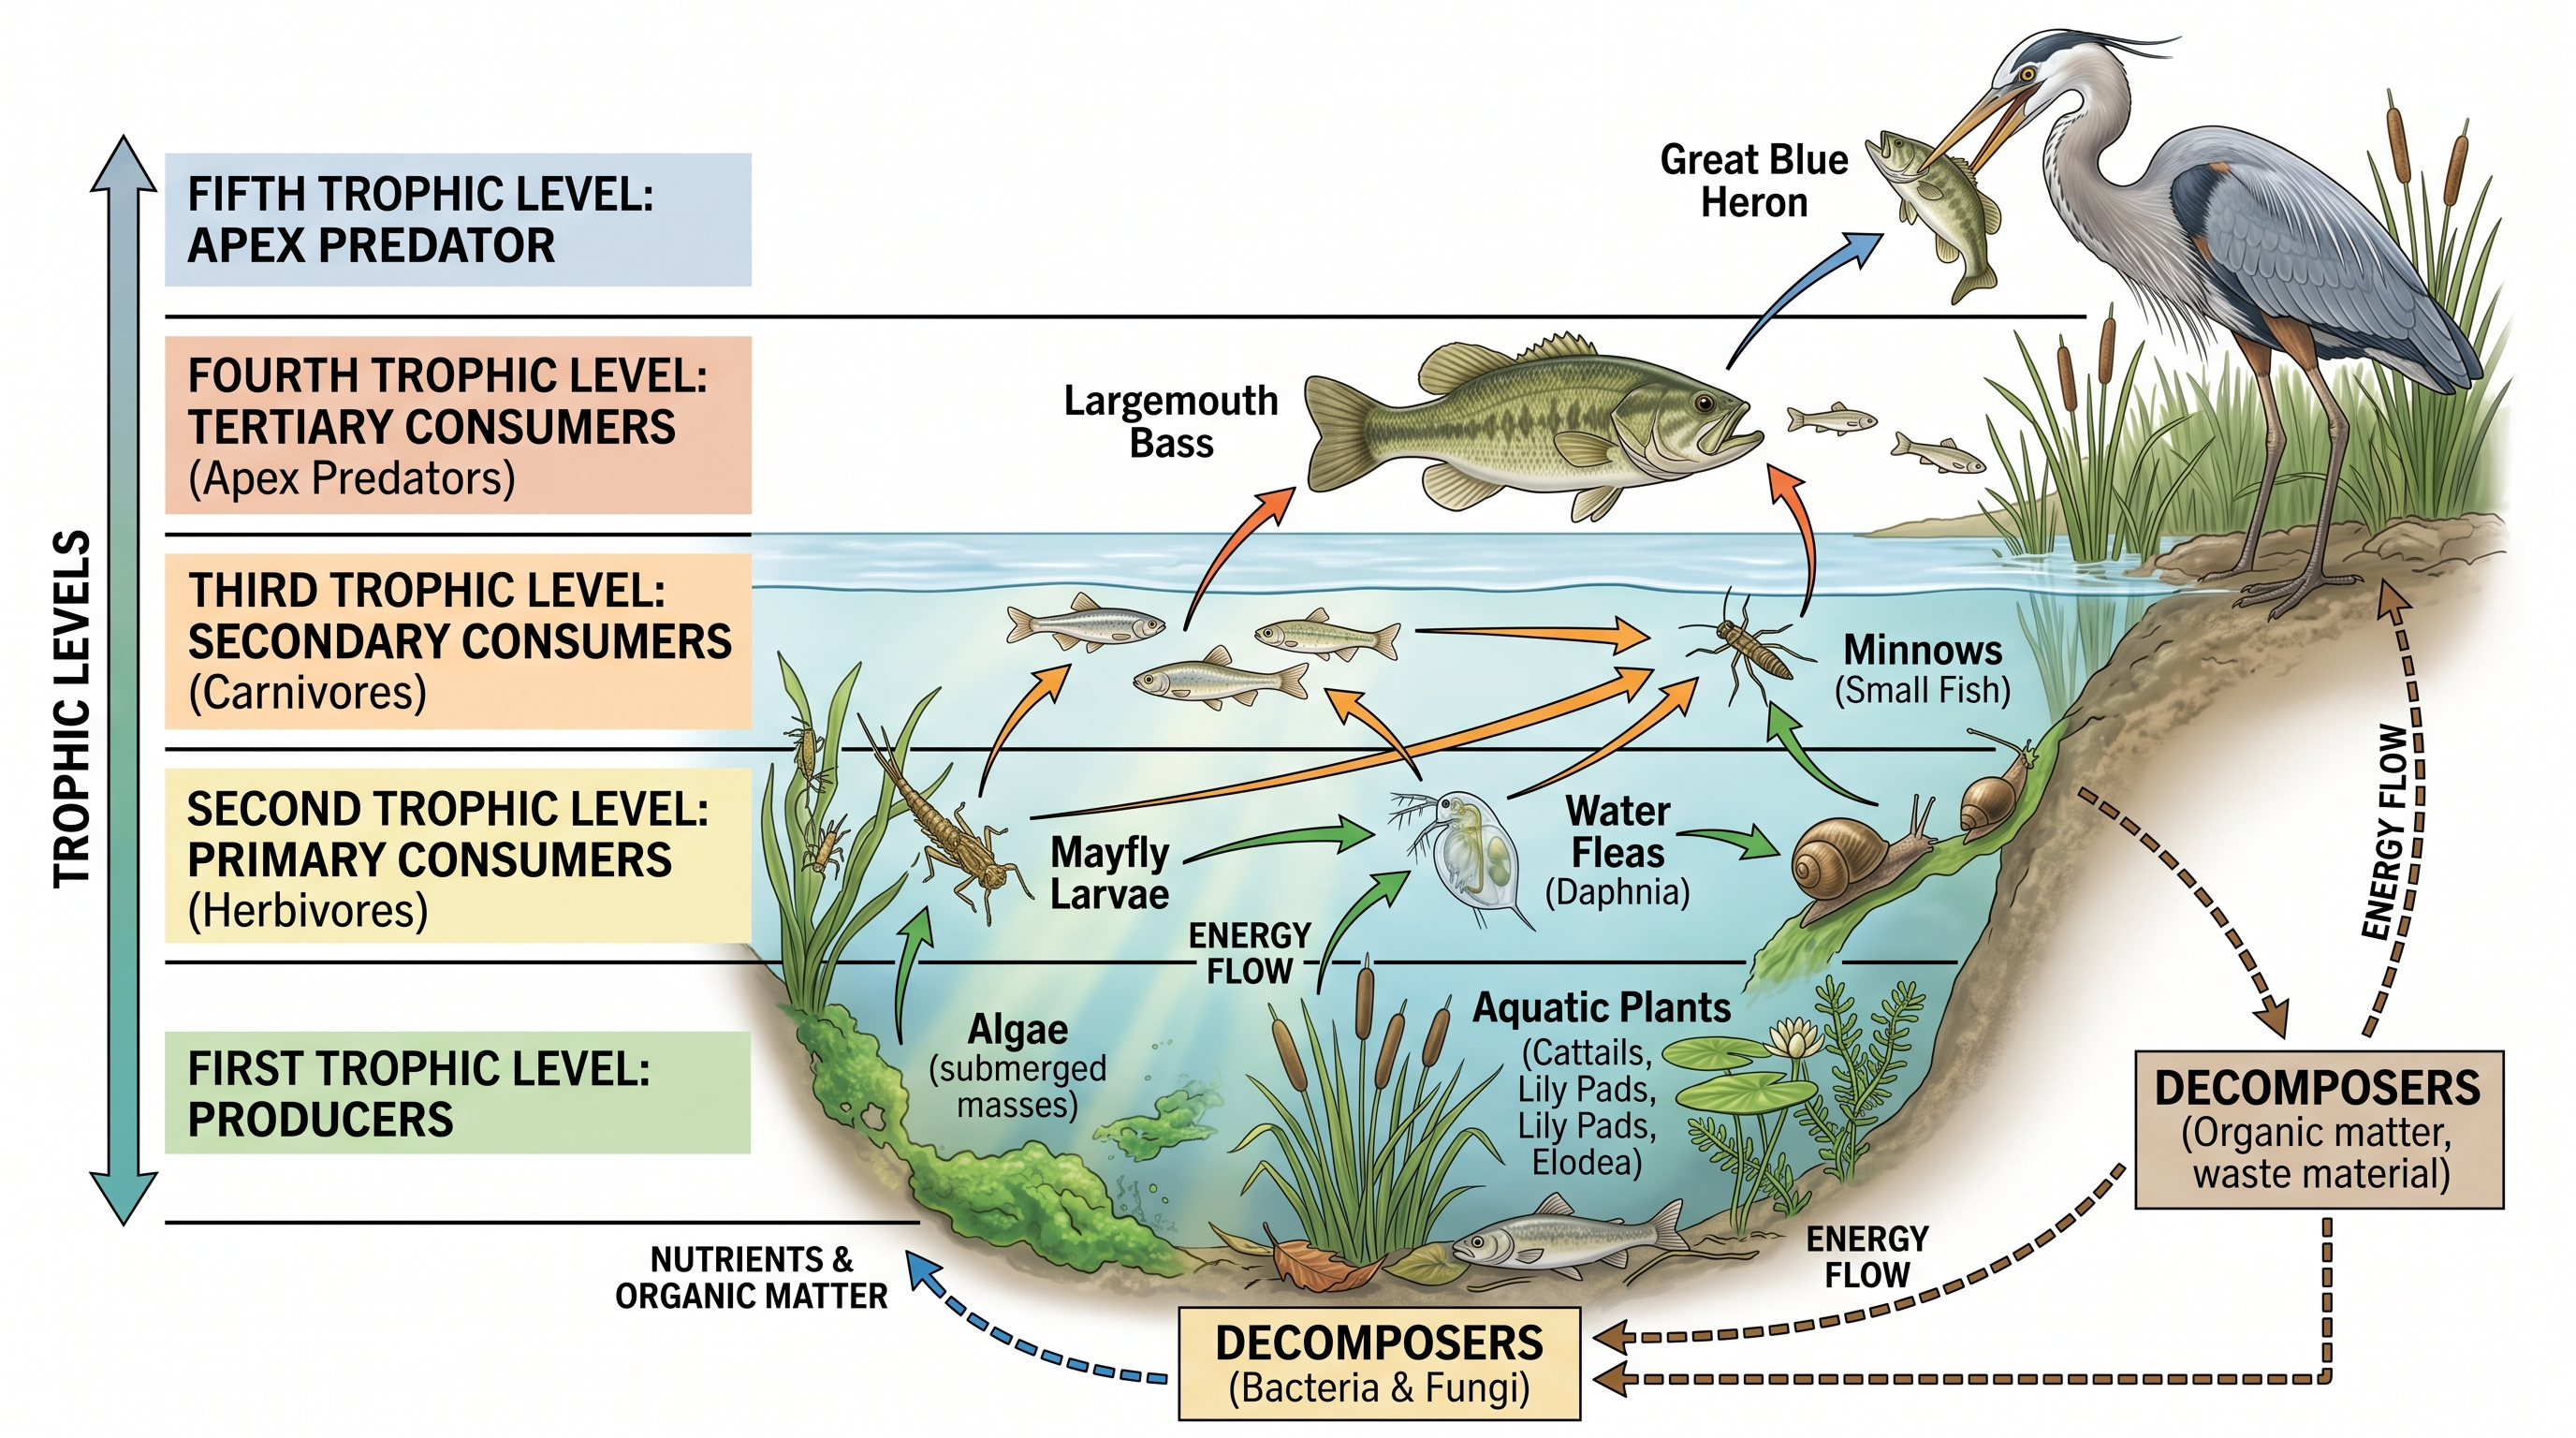
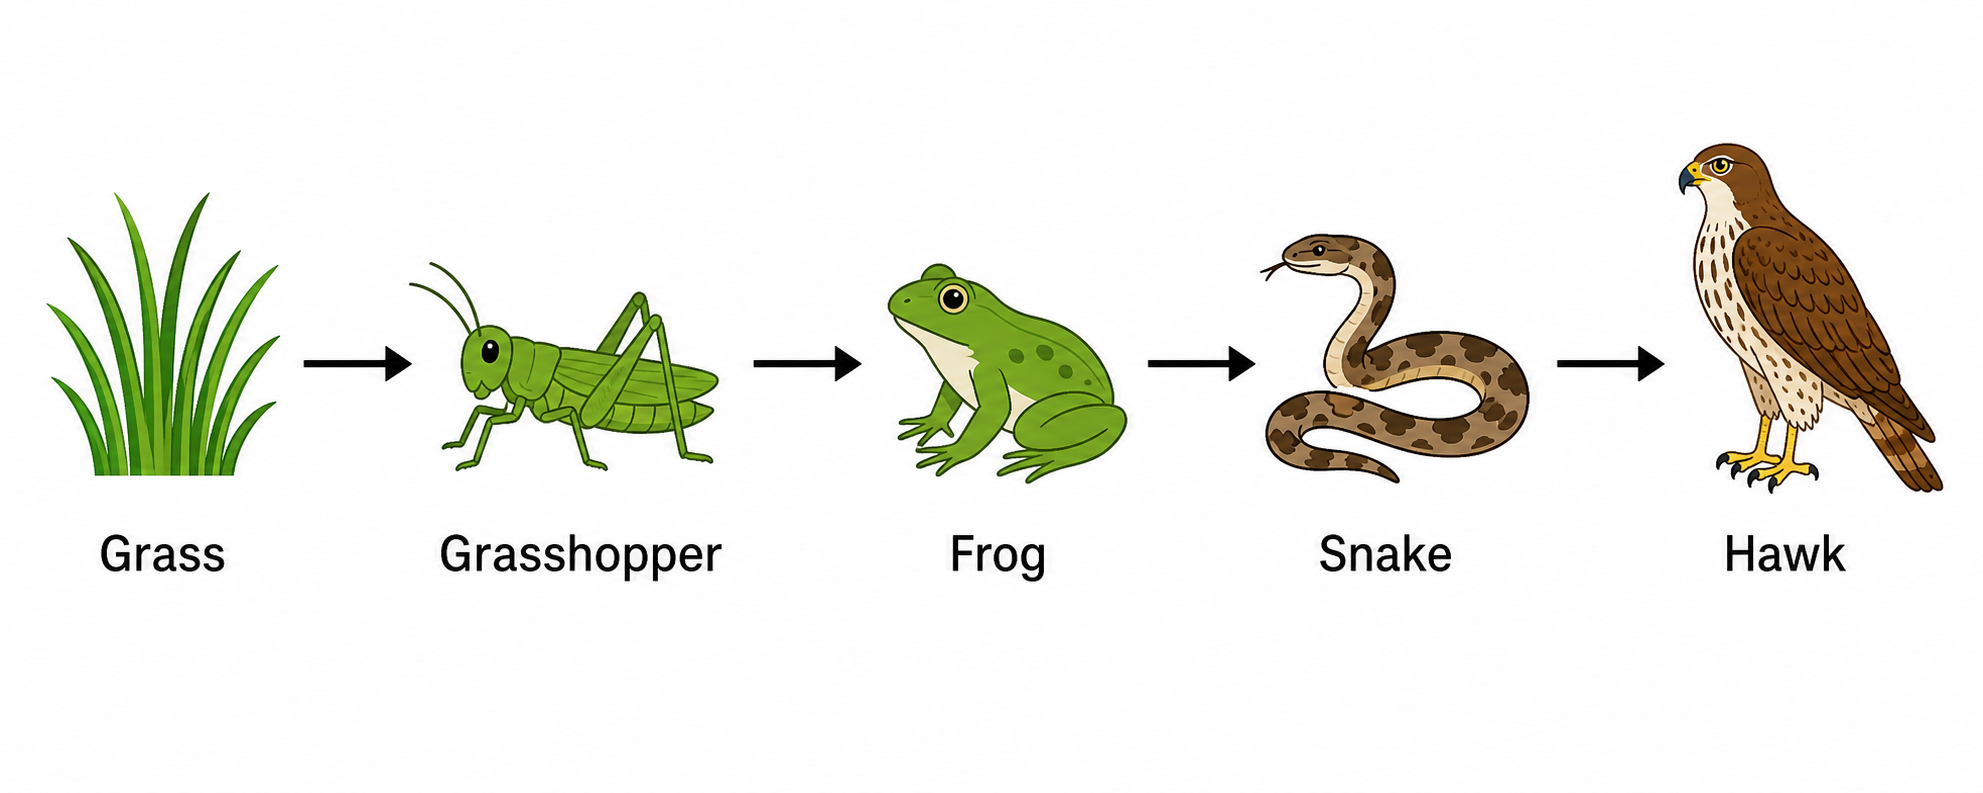
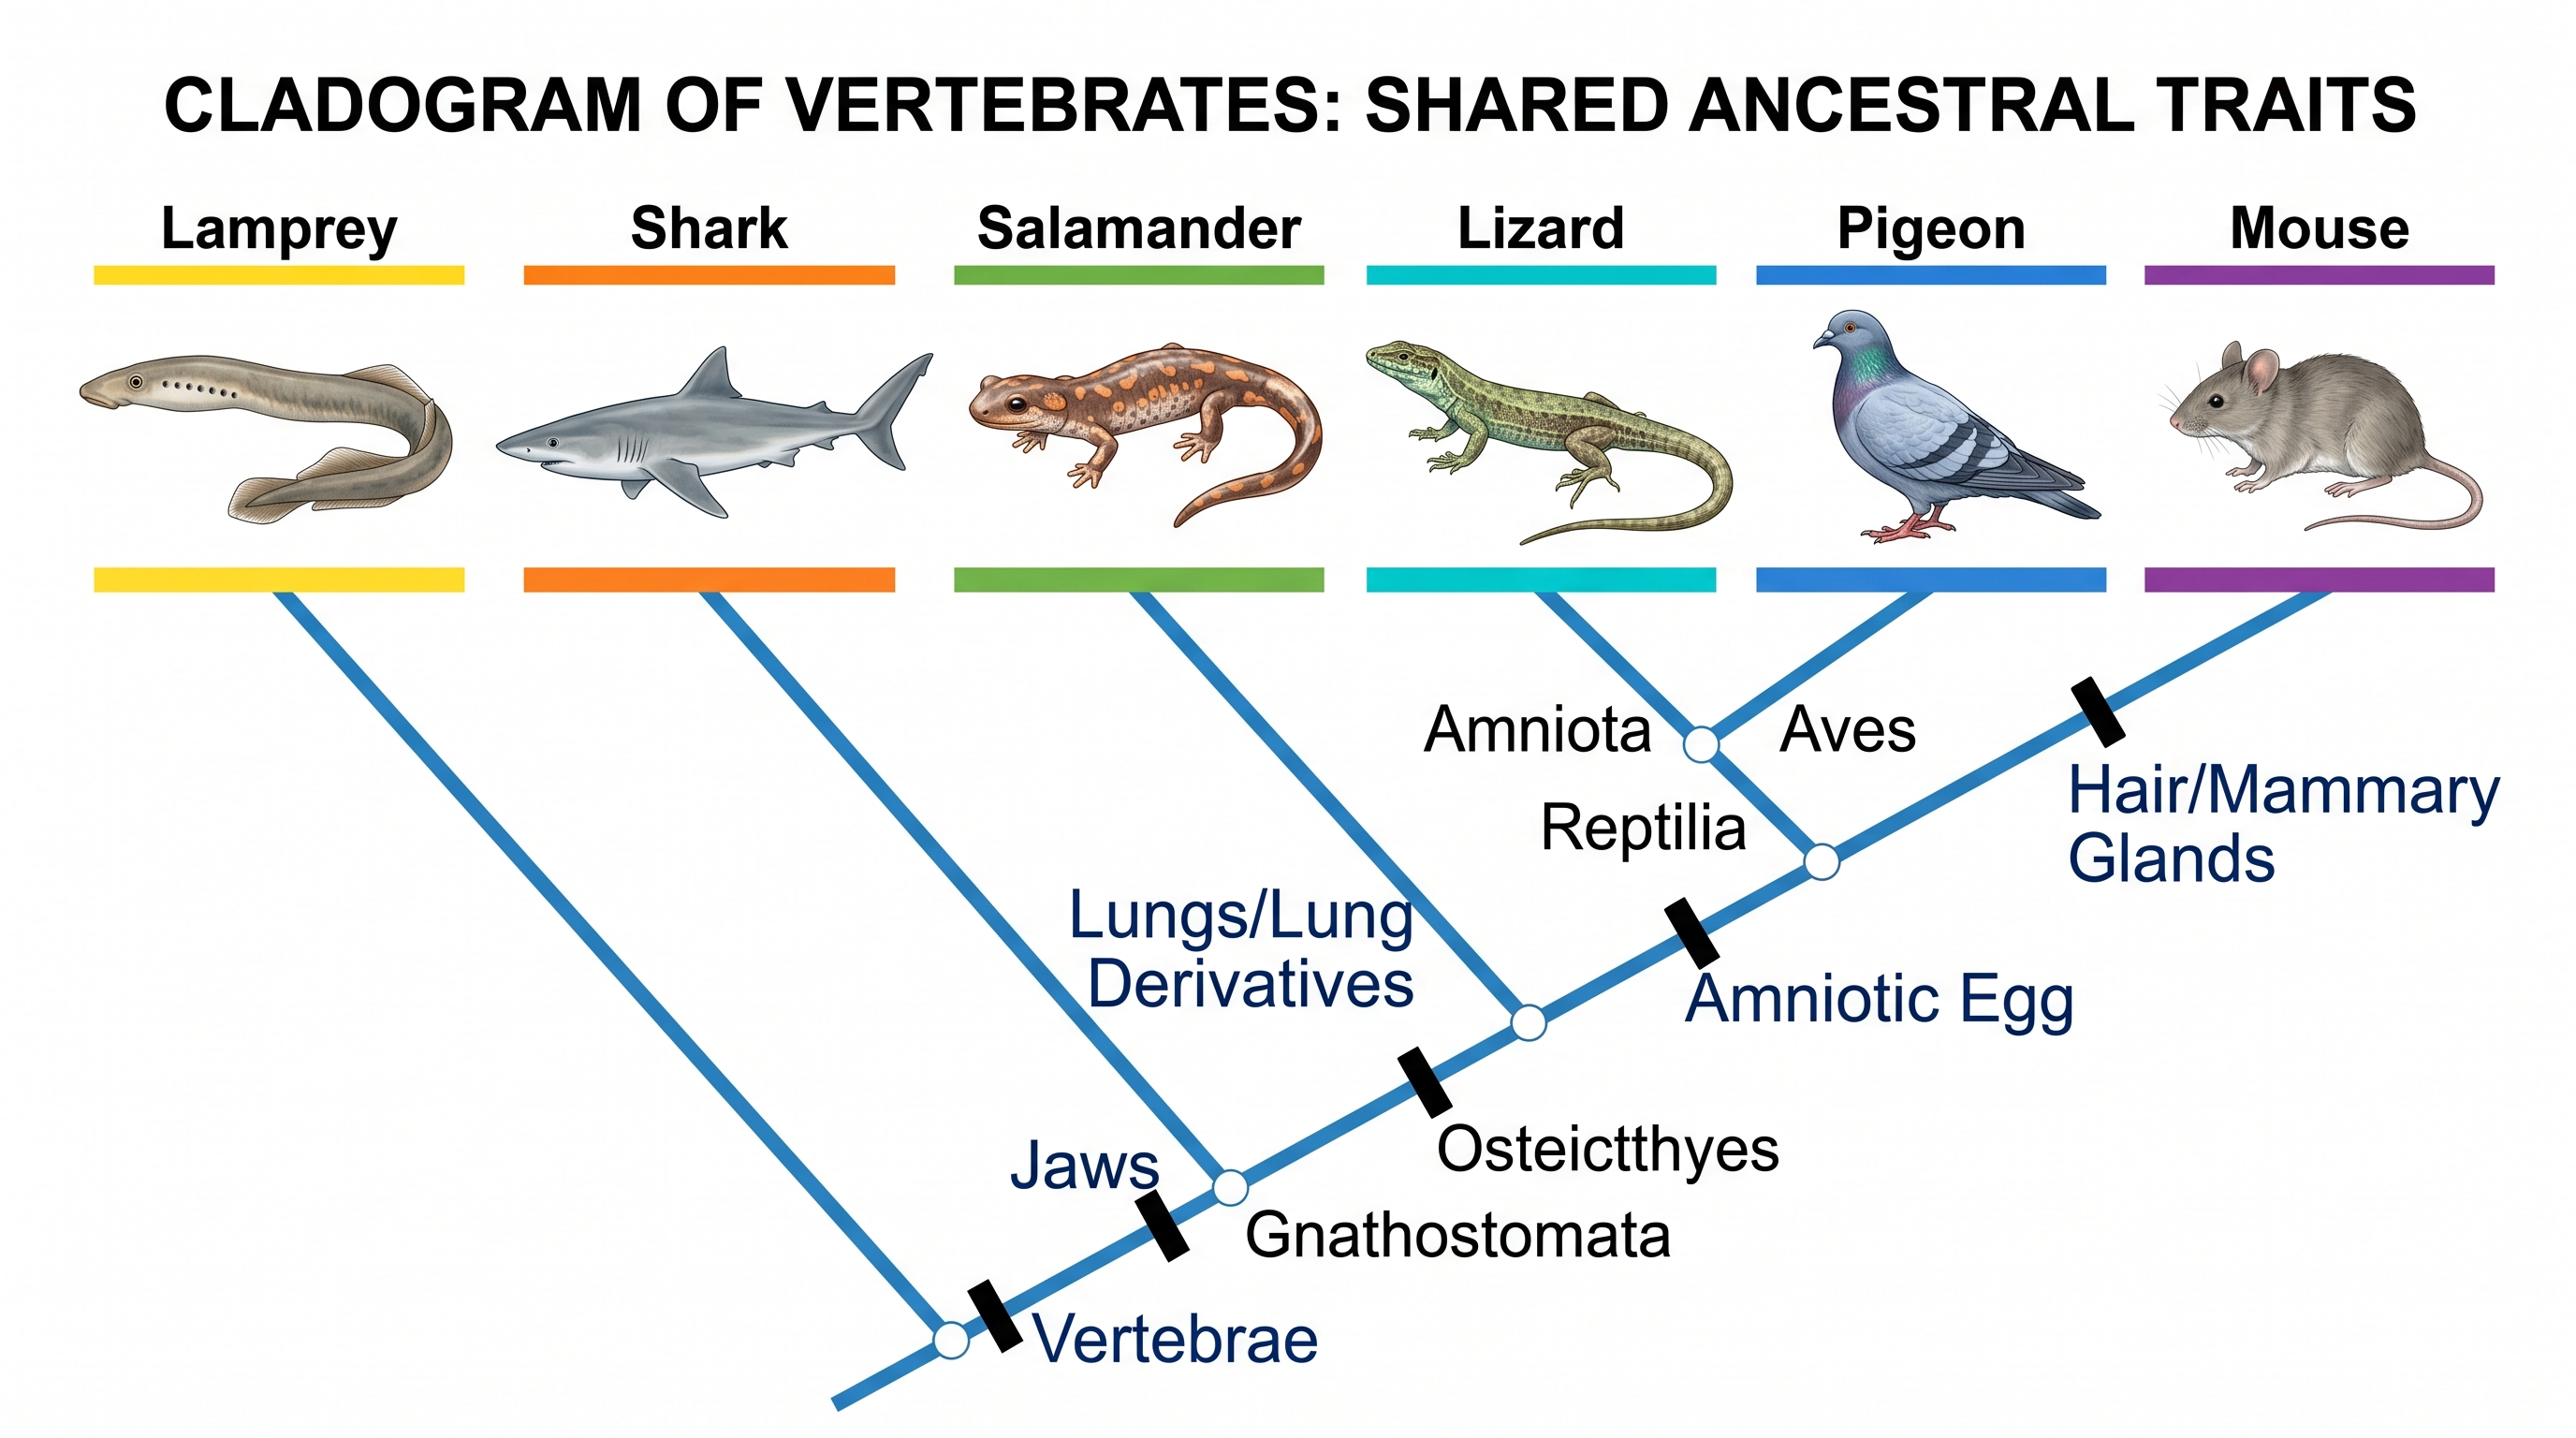
Need other evolutionary or biology diagrams?
Generate cladograms, cell diagrams, metabolic pathways, and more with SciDraw AI.