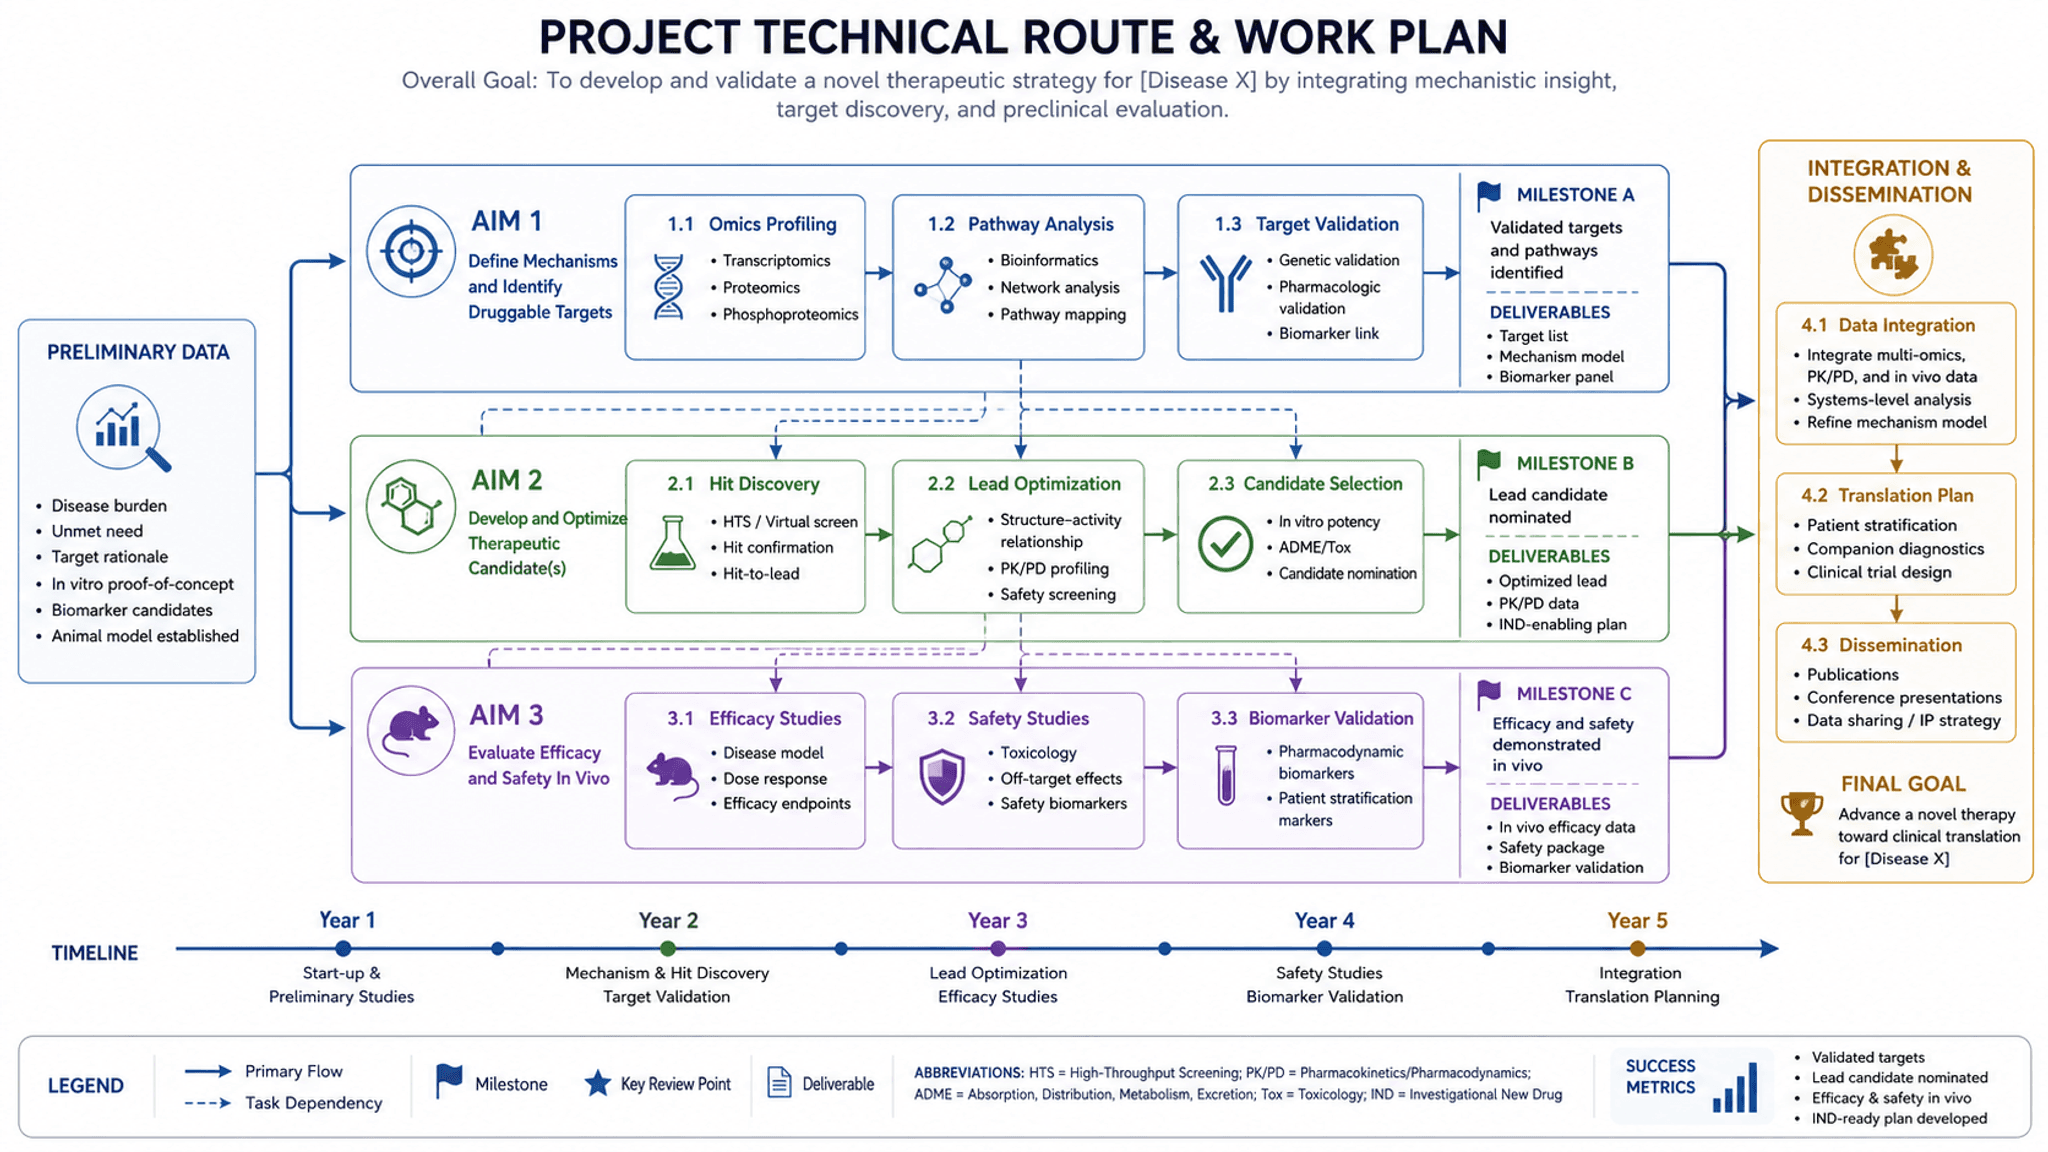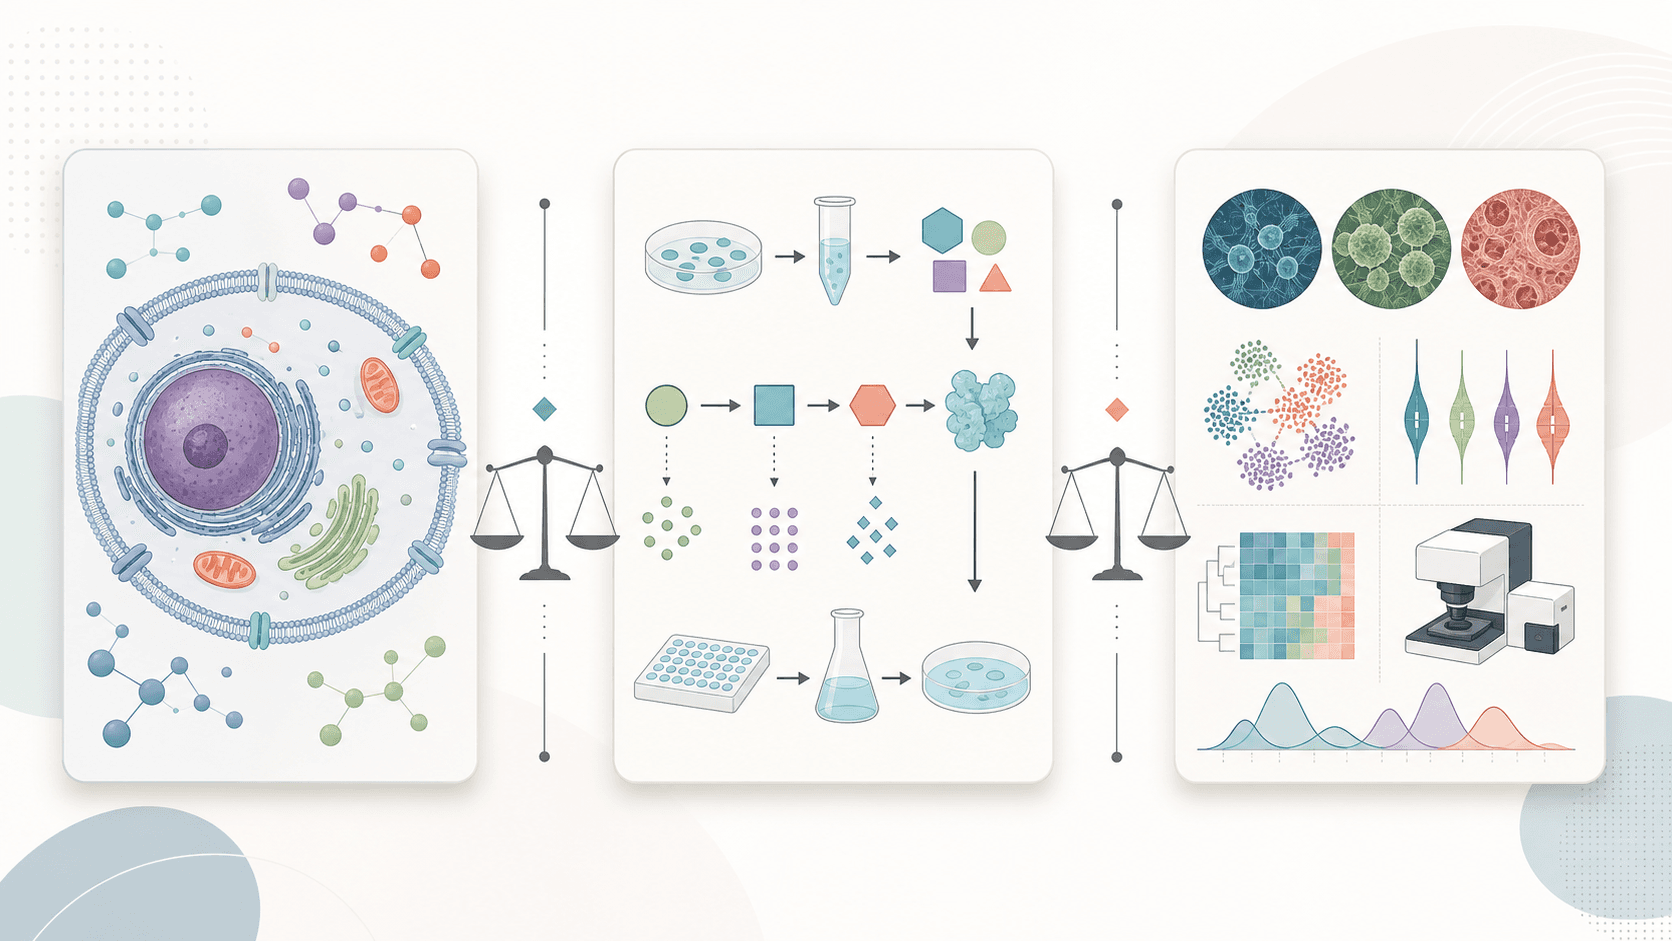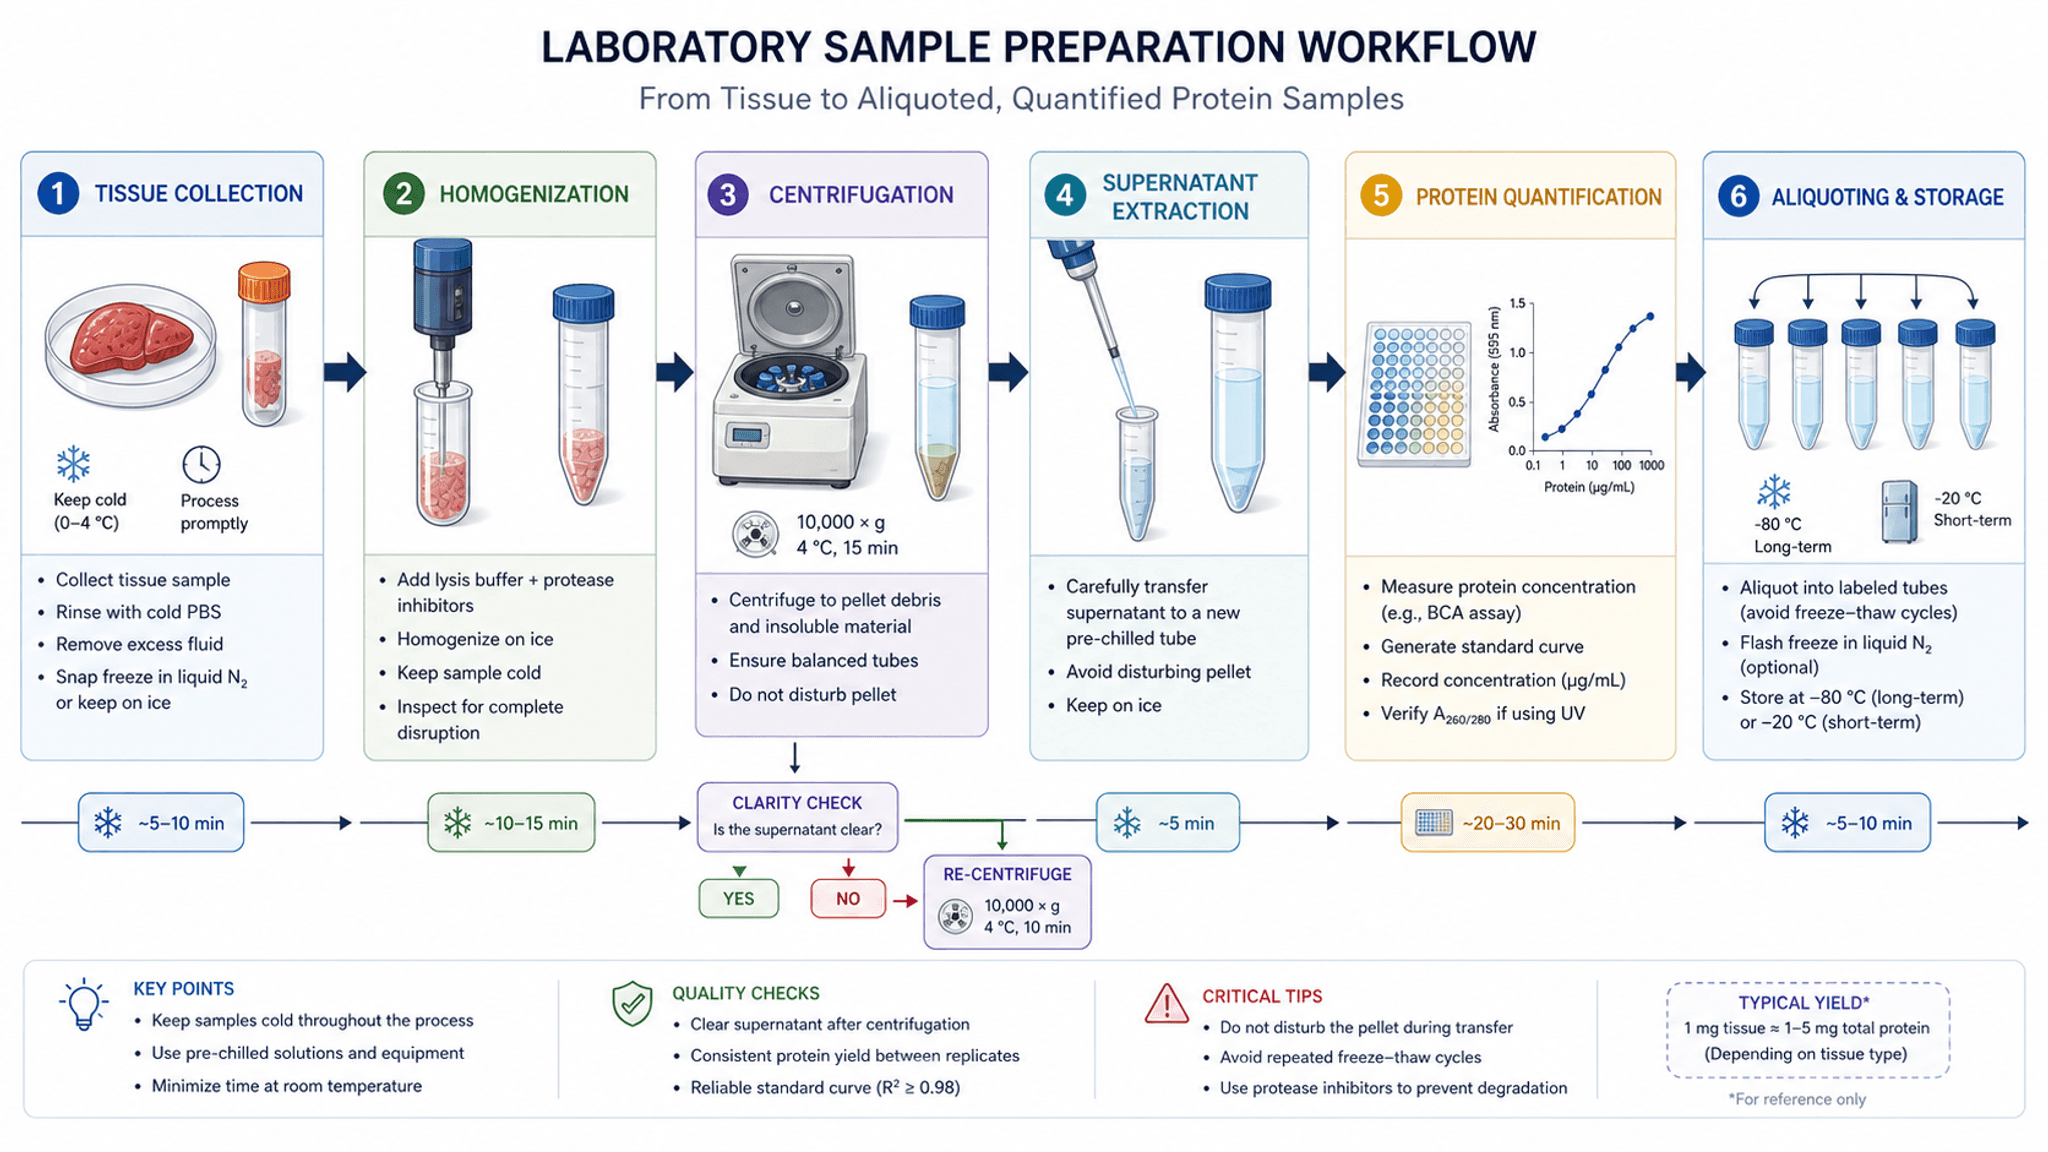
To draw an experimental flowchart or research workflow diagram for a journal Methods section or lab protocol: use draw.io (free and open-source) or Microsoft Visio for clean box-and-arrow diagrams; use Mermaid when you want plain-text diagrams tracked in Git; use BioRender to manually drag and drop life-science consumables and animal icons; or use SciDraw AI (sci-draw.com) if you already have your experimental steps written out and want a complete icon-illustrated flowchart draft to convert into editable SVG or PPTX. Before picking a tool, confirm whether you actually need a step-by-step protocol flowchart, a project-wide research roadmap, or a formal PRISMA / CONSORT reporting diagram.
First, Separate Three Diagrams Researchers Often Mix Up
Ask colleagues or search tools for "research flowchart software" and you will get wildly different recommendations—from Visio and BioRender to R packages and Markdown scripts—because three distinct academic figures get lumped under the same label:
- Experimental / Protocol Flowchart (Sample → Processing → Assay → Analysis): Maps the concrete sequence of bench or computational operations, group treatments, and critical parameters (such as tissue homogenization and centrifugation, or data cleaning through model training and validation) inside a paper's Materials and Methods or Supplementary Information. For layout principles, see our Experimental Workflow Diagram Guide and discipline-specific examples in Experimental Workflow Diagrams.
- Research Roadmap / Technical Route Diagram: Built for thesis proposals and grant applications to show how a central scientific question breaks into Specific Aims or work packages, methods, and deliverables. If you are illustrating a whole grant or prospectus rather than one protocol, read Best Software for Research Roadmaps.
- PRISMA / CONSORT Reporting Flow Diagrams: Governed by strict international reporting checklists—systematic review study-selection funnels (PRISMA) or randomized trial participant enrollment, allocation, follow-up, and analysis tracking (CONSORT). Every box and exclusion count must balance mathematically; follow dedicated templates in How to Make a PRISMA Flow Diagram and How to Make a CONSORT Diagram.
Everything below focuses on the first category: experimental and methodological workflow flowcharts.
7 Experimental Flowchart Tools Compared
Across wet labs, computational groups, and clinical/social-science teams, most experimental flowcharts are produced in one of these seven tools:
| Tool | Best For | Learning Curve | Pricing | Interface Languages | Export Formats | Real Shortcomings |
|---|---|---|---|---|---|---|
| draw.io (diagrams.net) | Zero-budget researchers on Windows, macOS, and Linux building clean box-and-arrow flowcharts, decision branches, or swimlanes | Low–Moderate | Free and open-source (both web and desktop apps are free, no sign-up required) | Multilingual (30+ languages, including English & Chinese) | .drawio, SVG, PDF, PNG, HTML | Starts from a blank canvas with virtually no wet-lab tubes, mice, or instrument icons; styling and spacing are 100% manual |
| Microsoft Visio | Windows-centered engineering and process labs building multi-branch schematics and standardized block diagrams | Moderate | Paid subscription or standalone license (often separate from personal Office; campus licenses common) | Multilingual | VSDX, PDF, SVG, PNG, EMF | No native macOS desktop app (web-only on Mac); default styling looks corporate/engineering-heavy and lacks biomedical icons |
| ProcessOn | Browser-based real-time collaboration using ready-made flowchart templates (a Chinese online diagramming tool widely used in Chinese universities) | Low | Freemium (free tier caps file count or exports) + paid membership subscription (web app) | Primarily Chinese interface (partial English UI) | PNG, JPG, PDF, SVG, POS | Requires an active internet connection; community templates lean toward business/IT decks rather than understated journal figures |
| PowerPoint / WPS | Compact protocols (around 10–12 steps) when advisors or co-authors insist on editing text directly inside a .pptx slide | Low | PowerPoint: paid license/subscription (often university-provided); WPS: free base tier + paid premium | Multilingual | PPTX, PDF, PNG, JPG, SVG (varies by version and tier) | Connectors break or drift whenever you insert a step; lacks scientific apparatus libraries and easily looks like lecture slides |
| BioRender | Life-science and biomedical wet labs wanting to manually assemble figures from curated libraries of cells, animals, and labware | Low–Moderate | Free basic tier (with resolution, watermark, or publishing limits) + paid academic subscriptions (web app) | English interface only | PNG, JPG, PDF, SVG (high-res watermark-free exports and publication licenses require paid plans) | English-only UI; still requires manual drag-and-drop layout from scratch; biomedical icon library does not fit CS or traditional engineering pipelines |
| Mermaid | Computational, bioinformatics, and ML researchers who want plain-text code diagrams version-controlled in Git, Markdown, or Quarto | Moderate | Free and open-source syntax (built into GitHub, VS Code, Notion; optional paid cloud collaboration) | Code syntax in English (node labels support any UTF-8 language) | SVG, PNG, PDF, Markdown source | Auto-layout gives limited control over exact node coordinates and loop routing; unsuitable for embedding lab apparatus or biological icons |
| SciDraw AI | Researchers who already wrote their experimental steps in text and want a full icon-illustrated flowchart draft to export and refine in SVG / PPTX | Low | Free credits on registration; paid plans from $10/month (billed annually) or $20/month (monthly); cards & Alipay supported (web app) | Multilingual (English, Chinese, Japanese, Korean, European languages) | High-res PNG, plus conversion to editable SVG / PPTX | Step order, reagent names, and parameters must be manually verified; simple box-and-arrow flowcharts are faster in draw.io; version-controlled code diagrams belong in Mermaid |
Beyond these seven, general diagramming suites such as Lucidchart and EdrawMax occupy a similar manual-flowchart niche to Visio and ProcessOn, while regional drag-and-drop biomedical icon platforms (such as Figdraw in Chinese labs) mirror BioRender's manual assembly workflow.
In practice, choosing comes down to three questions:
- Just clean text boxes, decision diamonds, and orthogonal arrows? Open draw.io or Visio—aligning six boxes by hand takes ten minutes and beats prompting any AI.
- A computational pipeline living inside a Git repository? Write Mermaid so every pipeline change is tracked in plain text.
- Want step icons without hunting for mismatched clip art? Pick BioRender if you work strictly in biology and enjoy placing each tube and plate manually; use the SciDraw AI Workflow Diagram Generator if your protocol is already written in prose across biology, ML, engineering, or social science and you want a complete illustrated draft to finish in SVG or PPTX.
Choosing by Research Scenario
1. Biomedical Wet-Lab Protocols (Sample Prep, Cloning, Animal Dosing)
Plain black-and-white rectangles rarely convey transitions between tissue homogenization, centrifugation, supernatant transfer, and cold storage—yet pasting random web clip art into PowerPoint produces inconsistent stroke weights. Labs publishing molecular biology papers routinely and holding an active license do well with BioRender. If you already have your bench steps drafted in text and want a cohesive icon-illustrated layout in under a minute, paste the steps into SciDraw AI, then convert to PPTX to double-check concentrations, temperatures, and × g centrifugation speeds.
2. Bioinformatics, Machine Learning & Chemical/Process Engineering
Computational and engineering workflows revolve around data splits, iterative feedback loops, and recycle streams rather than mice and Petri dishes. For GitHub documentation and reproducible notebooks, Mermaid is unbeatable. For intricate multi-branch manuscript schematics, draw.io or Visio gives exact line routing. For a standard 6–10 stage ML training pipeline or unit-operation flowsheet, SciDraw AI (including its dedicated Process Flow Diagram mode) produces a clean draft ready for SVG typography polish.
3. Experimental Group Designs, Surveys & Mixed-Methods Studies
Clinical, psychology, education, and management papers frequently need parallel-arm pretest/posttest designs, multi-stage survey sampling funnels, or sequential QUAN → qual mixed-methods diagrams where time-point alignment and exact sample sizes (n) matter most. draw.io handles snap-to-grid tracks cleanly, while SciDraw AI offers dedicated Experimental Design, Questionnaire Survey, and Mixed-Methods modes to draft the dual-track layout before verifying counts in PowerPoint.
4. Advisor Revisions & Final Journal Submission
While a manuscript is still changing every lab meeting, prioritize editable source files: keep .drawio or .pptx files, or convert your SciDraw AI draft into .pptx / .svg early. Before journal submission, standardize all labels to a crisp sans-serif font (such as Arial or Helvetica) and check legibility when scaled down to single-column (~8.5 cm) or double-column (~17 cm) print width.
Walkthrough: Two Protocol Texts → SciDraw AI Draft → SVG / PPTX Refinement
Here are two real example inputs and outputs from the SciDraw AI workflow generator—one wet-lab biomedical protocol and one machine learning pipeline—showing what "text in → illustrated draft out" looks like in practice.
Example 1: Biomedical Wet-Lab Protocol (Sample Preparation)
Instead of pasting a 400-word Methods paragraph verbatim, state the flow direction, concise step names, critical conditions, and clean protocol style. Entering this prompt in the Workflow Diagram Generator:
A laboratory sample preparation workflow diagram showing tissue collection, homogenization, centrifugation, supernatant extraction, protein quantification, and aliquoting for storage, presented as a clear step-by-step flowchart with labeled boxes and arrows in a clean wet-lab protocol style.
produces the following flowchart draft:
 Draft generated in SciDraw AI from the wet-lab sample preparation prompt above, pairing each step with consistent labware illustrations.
Example 2: Non-Biological Pipeline (Machine Learning Training Loop)
In computational workflows, iterative validation-to-tuning loops should be stated explicitly so the return arrow connects the right stages:
A machine learning training pipeline workflow diagram: data collection, preprocessing and cleaning, feature engineering, train-test split, model training, hyperparameter tuning, validation, and deployment, with a feedback loop from evaluation back to tuning, clean labeled boxes and directional arrows.
produces this pipeline draft:
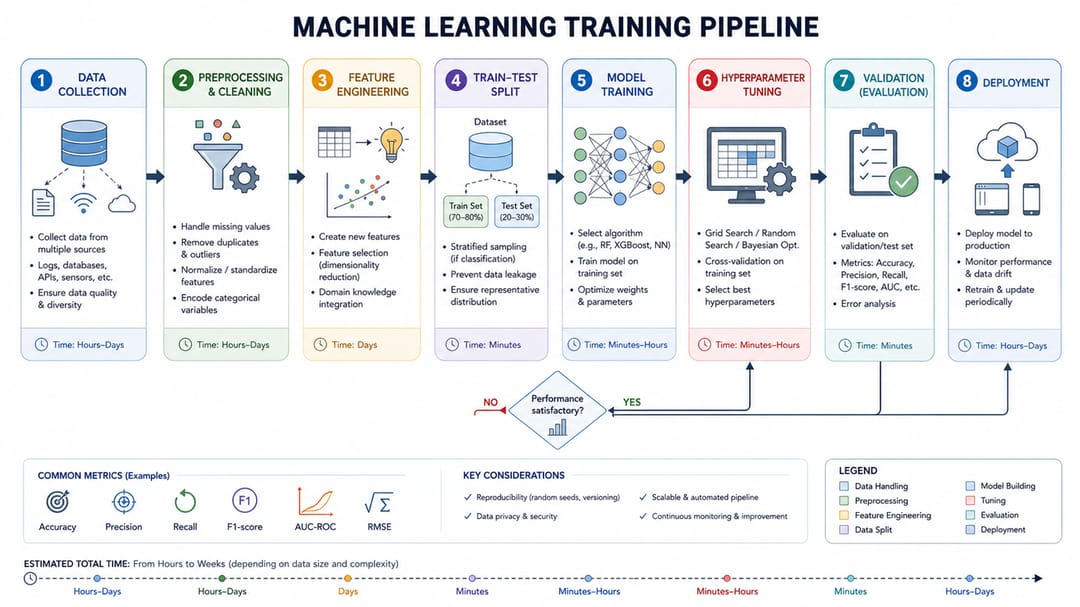 Draft generated in SciDraw AI from the machine learning prompt above, preserving both the left-to-right main pipeline and the evaluation-to-tuning feedback loop.
Step 3: Convert to SVG / PPTX and Verify Every Parameter by Hand
Treat any AI-generated figure as a first-draft layout, never an unverified submission:
- Pass your selected draft through the Image to SVG / PPTX Converter (a separate conversion step in SciDraw AI) to get an editable
.pptxor.svgfile. - Open it in PowerPoint or Adobe Illustrator and cross-check step order, reagent and buffer names, minus signs and units (e.g.,
−80 °C,× gvs. rpm), sample sizes (n), and feedback arrow directions against your lab notebook and Methods text. - Unify typography across all figures and export a vector PDF or 300+ DPI PNG for your manuscript.
5 Experimental Flowchart Mistakes Reviewers Flag Most Often
- Cramming Full Methods Sentences Into Boxes: Three-line paragraphs inside every node become unreadable at single-column journal width. Keep boxes to "concise action + 1–2 key parameters" (e.g.,
Centrifuge (12,000 × g, 10 min, 4 °C)). - Omitting Control Arms or Sample Sizes (
n): Showing only the treated group hides where vehicle controls, sham surgeries, or holdout test sets branch off. - Zigzag Reading Order & Unlabeled Decision Diamonds: Keep the primary backbone strictly left-to-right or top-to-bottom, and always label decision branches (
Yes / NoorActive / Inactive). - Terminology Mismatch With the Manuscript: Writing
qRT-PCRin the prose butRT-PCRin the figure—or showing four QC steps when the text describes five—undermines reviewer trust. - Clashing Clip Art or Wrong Labware: Mixing 3D stock photos with flat line icons, or placing a bacterial shake flask on an adherent cell-culture step. When unsure of apparatus geometry, a clean text box is safer than an inaccurate icon.
Frequently Asked Questions (FAQ)
What is the best 100% free software for drawing an experimental flowchart?
For clean boxes, decision diamonds, parallel group tracks, and snapped connectors, draw.io (diagrams.net) is the best completely free option—open-source on web and desktop with watermark-free SVG and PDF exports. For code-based pipelines in Markdown or Git, Mermaid is also free. If you want layout inspiration with step icons, you can test a few drafts using the free registration credits on SciDraw AI.
How can I make an experimental flowchart with lab tubes, centrifuges, or animal icons without drawing by hand?
For pure life-science wet labs where you prefer placing every tube and plate yourself, BioRender offers a large biomedical icon library (note that journal publication rights require a paid plan). If your protocol is already written out in prose and you want a complete icon-illustrated draft across biology or other STEM fields without manual asset hunting, paste your steps into SciDraw AI and convert the result to SVG or PPTX for editing.
What file format should I use to insert an experimental flowchart into Word or LaTeX?
For LaTeX (such as Overleaf), export a vector PDF so lines and labels stay sharp at any zoom. Modern Microsoft Word supports direct SVG insertion, though if co-authors open the file across different operating systems where fonts may shift, archiving your editable .drawio, .pptx, or .svg master while inserting a 300+ DPI white-background PNG into Word prevents layout surprises. Avoid pasting low-resolution screenshots.
Can AI-generated experimental flowcharts be submitted to peer-reviewed journals?
Two rules apply: scientifically, you must manually verify every step, reagent, unit, and arrow against your actual experiment—ideally after converting the draft to editable SVG or PPTX; editorially, major publishers (including Elsevier, Springer Nature, and Wiley) enforce varying policies on AI-assisted figures and disclosure statements. Always check your target journal's current Author Guidelines before submission to confirm permitted uses and required disclosures.