To draw a research roadmap or technical route diagram for a thesis proposal or grant application: use draw.io (free and open-source) or Microsoft Visio when you want full manual control over boxes and orthogonal connectors; use PowerPoint when your advisor or co-investigators need to edit text directly inside a slide; or use SciDraw AI (sci-draw.com) if you already have your Specific Aims or methodology written out and want a structured visual draft in seconds to convert into editable SVG or PPTX. Note that this guide covers academic research roadmaps—not agile software "product roadmaps."
First, Separate Academic Research Roadmaps from Product Roadmaps
Search for "roadmap software" and most top results—Jira, Productboard, Aha!, Notion—are built for software product managers scheduling quarterly feature releases. Drop one of those templates into a PhD prospectus or an NIH/NSF/ERC grant application and reviewers will immediately sense something is off.
Even inside academic writing, researchers routinely conflate three distinct figures. Before choosing a drawing tool, clarify which one your committee or study section actually expects:
- Research Roadmap / Technical Route Diagram (Methodology Logic): Shows how your central research question breaks down into Specific Aims or work packages, which experimental or analytical methods tackle each part, how intermediate outputs feed into downstream validation, and what final deliverables emerge. Its backbone is causal and methodological logic, often with no calendar axis at all.
- Project Timeline / Gantt Chart: Shows when tasks happen across Year 1–Year 5 or Quarters 1–8, along with milestone checkpoints and deliverables. Its backbone is time scheduling.
- Experimental Protocol Workflow: Zooms into a single bench or computational pipeline (for example, tissue dissociation → library prep → single-cell sequencing → clustering), operating one level deeper than the overall project roadmap.
If you are mapping out a graduate prospectus and unsure how a conceptual framework differs from a technical route diagram, start with How to Draw a Thesis Proposal Roadmap. For funding applications, see our Grant Proposal Scientific Illustration Guide.
6 Research Roadmap Tools Compared
In day-to-day academic practice, nearly all thesis and grant roadmaps are built with one of six tools. Here is how they stack up across learning curve, cost model, language support, export formats, and honest drawbacks:
| Tool | Best For | Learning Curve | Pricing | Interface Languages | Export Formats | Real Shortcomings |
|---|---|---|---|---|---|---|
| Microsoft Visio | Windows-based labs building multi-layered block diagrams, swimlanes, and engineering schematics | Moderate | Paid subscription or one-time license (usually separate from standard personal Office plans; some universities provide site licenses) | Multilingual (including English, Chinese, European languages) | VSDX, PDF, SVG, PNG, EMF | No native macOS desktop app (web-only on Mac); default shapes and colors look dated without manual restyling |
| draw.io (diagrams.net) | Zero-budget students and PIs across Windows, macOS, and Linux who want clean manual connector routing | Low–Moderate | Free and open-source (both web and desktop apps are free, no mandatory sign-up) | Multilingual (30+ languages) | .drawio, SVG, PDF, PNG, HTML | Starts from a blank canvas with few academic-specific templates; visual hierarchy and palette discipline are entirely up to you |
| ProcessOn | Browser-based real-time collaboration using ready-made flowchart and mind-map templates (a Chinese web-based diagramming tool widely used in East Asian universities) | Low | Freemium (free tier caps file count or export options) + paid subscription (web app) | Primarily Chinese interface (with partial English UI) | PNG, JPG, PDF, SVG, POS | Requires an active internet connection; many community templates lean toward corporate slide decks rather than understated grant aesthetics |
| PowerPoint / WPS | Compact roadmaps (roughly 10–15 boxes) where advisors or co-PIs insist on editing text directly in a .pptx file | Low | PowerPoint: paid subscription/license (often campus-provided); WPS: free base tier + paid premium | Multilingual | PPTX, PDF, PNG, JPG, SVG (varies by version and plan) | Connector lines break easily once branches multiply; moving one Aim box often forces twenty minutes of manual arrow realignment |
| Adobe Illustrator | Hybrid figures combining roadmap logic with custom anatomical, molecular, or apparatus illustrations, or journal-bound multi-panel art | High | Paid subscription (desktop vector suite) | Multilingual | AI, EPS, SVG, PDF, TIFF, PNG | No smart "glued" flowchart connectors—adding or deleting a module means redrawing arrows and resizing frames by hand |
| SciDraw AI | Researchers who already wrote their Aims and methods in prose and want an instant layout draft instead of staring at an empty canvas | Low | Free credits on registration; paid plans from $10/month (billed annually) or $20/month (monthly); cards & Alipay supported (web app) | Multilingual (English, Chinese, Japanese, Korean, European languages) | High-res PNG, plus conversion to editable SVG / PPTX | AI drafts cannot be pasted into a proposal unreviewed—text labels, numbering, and arrow directions must be checked against your manuscript; pixel-exact grid alignment and 40-node schematics are better done in Visio or draw.io |
In practice, these six options represent two distinct workflows:
- Manual Diagramming From Scratch (draw.io, Visio, PowerPoint): Best when you already know your exact three-column or top-to-bottom layout and simply want crisp boxes and snapped connectors. If you want a zero-cost workhorse on Mac or Windows, install draw.io; if your engineering group lives on Windows with institutional licensing, Visio remains hard to beat.
- Text-to-Draft + Vector Polish (SciDraw AI paired with PowerPoint or Illustrator): Best when you have 1,500 words of research design written out, the deadline is close, and you are stuck trying to compress three Aims, preliminary data, and six methods into one uncluttered page. Use the SciDraw AI Research Roadmap Maker to generate candidate layouts, then convert the best draft to SVG or PPTX for manual refinement. Conversely, if your figure requires strict ISO engineering symbols or dozens of tightly packed operational nodes, skip AI generation and build directly in Visio or draw.io.
Choosing by Scenario: Thesis Proposals, Grants, Industry R&D & Dissertations
Different academic milestones impose different constraints on revision speed, information density, and file sharing.
1. Master's & PhD Thesis Proposals (Prospectus / Qualifying Exam)
The defining pain point of a thesis proposal is relentless iteration: you revise after lab meeting, overhaul a whole Aim after your advisor's comments, and reformat the same diagram for both a portrait Word/LaTeX document and a 16:9 defense slide deck.
- For a clean 3–4 stage sequential study, draw.io or PowerPoint is fast and keeps
.pptxor.drawioedits trivial. - When your proposal spans a research question, theoretical grounding, three parallel empirical modules, and expected contributions—and every PowerPoint attempt looks cramped—run your summary through SciDraw AI's Proposal Overall Design mode, convert to PPTX, and let your advisor tweak wording directly in PowerPoint.
2. Competitive Grant Applications (NIH, NSF, ERC, UKRI)
Study section reviewers and grant panelists skim dozens of proposals under tight time pressure. When they turn to your Research Strategy or Methodology section, the technical route diagram has roughly thirty seconds to prove that your central hypothesis/question → Specific Aims or Work Packages → experimental/analytical methods → milestones & contingencies form a watertight loop.
- PIs who prefer total typographic control from box one usually draft in draw.io or Visio and finish colors in Illustrator.
- When your narrative just locked a few days before submission and you still need a cohesive overview figure, paste a structured summary of your Aims into SciDraw AI's Methodology Route mode, convert the resulting figure into SVG, and verify every Aim number, assay name, and dependency arrow in Illustrator or PowerPoint.
3. Industry-Sponsored R&D & Engineering Consortia
Corporate R&D sponsors and multi-partner engineering consortia care less about conceptual elegance and more about Technology Readiness Levels (TRLs), go/no-go decision gates, bench-rig test parameters, and explicit handoffs across partner teams.
Here, Visio or PowerPoint is usually the pragmatic choice: corporate partners can open .vsdx or .pptx files immediately, and swimlane grids stay aligned across revisions. Pure AI image generation struggles with strict industrial schematic conventions and exact monthly Gantt grids, so keep manual diagramming tools in charge here.
4. Final Master's Theses & Doctoral Dissertations
A dissertation lives permanently in university repositories and must survive both 200% PDF zoom during external examination and physical binding. Never recycle a low-resolution screenshot from your old proposal slides.
Whichever tool you start with—draw.io, ProcessOn, or SciDraw AI—keep an editable vector master (.svg, .pdf, .drawio, or .pptx), standardize fonts across every chapter's figures, and embed either vector graphics (PDF/EPS for LaTeX; SVG/EMF where supported in Word) or crisp 300+ DPI PNG exports.
Walkthrough: Proposal Prose → SciDraw AI Draft → SVG Export → PowerPoint Edits
What does a text-to-roadmap workflow actually look like, and what still requires human editing? Below are two real input prompts and outputs from the SciDraw AI roadmap generator.
Step 1: Turn Your Aims Into a Spatially Structured Prompt
Vague one-liners like "draw a cancer immunology grant roadmap" force any AI model to invent generic filler boxes. Instead, specify spatial zones—top problem or preliminary data, parallel Aims/work packages, methods nested under each Aim, dependency arrows, and final integration—and state whether you want a timeline axis excluded.
Here is a real prompt used in Research Roadmap Maker (Methodology Route mode):
A grant proposal technical route diagram for an NIH-style research project, showing three aims as parallel work packages with labeled sub-tasks, preliminary data feeding into each aim, milestone and deliverable markers, dependency arrows between aims, and a final integration and dissemination phase, clean professional roadmap style for funding reviewers.
Step 2: Generate the Structural Draft
Running that description produces the following technical route draft:
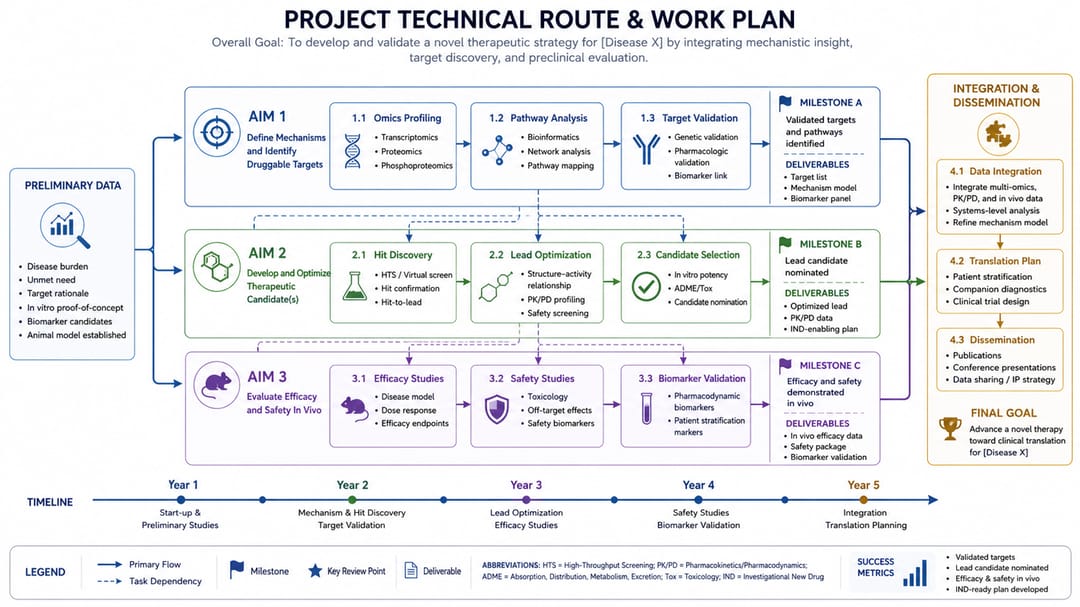 Output generated from the NIH-style grant prompt above in SciDraw AI, organizing preliminary data, three parallel Aims, inter-Aim dependencies, and deliverables into a single reviewer-ready layout.
For a graduate engineering prospectus where you need theoretical foundations, experimental rigs, simulations, expected outputs, and contributions on one page, switching to Proposal Overall Design mode with this structured description:
An overall research design diagram for an engineering thesis proposal on wear of a harmonic drive flexspline: research question at the top; theoretical basis row with contact mechanics, fatigue theory and finite element method; three research content blocks: flexspline stress analysis, wear experiment under different loads, structural parameter optimization; methods under each block: FEA simulation in ANSYS, bench test on a custom rig with 200-hour runs, response surface optimization; expected results at the bottom: stress distribution map, wear model, optimized tooth profile parameters; contributions box; arrows showing the logical flow from question to results.
produces this layout draft:
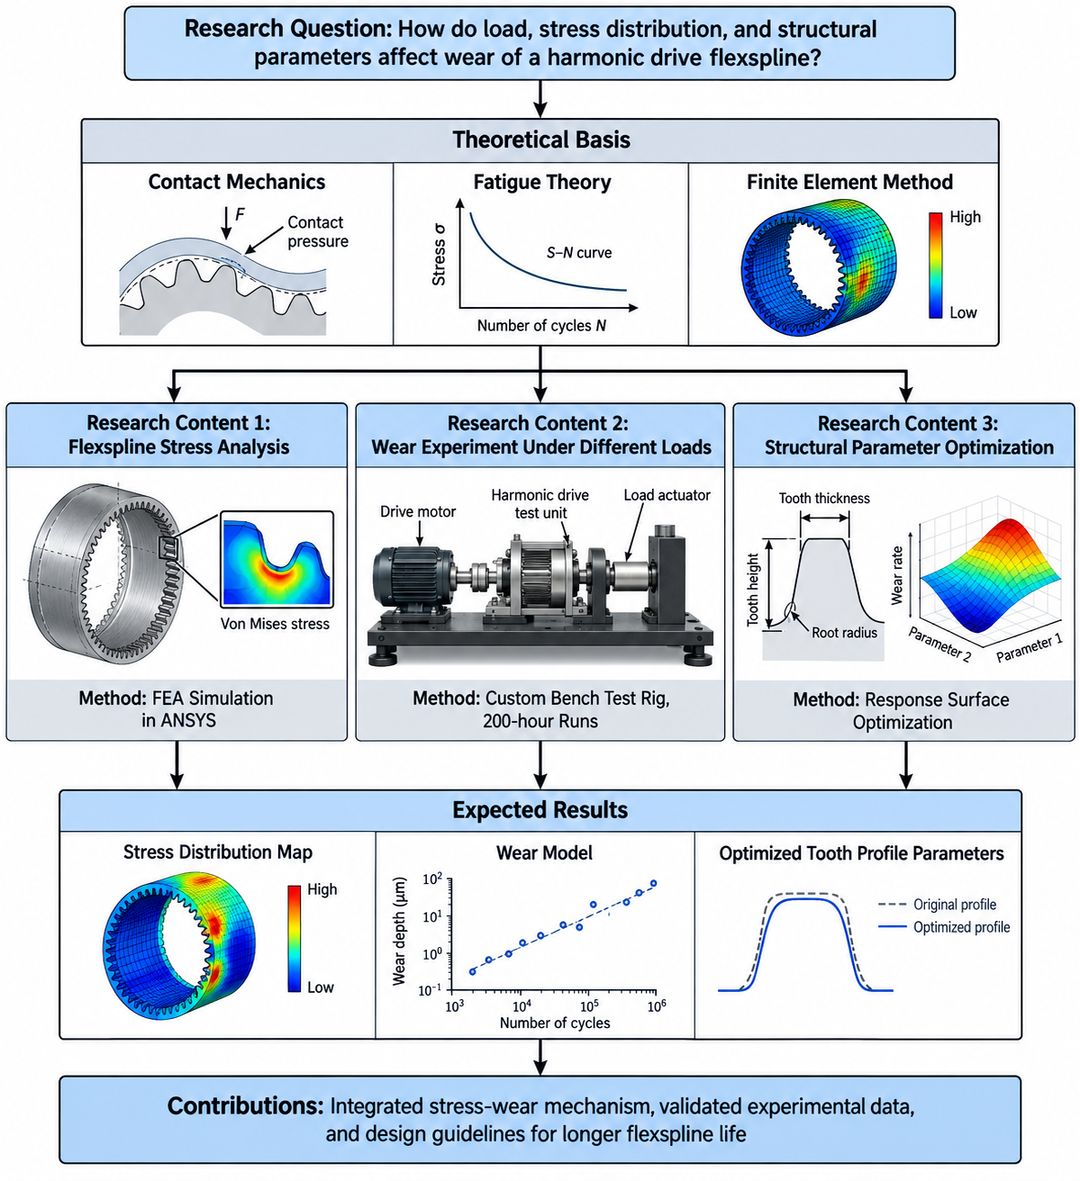 Output generated from the engineering thesis proposal prompt above, stacking research question, theoretical basis, three research modules, attached methods, and expected results top to bottom.
Step 3: Convert to SVG / PPTX and Audit Every Label in PowerPoint
Treat the generated image as a layout draft, never an unedited final submission:
- Run your chosen draft through the Image to SVG / PPTX Converter (a separate conversion step inside SciDraw AI) to obtain an editable
.pptxor.svgfile. - Open the file in PowerPoint (if using
.svg, right-click the graphic and select Convert to Shape, then ungroup) or Adobe Illustrator, and check every technical term, sample size, and Aim/task number word for word against your proposal narrative. - Verify arrow directions—distinguishing one-way dependencies from feedback loops—unify all labels to your proposal's body font (such as Arial or Helvetica), and export a clean PDF or 300+ DPI PNG for your manuscript.
5 Roadmap Mistakes Reviewers Flag First
Regardless of which software you choose, thesis committees and grant reviewers repeatedly criticize the same five flaws:
- Drawing a Table of Contents Instead of a Technical Route: Boxes reading "Chapter 1 Introduction → Chapter 2 Literature Review → Chapter 3 Experiments → Chapter 4 Conclusion" describe document structure, not how your scientific question is tested and solved.
- Mixing Research Objectives and Lab Assays on the Same Hierarchy Level: Placing "Mechanism of Resistance" (an objective) side by side with "RNA-seq & Western Blot" (techniques) muddies your logic. Keep Aims or research questions as parent containers and nest specific methods underneath.
- Connecting Everything with Double-Headed Arrows: Drawing bidirectional arrows between every pair of boxes makes your plan look indecisive rather than "integrated." Keep the primary flow strictly top-to-bottom or left-to-right, and use a single clearly labeled return arrow for genuine iterative feedback.
- Terminology Drift Between Prose and Figure: Calling a module "Work Package 2: Cross-Modal Alignment" in the text but "Feature Fusion" in the diagram—or showing four boxes when the text lists three Aims—signals a rushed copy-paste job.
- Slide-Deck Colors and Illegible Micro-Type: Dark backgrounds, neon gradients, and six-point text crammed with full sentences fall apart once a funding portal flattens your proposal into a compressed PDF or a reviewer prints it in grayscale. Stick to a white or very light neutral background, 2–3 muted colors max, and concise noun phrases.
Frequently Asked Questions (FAQ)
What is the best completely free software for drawing a research roadmap?
draw.io (diagrams.net) is the strongest 100% free choice. It is open-source, works both in the browser and offline on Windows, macOS, and Linux, imposes no file limits or watermarks, and exports crisp SVG, PDF, and high-resolution PNG files. If your bottleneck is figuring out how to arrange your Aims on a blank page, you can also use the free registration credits on SciDraw AI to test layout ideas first, then either convert the draft or rebuild that clean structure manually in draw.io.
Can I insert my research roadmap directly into Microsoft Word or LaTeX?
Yes, if you pick the right file format. For LaTeX (Overleaf), export your diagram as a vector PDF so lines and text stay razor-sharp at any zoom level. For Microsoft Word, modern Windows builds handle SVG well, but if collaborators open the document across different operating systems or older Office versions where fonts might shift, embedding a 300+ DPI white-background PNG (while archiving your editable .drawio, .pptx, or .svg master file separately) is the safest cross-platform approach. Never paste a low-resolution screen capture.
Which fonts work best in academic roadmap figures without causing garbled text?
Clean sans-serif typefaces—Arial, Helvetica, Calibri, or Roboto (and Noto Sans when mixing English with CJK scripts)—remain readable at small print sizes and match standard grant guidelines (including NIH/NSF readability recommendations). Keep the entire figure to two font sizes at most: one for module headers and one for method labels. When sharing .svg files across machines, convert text to outlines on final export or export high-DPI PNG/PDF so missing fonts never scramble your labels.
Do grant agencies enforce specific image formats or file-size limits for roadmaps?
Most funding portals (such as NIH eRA Commons / ASSIST, NSF Research.gov, ERC / EU Funding & Tenders Portal, and national research councils) require figures to be embedded inside PDF sections that obey strict page limits, margin rules, minimum font-size legibility, and total PDF file-size caps. Because exact portal specifications can change across funding calls, always check the current year's official solicitation and submission guide. As a safe rule, maintain an editable vector master, embed a clean 300 DPI PNG or vector PDF graphic, and inspect the final compiled portal PDF at 150%–200% zoom before submitting.