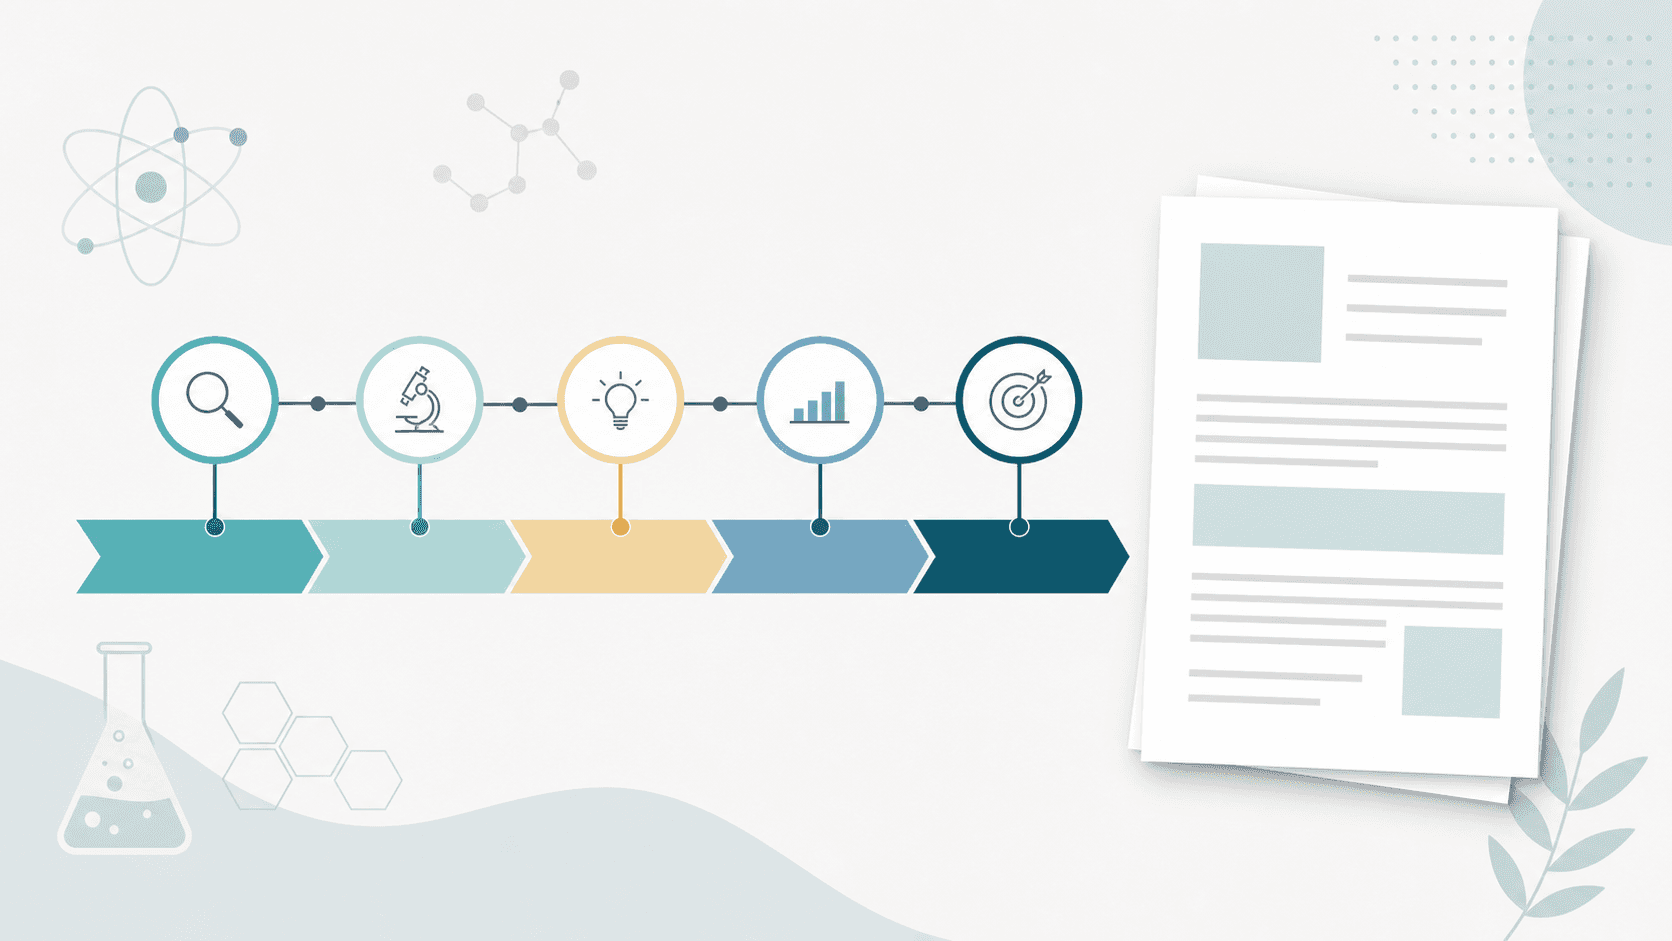
In a thesis proposal, the part your committee picks apart first is rarely the prose — it's the technical roadmap. Logic that jumps, arrows pointing everywhere, stages that blur together: even a solid plan looks half-baked. A clean roadmap does the opposite — it lets a reviewer grasp what you'll do, how, and in how many steps in about thirty seconds.
This guide is written for master's and PhD students at the proposal stage. It covers the three core figures a proposal needs — the technical roadmap, the research framework diagram, and the content map — with templates you can drop your own work into, plus a fast way to generate them.
What you'll learn:
- The difference between a technical roadmap, a framework diagram, and a content map
- What a roadmap needs to pass a proposal defense
- Three reusable structures (vertical flow, parallel modules, iterative loop)
- How to generate a first-draft roadmap from a plain-text description
Which figures does a proposal need?
Many students treat the technical roadmap as the only figure in a proposal. Reviewers actually want a small set of figures that support each other:
| Figure type | Question it answers | Where it goes |
|---|---|---|
| Research framework diagram | What parts is my research made of, and how do they relate? | Research content / plan |
| Technical roadmap | What steps and methods will I use to move forward? | Methods / technical route |
| Research content map | What exactly does each sub-question study? | Research content |
The relationship: the framework says "what it is," the roadmap says "how it's done," the content map says "how deep it goes." In the defense, open with the framework to set the whole picture, then use the roadmap to show execution — and the logic holds together.
What a roadmap needs to pass
The points reviewers keep raising boil down to five elements:
- Clear start and end — begin from the scientific question / objective and end at the expected outcome, not from an isolated experiment.
- Distinct stages — usually 3–5 stages (e.g., theory → model building → experimental validation → application analysis), one main block each.
- Methods attached — label the key method/technique for each stage so reviewers see you have a handle on execution.
- Single flow direction — a main line top-to-bottom or left-to-right; show feedback/iteration with a separate loop arrow, not tangled two-way arrows.
- Checkpoints that are assessable — each stage delivers an interim result (dataset, model, prototype, paper) that maps to your timeline.
Rule of thumb: if you strip the text and look only at boxes and arrows, a reviewer should still guess your research logic. Then the figure works.
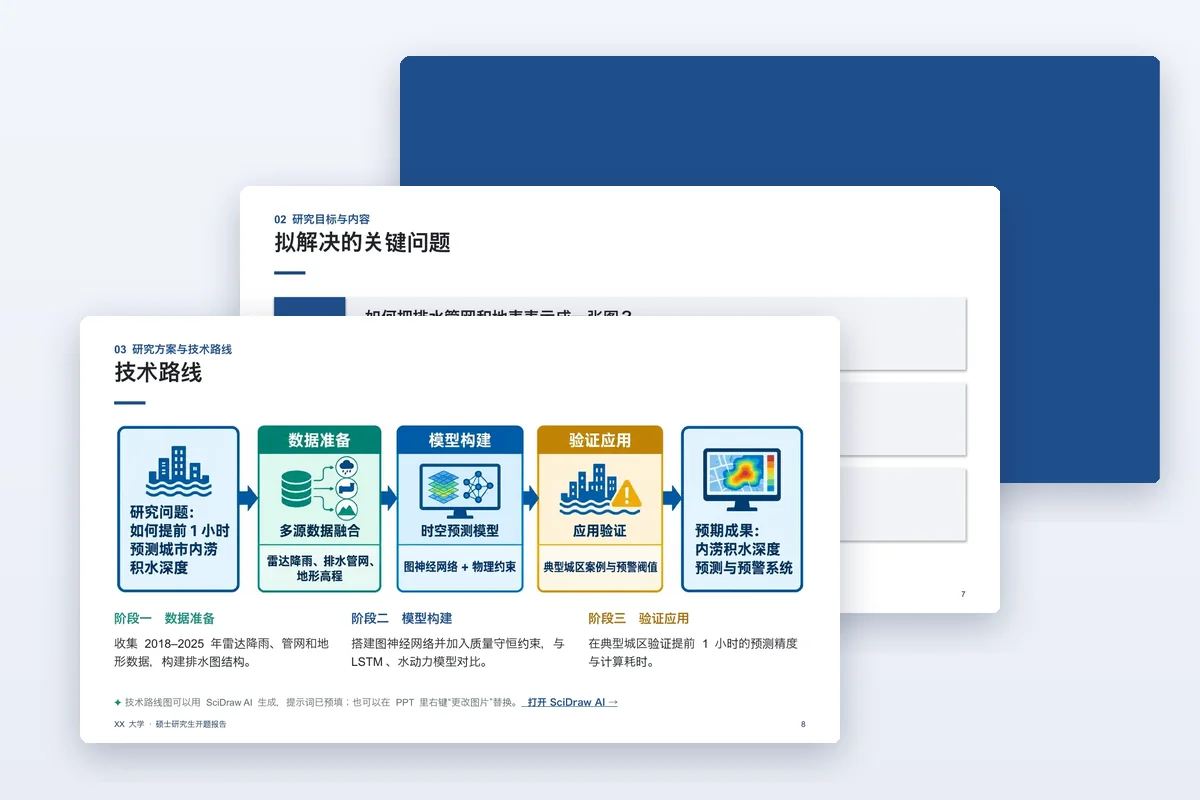
The technical roadmap generator turns the stage descriptions above into a clean first draft you can then fine-tune.
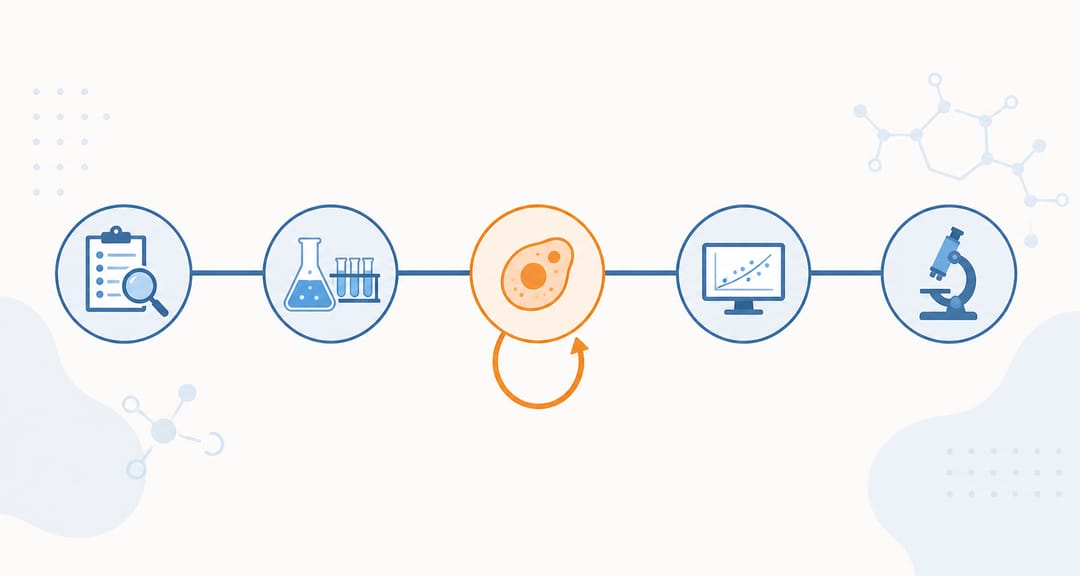
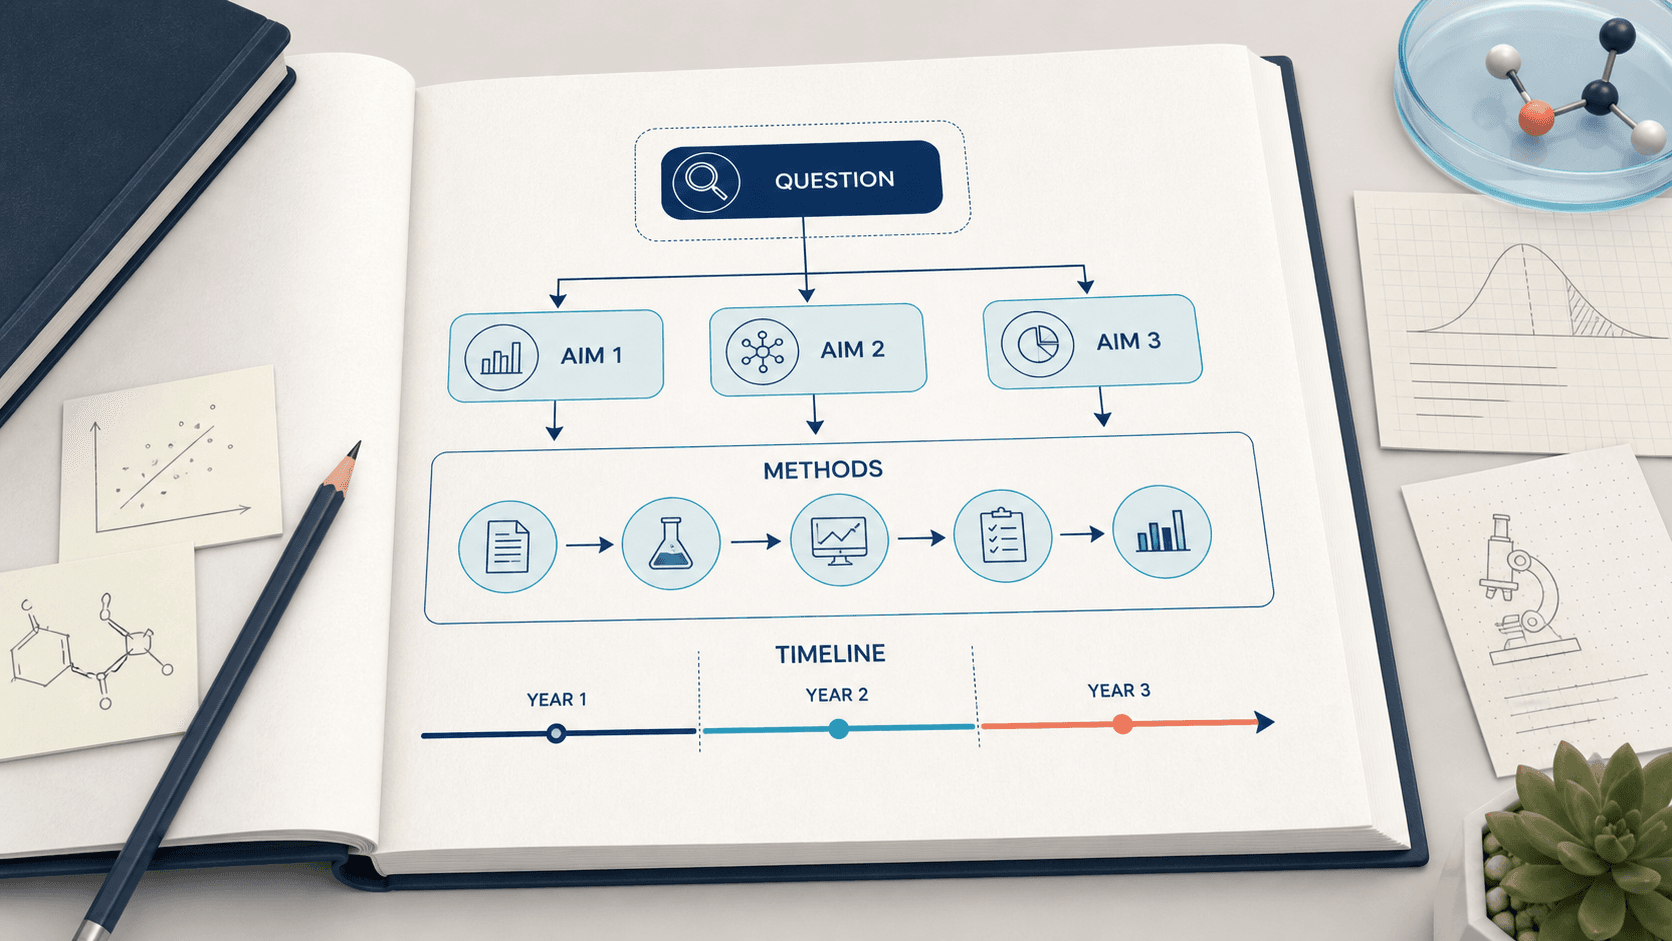
A clean roadmap lets a reviewer read your research logic from boxes and arrows alone — built with SciDraw AI.
Three structures you can reuse
Template 1: Vertical flow (most general)
Top to bottom: scientific question → stage 1 → stage 2 → stage 3 → expected outcome. Best for methodological or engineering topics with clear stage dependencies.
Template 2: Parallel modules
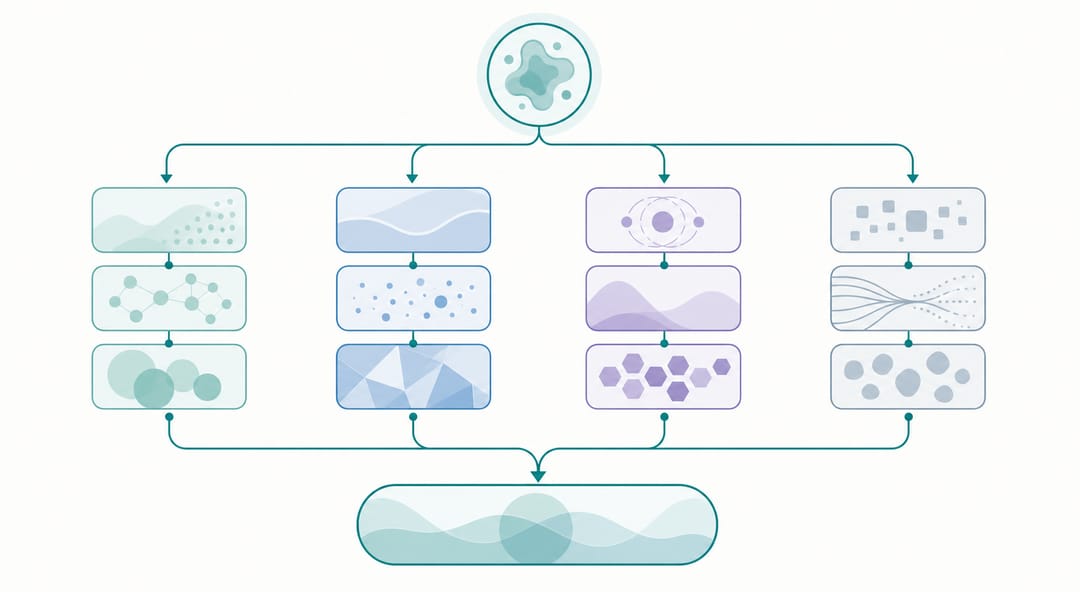
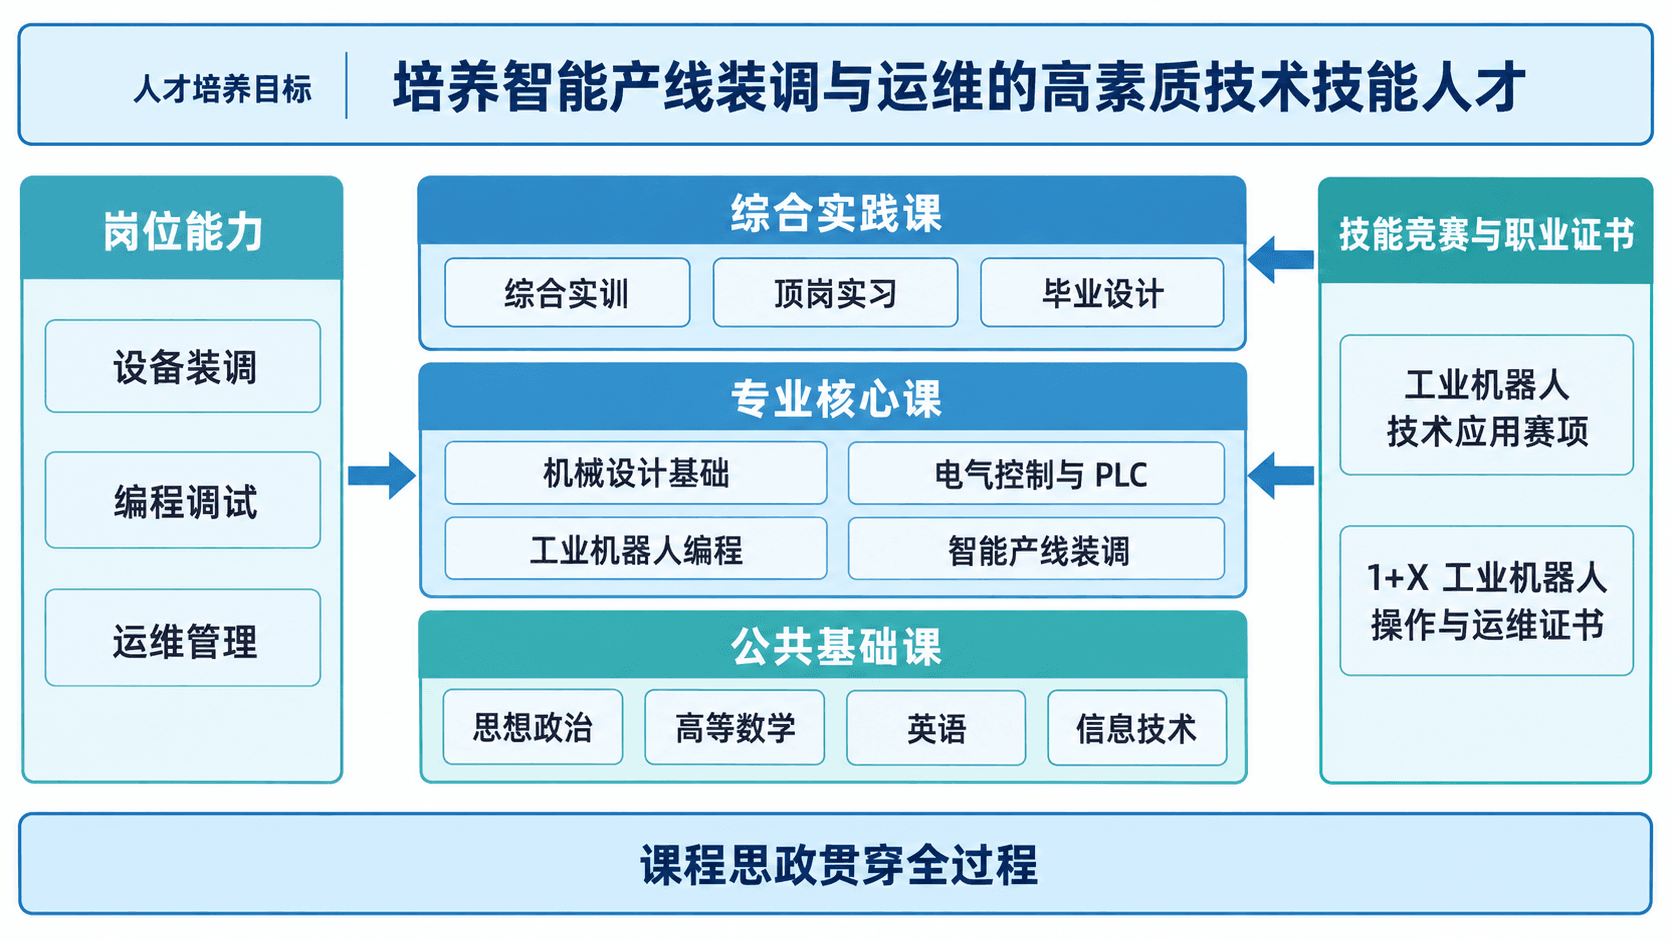
A central overall goal branching into 3–4 parallel research modules, each with its own small flow, converging into a synthesis. Best when one big question splits into relatively independent sub-projects. A research framework tool is the easiest way to build this skeleton.
Template 3: Iterative loop
"Design → experiment → analyze → optimize" as a closed loop, emphasizing repeated iteration. Best for algorithm refinement, material formulation, or model tuning. Express the iteration as a single loop arrow rather than back-and-forth on the main line.
Pick the structure that fits — vertical flow, parallel modules, or iterative loop. Drafted with SciDraw AI.
Color and layout: don't let details sink you
- No more than 2–3 colors: one to distinguish stages, one accent for key nodes, the rest grayscale. Avoid rainbow palettes.
- Consistent type size: one size for stage titles, one for method notes — two levels at most.
- Alignment and whitespace: equal-width boxes, horizontal/vertical arrows; whitespace reads as more professional than a packed canvas.
- Export needs: a crisp raster is fine for the proposal slides; if the roadmap will reappear in your thesis or a journal, export an editable vector so re-labeling later doesn't mean redrawing — the image-to-SVG / PPTX tool gives you a version you can keep editing in PowerPoint or Illustrator.
When unsure about color, the scientific color guide has a few publication-ready palettes.
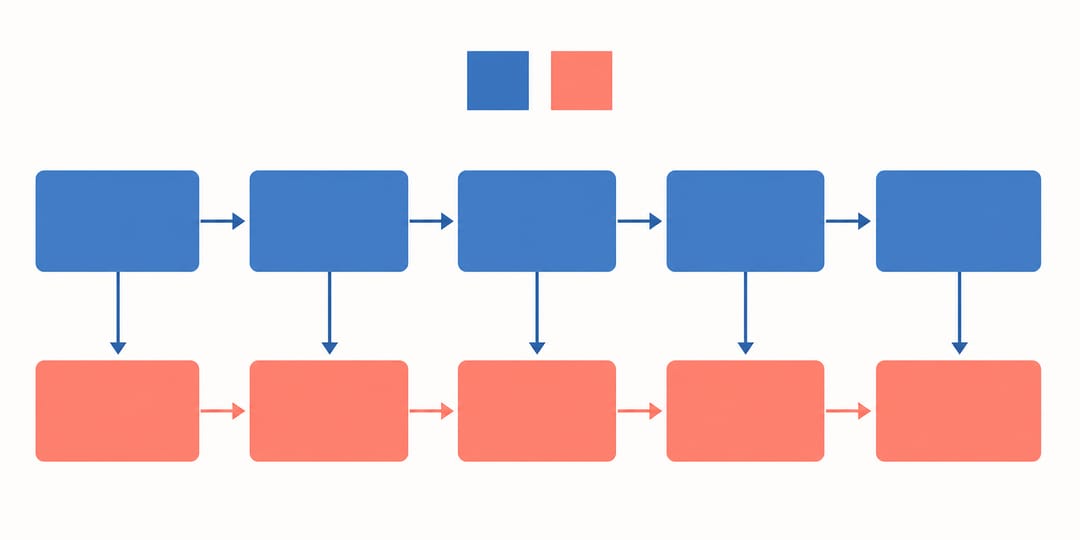
Aligned boxes, generous whitespace, and 2–3 colors read as professional. Styled with SciDraw AI.
Turn a text description into a draft
The traditional way is dragging boxes in PowerPoint or Visio, then re-laying-out for half an hour every time the plan changes. The faster path:
- Describe the route in a sentence or two — how many stages, what each does, what methods.
- Generate a draft with the technical roadmap generator.
- Fine-tune stage names, method labels, and node deliverables.
- Export — a raster for the proposal, an editable SVG / PPTX for reuse in your thesis.
This takes you from "logic clear" to "figure done" in minutes — and when your advisor asks for changes, you edit the description and regenerate instead of redrawing.
Common roadmap mistakes
- Starting from an experiment, not a question — reviewers can't find the scientific problem.
- Too many tiny stages — more than five reads as ungrouped; merge into main stages plus sub-steps.
- Method dumping — five or six method names per stage hides the priorities; keep only the key ones.
- Two-way arrows everywhere — keep the main line one-directional; draw feedback as a separate loop.
- Not matching your timeline — roadmap stages should map to your schedule, or reviewers will ask.
From proposal to graduation: figures are reusable
The framework and roadmap you build at the proposal stage can be reused at the mid-term review, in the thesis, and even in future grant applications — provided you saved an editable version from the start. For a full set of thesis figures at the writing stage, see the graduate thesis figures workflow.
Start now
You don't need to wrestle with boxes in PowerPoint first. Write your research stages as a sentence and generate a technical roadmap with SciDraw AI — free credits to start, editable export, reusable from proposal to graduation.
FAQ
Does a proposal roadmap have to be in color? No. Black/gray plus one accent color is often cleaner and prints reliably. Color is there to distinguish stages and highlight nodes, not to decorate.
What's the difference between a technical roadmap and a framework diagram? The framework shows "what parts the research is made of and how they relate" (static structure); the roadmap shows "what steps and methods drive it forward" (dynamic flow). A proposal should have both.
My advisor keeps asking for roadmap edits — how do I save effort? Generate from a text description and keep an editable SVG / PPTX. Edit the description and regenerate, or drag boxes directly in PowerPoint — no redrawing.
How many stages should a roadmap have? Usually 3–5 main stages. Too few looks unplanned; too many looks ungrouped. Use "main stage + sub-steps" for complex content.
Can I just use a template? Yes. Pick whichever of vertical flow, parallel modules, or iterative loop fits your topic, generate the skeleton with the roadmap tool, then fill in your content.