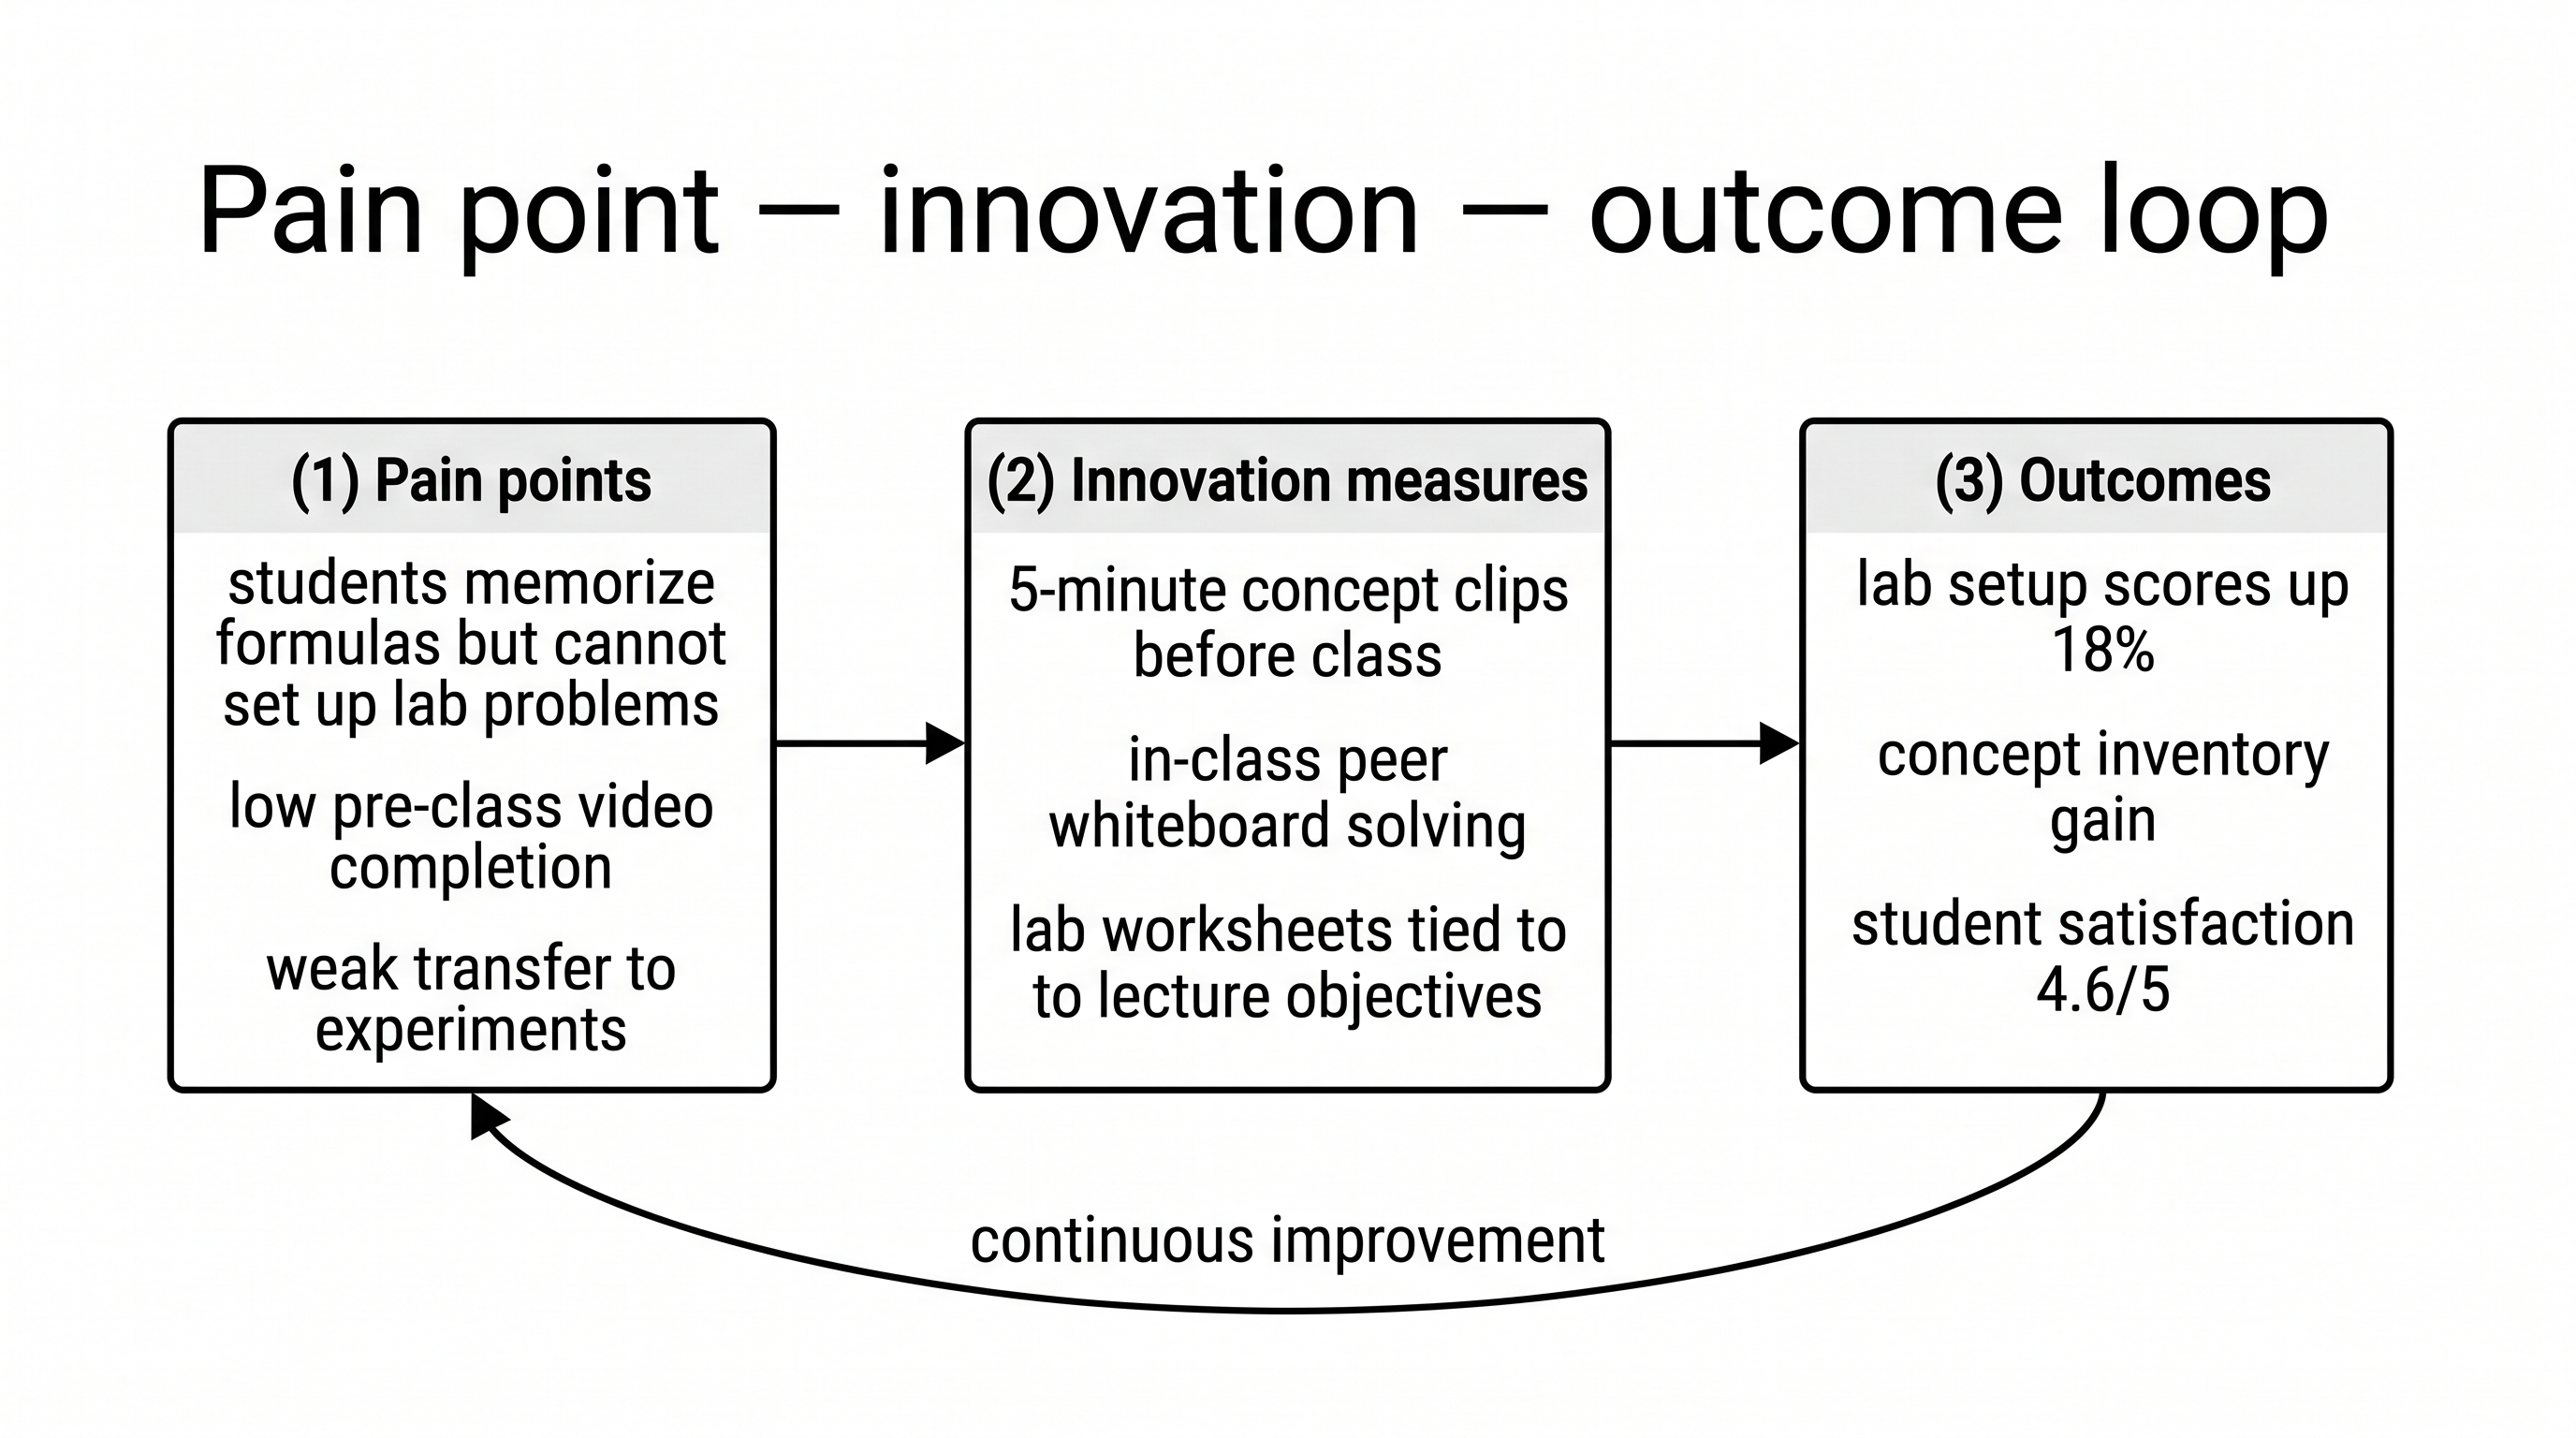
Teaching Framework Diagram Maker
Turn your course design into a clear teaching model diagram with AI
Write a few sentences about your course's challenges, what you changed, how a lesson unfolds and how you assess it, and AI lays it out as a clean framework diagram — ready for teaching award applications, teaching portfolios, course redesign reports and promotion presentations.
Teaching framework diagram examples
Click an example to load its description, then swap in your own course name and box text before generating.
What does a teaching framework diagram maker do?
A teaching framework diagram makes the logic of your course design visible at a glance: what problems the course had, what you changed, how a lesson moves step by step, how assessment closes the loop, and what improved. With this tool you describe that in plain text and AI produces a clean diagram — 16:9 by default at 2K resolution — that drops straight into a slide deck or report. It covers teaching model diagrams, blended learning and BOPPPS stage diagrams, before/during/after class flows, aligned assessment frameworks, values integration maps, teaching achievement frameworks and teaching–research synergy diagrams. It also suits teachers preparing for China's teaching competitions and teaching achievement awards. You can export the result as editable PPTX or SVG and keep refining text and colors in PowerPoint. For a grant's technical route, use the research roadmap maker; for a variable-based research model, the conceptual framework maker; for general processes, the flowchart maker.
Why teaching applications need clear diagrams
- Teaching award applications and course redesign reports are read quickly — a diagram of challenge → innovation → outcome lands faster than paragraphs.
- Page and figure limits are tight in many applications, so each diagram has to carry a clear point and stay readable at a glance.
- Most teachers are not designers; aligning boxes and arrows by hand in slides can take an entire evening, and every structural change means starting over.
- Application materials go through many drafts — renaming a stage or reordering steps is a quick edit to the description, not a redraw.
- The same course design gets reused in awards, teaching portfolios and promotion reviews, and a consistent diagram style carries across all of them.
How to describe a teaching diagram that works
Start with the one question the diagram should answer: your teaching model, how a single lesson runs, or how values are integrated into the course. Then write the structure and the text of each box: say whether it is columns, layers or a loop, and list the boxes in each column or layer, keeping each label short and to one idea. Spell out arrows — for example, "an arrow from outcomes back to challenges". After generating, check it against your actual course design. If a step is out of order or worded wrongly, edit the description and regenerate; if only a few words are off, export to PPTX and fix them in PowerPoint.
Common parts of a teaching framework diagram
- Teaching challenges — real problems found in your learner analysis, usually about three, as the starting point.
- Innovations or teaching strategies — the changes you made, ideally matched one-to-one with the challenges.
- Lesson stages — before, during and after class, or BOPPPS phases, with teacher and student activities marked.
- Assessment system — diagnostic, formative and summative assessment, and who assesses: teacher, peers, industry.
- Values or learning goals — linked to specific topics and skills, showing where and how they are taught.
- Outcomes and feedback — evidence from your own real data, with an arrow back to show continuous improvement.
Teaching framework diagram FAQ
Can I edit the text and use the diagram in PowerPoint?
Yes. Images are 16:9 at 2K by default, so you can insert them straight into slides. To change wording or colors, export to editable PPTX or SVG (export uses additional credits) and edit text and shapes in PowerPoint or another editor.
Are there limits on how many figures I can include?
That depends on your application. Some do set limits — several provincial teaching competitions in China, for example, cap the implementation report at 12 figures and tables. Check your own guidelines, then decide which points most need a diagram and let each diagram make one point well.
Can it draw how values or ethics are integrated into a course?
Yes. Describe your modules or key topics and the values linked to each, plus how they are taught, and you get a layered diagram or a topic-to-values map. You decide what the values are from your course content; the tool draws them clearly.
How should I handle data and outcomes in the diagram?
SciDraw is a drawing tool — it does not write your application and cannot promise any award. Use your own real data for any outcome, percentage or score; the examples are only a format reference. If your submission must be anonymous, leave names, institutions and other identifying details out of the diagram.
I can't draw and have no design background. Can I still use it?
Yes. You only describe the structure and the text in each box; AI handles layout, colors and arrows. Load an example, swap in your own course name and box text, and generate.
How much does it cost? Can I try it free?
You can try it free after signing up: new accounts get 10 credits (valid for 1 day), plus 5 credits for each daily login (valid that day). A standard 2K image costs 5 credits, and PPTX or SVG export uses additional credits. The free plan has no monthly credits, so if you draw often you can buy a credit pack or subscribe.
Writing a paper, thesis or grant?
SciDraw AI also makes publication-ready research figures: graphical abstracts, mechanism figures, workflows and conceptual frameworks.
Explore More Tools
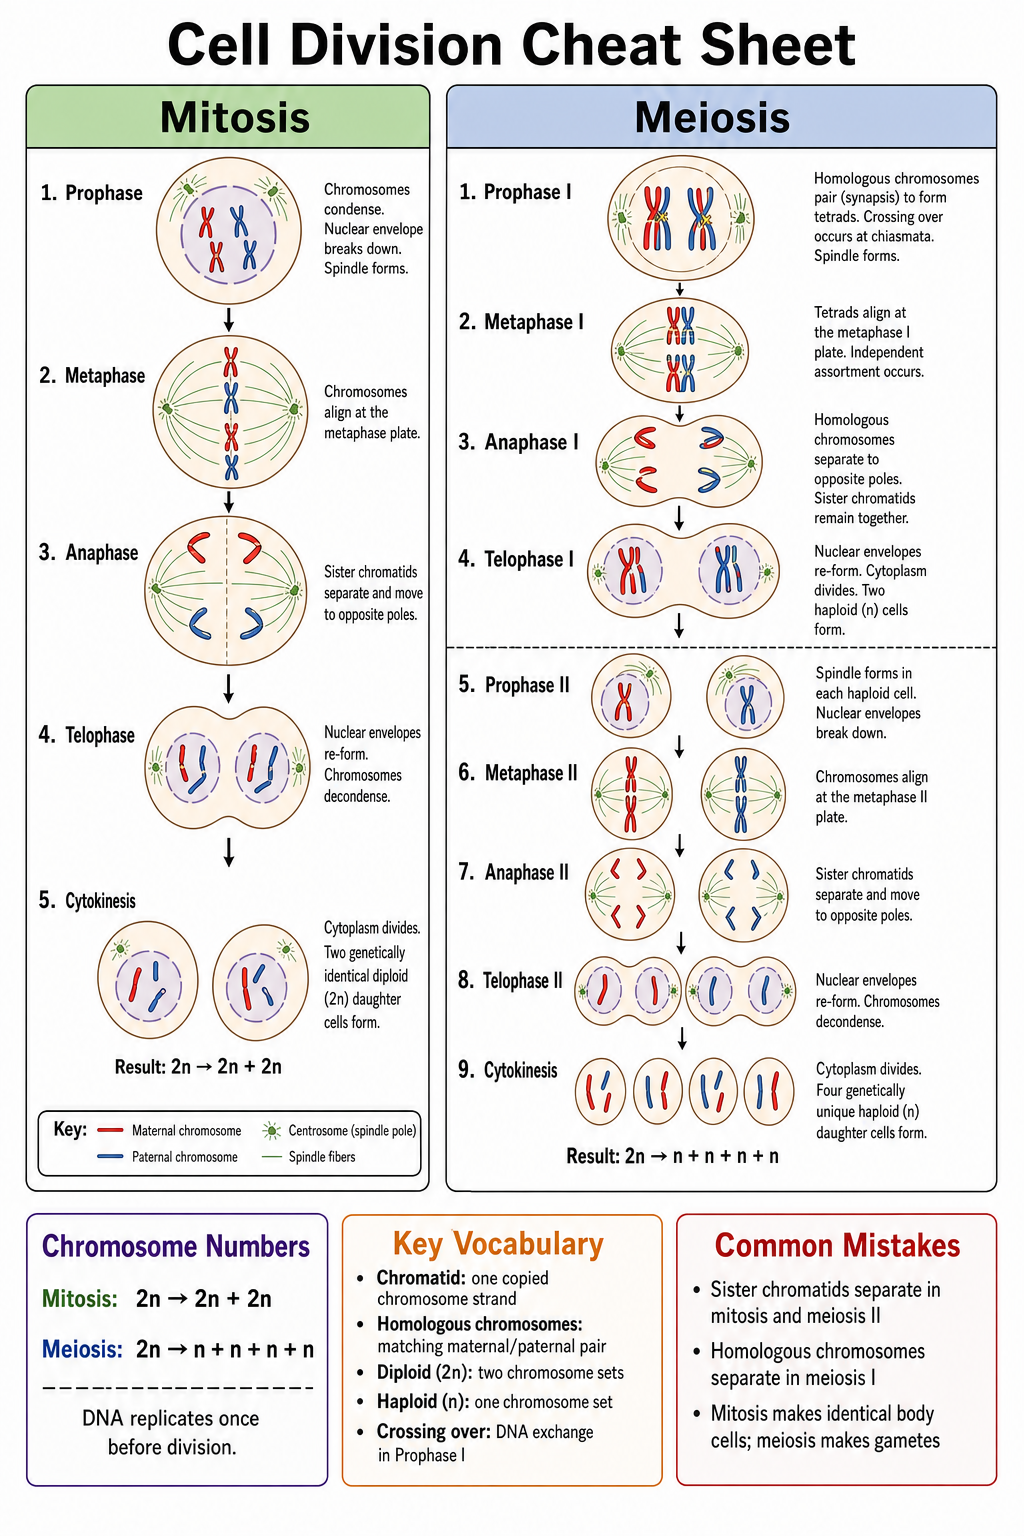
AI Cheat Sheet Maker
Turn a topic or your notes into a one-page visual study sheet for revision and exams.
Try it free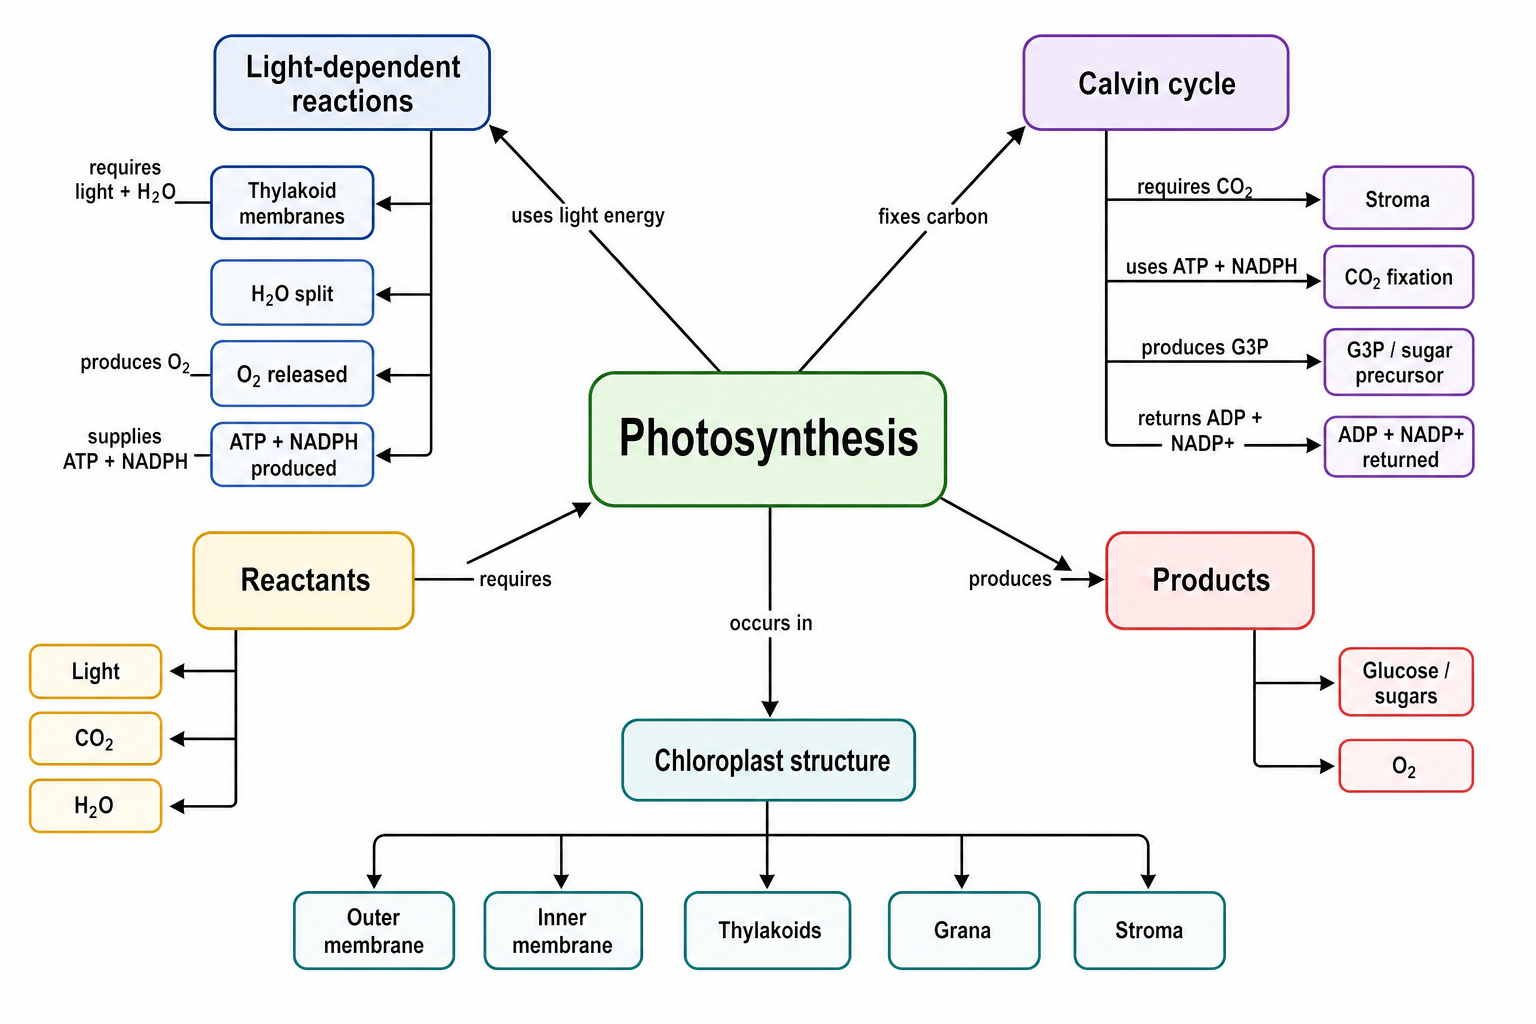
Concept Map Generator
Turn a science topic into a labeled concept map showing concepts and their relationships.
Try it free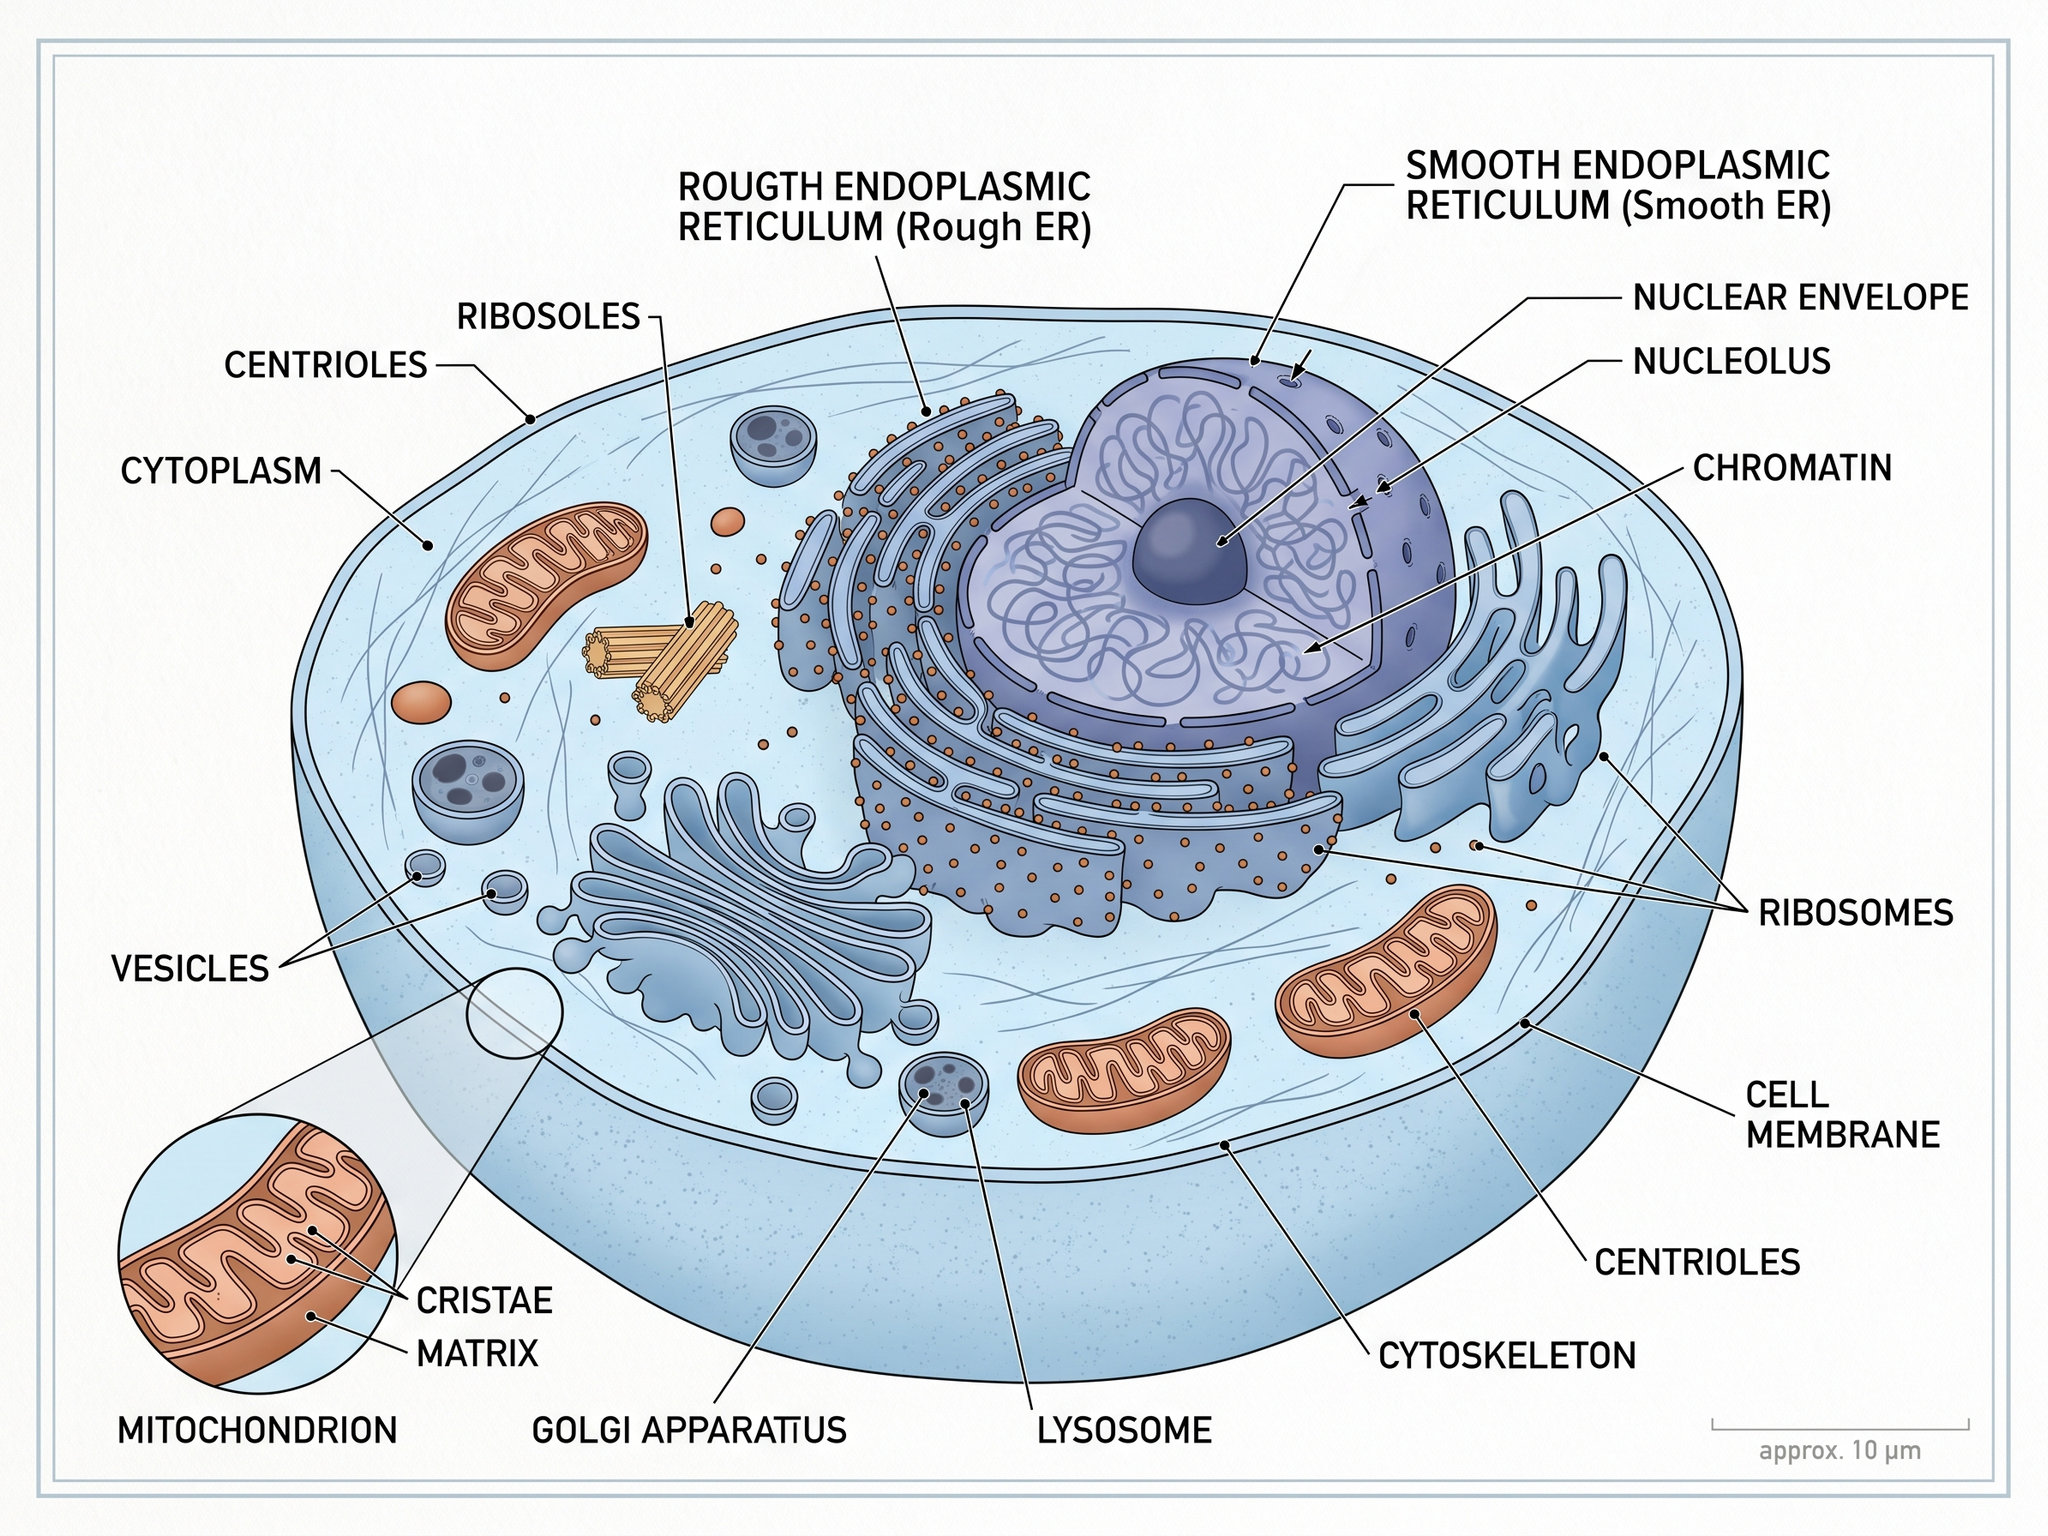
Textbook Illustration Maker
Illustrations tailored for textbooks and learning materials
Try it freeTurn your course design into one clear diagram
Write down your challenges, changes and outcomes, and get a framework diagram ready for your application or presentation in minutes.