Data Flow Diagram Generator
Context and level-1 DFDs from a plain description
Describe who sends what to your system, what the system does with it and where the data is stored. SciDraw AI draws external entities, numbered processes, data stores and labeled data flows, in Yourdon/DeMarco or Gane-Sarson notation.
Data Flow Diagram Examples
Click an example to load its description.
What does this data flow diagram generator do?
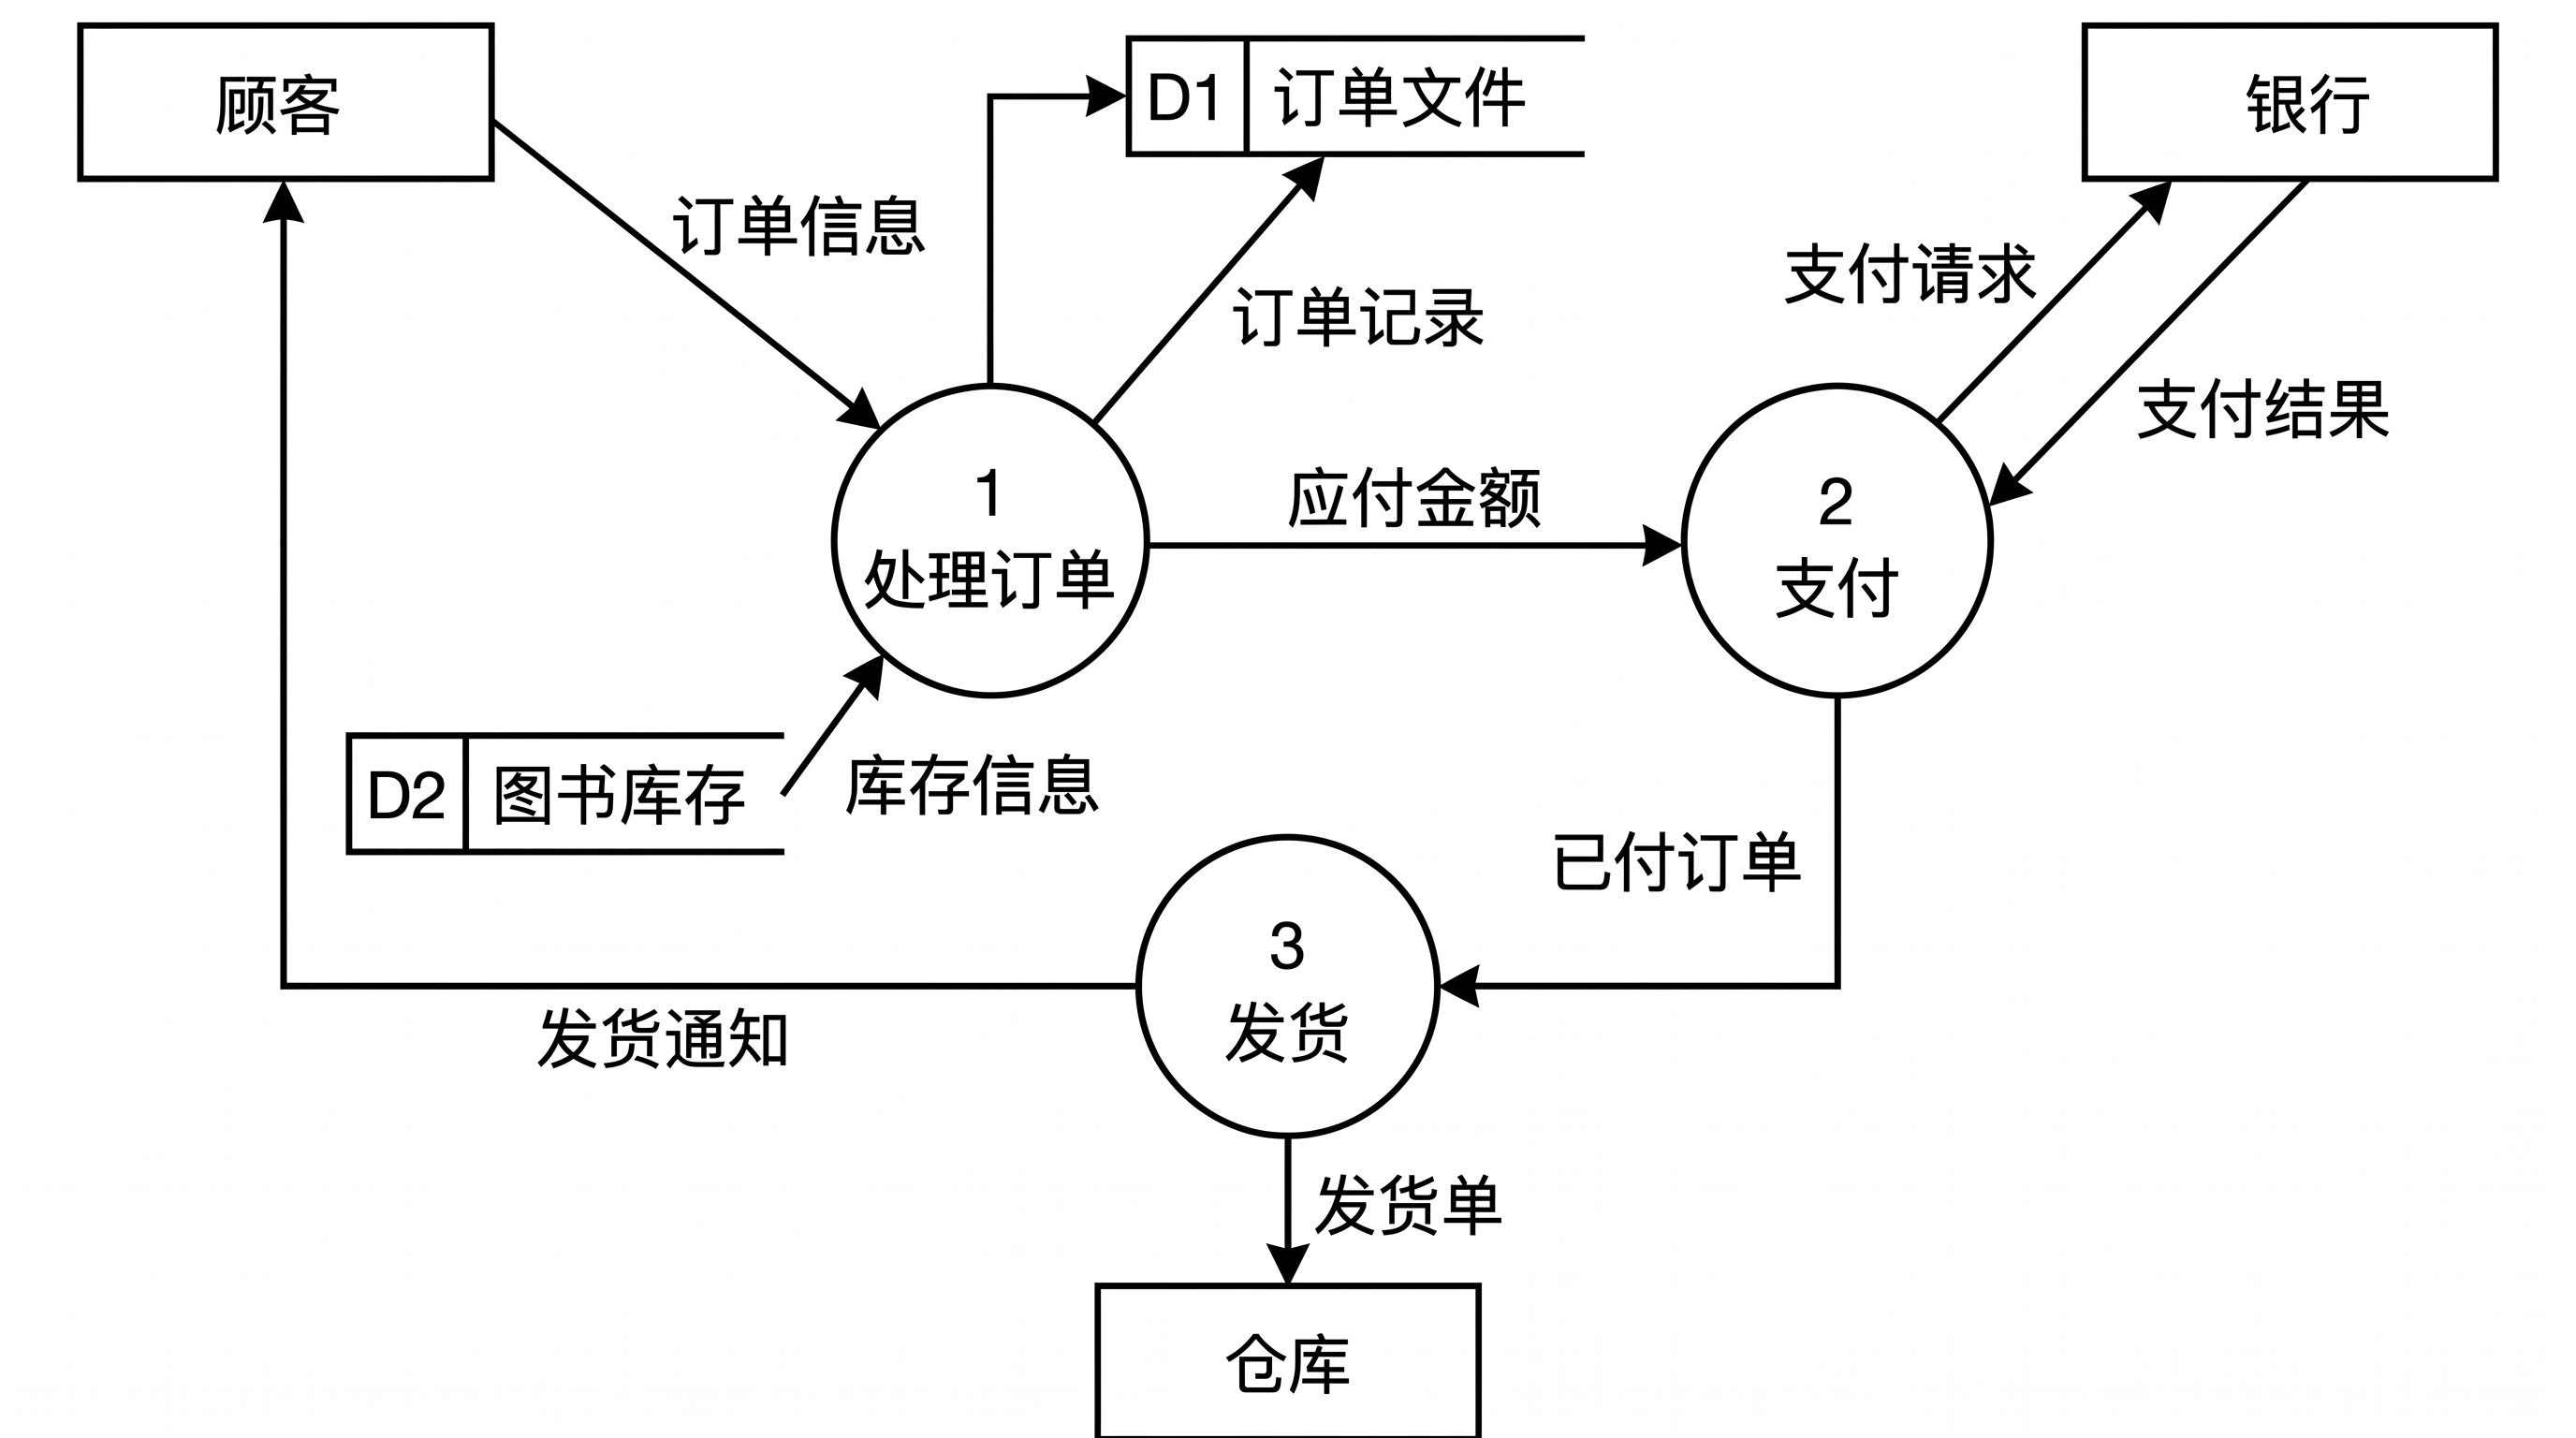
It draws a data flow diagram from a description of where data comes from, how it is processed and where it is stored. External entities become rectangles, processes become numbered circles (Yourdon/DeMarco) or rounded boxes (Gane-Sarson), data stores become open-ended rectangles with an ID, and every data flow becomes a labeled arrow from its source to its destination. It suits systems analysis coursework, the analysis chapter of a thesis and software requirements documents.
Why data flow diagrams are useful
- A context diagram fixes the system boundary and every input and output in one picture.
- Level-1 and level-2 DFDs break a system into processes you can design and test separately.
- Structured analysis courses and many requirements documents expect a top-level and a level-1 DFD.
How to draw a data flow diagram
Start with the context (top-level) diagram: the whole system as one process, surrounded by the external entities that send or receive data. Name every flow by the data it carries ("order details", not "send"). Then draw level 1: split the system into three to seven numbered processes and add the data stores they read and write. Write each flow as "source → destination: data" in your description, so every arrow points the right way. Remember the DFD rules: data moves between entities and stores only through a process, and every process has at least one input and one output.
Elements of a data flow diagram
- External entity: a rectangle for a person, organization or system outside yours.
- Process: a numbered circle (Yourdon) or rounded rectangle (Gane-Sarson) that transforms data.
- Data store: an open-ended rectangle with an ID such as D1, where data is kept.
- Data flow: an arrow labeled with the data it carries, from source to destination.
- Levels: the context diagram (level 0) and its decomposition into level-1 and level-2 diagrams.
Frequently Asked Questions
What is the difference between a context diagram and a level-1 DFD?
A context diagram (also called a top-level or level-0 diagram) shows the whole system as a single process with its external entities and data flows. A level-1 DFD opens that process into several numbered sub-processes and adds the data stores. Say which level you want in your description.
How should I describe the data flows?
Write one flow per sentence in the form "source → destination: data", for example "Customer → 1 Process Order: order details". For a two-way exchange, write two flows. Name data stores with an ID such as D1 so they are drawn only once.
Which notation does it use?
Yourdon/DeMarco by default: processes as circles, data stores as open rectangles. Ask for Gane-Sarson in your description to get rounded process boxes with the number in a top band.
Is the generated diagram always correct?
Not always. Check that every flow points the right way, that no store or entity appears twice and that no flow is missing. Diagrams with about ten flows or fewer come out most reliably; split larger systems into levels.
Can I edit the diagram afterwards?
Yes. Download it as a high-resolution PNG, or open it in the editor to keep refining it. From the editor you can convert it to an SVG vector file (10–15 credits), a PowerPoint PPTX file (10 credits) or a Visio file (20 credits).
How many credits does it cost?
Each diagram uses 5 credits at 2K. A free account gets 10 credits at sign-up and 5 more every day; paid plans and credit packs add more. See the pricing page for current plans.
Draw your data flow diagram now
Describe your entities, processes and data stores and get a clean DFD.