LogoLogoSciDraw AI
  • Start Creating
  • Tools
  • Blog
  • Pricing
  • Education Discount
LogoLogoSciDraw AI

AI-powered scientific figure platform for researchers, students, educators, and science communicators. Create publication- and classroom-ready figures, graphical abstracts, TOC graphics, posters, and teaching illustrations in minutes. No design skills required.

EmailYouTubeXGitHubLinkedInInstagramStripe ClimateStripe Climate Contribution
Tools
  • AI Drawing
  • Graphical Abstract Maker
  • Scientific Figure Maker
  • Image Converter
  • Vectorize Image
  • All Tools
Popular tools
  • Scientific Diagram Maker
  • Scientific Poster Maker
  • Research Poster Template
  • Plant Cell Diagram
  • Lewis Dot Structure Generator
  • Molecular Orbital Diagram Generator
  • PRISMA Flow Diagram Generator
  • Conceptual Framework Maker
Use Cases
  • For PhD Students
  • For Educators
  • For Journal Submission
  • BioRender Alternative
Resources
  • Blog
  • Gallery
  • Published references
  • Media Kit
  • Developers
Company
  • About
  • Pricing
  • Affiliate
  • Institutional invoicing
  • Privacy Policy
  • Terms of Service
© 2026 SciDraw AI All Rights Reserved.
24 Signaling Pathway Diagram Prompts for Publication-Ready Figures (2026)
2026/06/17

24 Signaling Pathway Diagram Prompts for Publication-Ready Figures (2026)

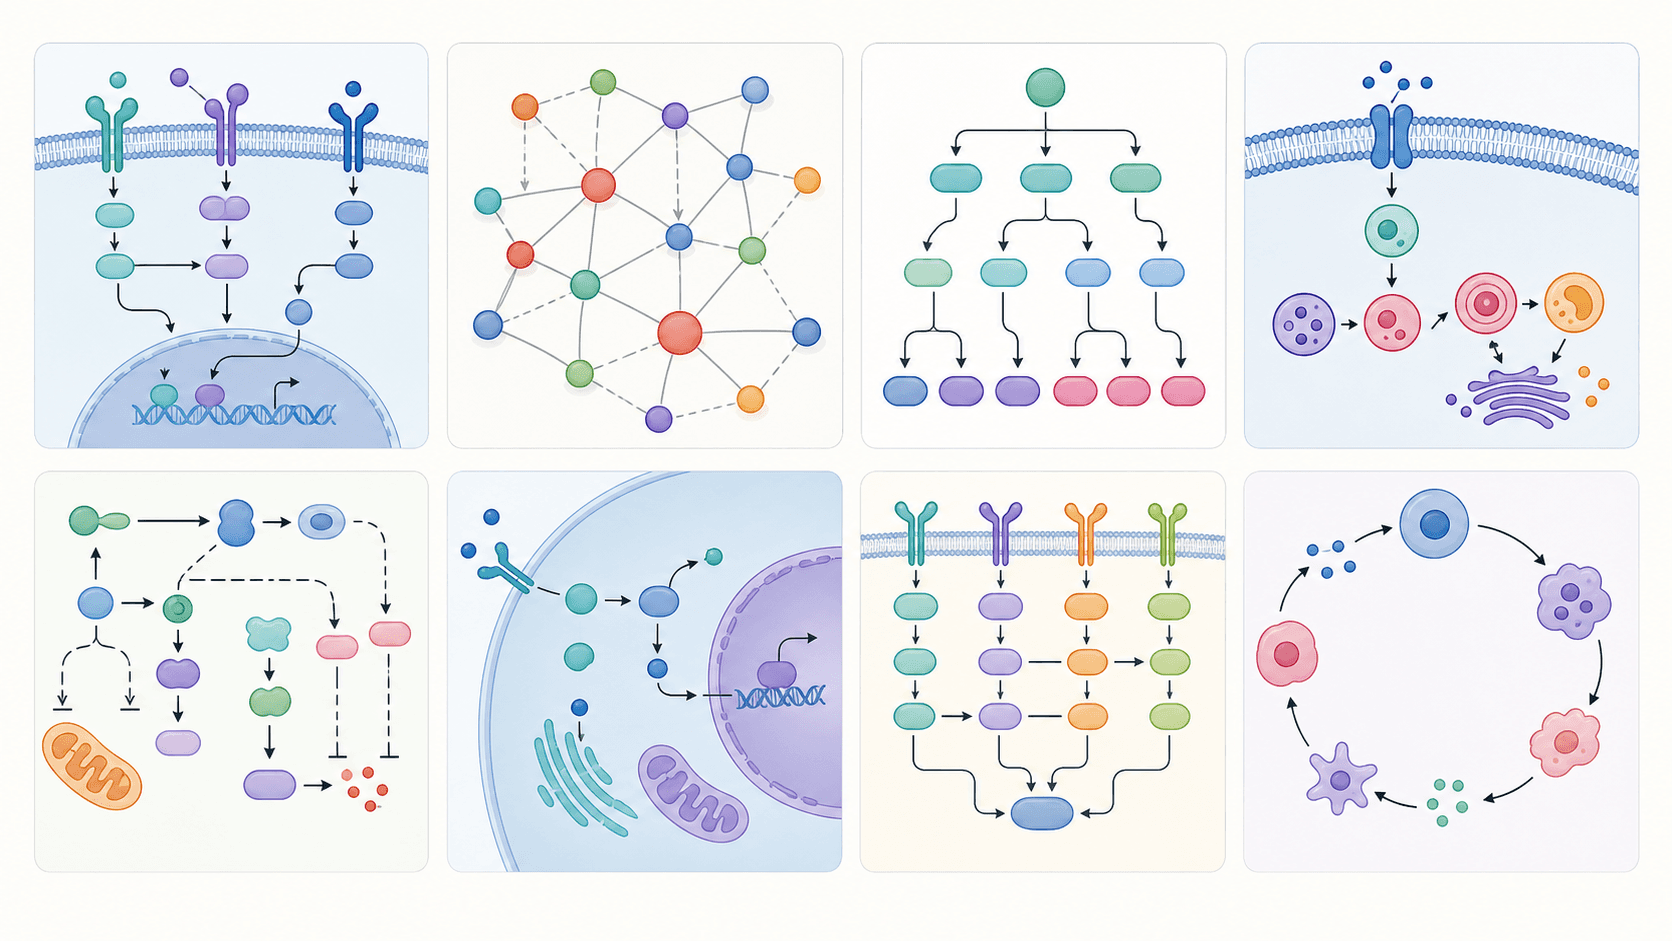
Copy-paste AI prompts for cell signaling pathway diagrams — MAPK/ERK, PI3K-AKT-mTOR, Wnt, NF-κB, JAK-STAT, TGF-β, GPCR/cAMP, insulin, and p53 — plus a reusable prompt template, real examples, and tips for correct activation arrows, inhibition bars, and publication-ready results.

A signal transduction diagram lives or dies on clarity: a reader has to follow which node activates which, where the signal crosses the membrane, and what ends up regulating genes in the nucleus. One mislabeled kinase or a reversed arrow can flip the meaning of an entire cascade. This guide gives you 24 ready-to-use signaling pathway diagram prompts, a reusable prompt template, and real generated examples, so you can build clean, labeled, publication-ready pathway figures with AI in minutes — no design software and no drawing skills required.

By the end of this guide you'll be able to:

  • Generate a MAPK/ERK pathway diagram, PI3K-AKT-mTOR diagram, Wnt pathway diagram, NF-κB diagram, JAK-STAT diagram, and TGF-β pathway figure from a single sentence.
  • Adapt any prompt to your own model using a simple four-part template.
  • Get activation arrows, inhibition bars, feedback loops, and crosstalk to read correctly.
  • Avoid the common mistakes that make AI cell signaling diagrams look wrong.

Paste any prompt into the Signaling Pathway Diagram Generator, then refine the result by asking to add a node, mark an inhibitor, recolor, or relabel — or open it in the SciDraw AI editor to keep iterating.

The anatomy of a great signaling pathway prompt

Most weak results come from vague prompts. Strong signaling pathway diagram generator prompts have four parts:

  1. Subject — which cascade or process (e.g. "the MAPK/ERK pathway from receptor to nucleus").
  2. Interactions & direction — who acts on whom (activation, phosphorylation, inhibition), in order from receptor to endpoint.
  3. Labels — name every receptor, kinase, mediator, and transcription factor you want labeled.
  4. Style & layout — "flat vector, publication-ready, top-to-bottom flow, activation arrows and inhibition bars, membrane and nucleus shown."
All Posts

Author

avatar for Davie Chen / SciDraw AI
Davie Chen / SciDraw AI

Researcher

Davie Chen is a researcher at the Faculty of Animation and Intermedia, University of Arts in Poznan, studying generative AI for scientific figure creation, patent illustration, and manuscript drafting. SciDraw AI is one of the research-to-product tools built from this work.

Author profile

Categories

The anatomy of a great signaling pathway promptTips for clean, accurate pathway figuresMAPK / ERK and growth signalingPI3K-AKT-mTOR and survival signalingWnt, Hedgehog, and developmental pathwaysInflammation and immune signalingStress, apoptosis, and TGF-βMetabolic, receptor, and crosstalk signalingCommon mistakes (and how to fix them)Export and use your pathway figuresFrequently asked questionsStart creating

More Posts

Create your scientific figures with AI

Thousands of researchers use SciDraw AI to make publication-ready figures for papers, grants, and journal submissions — in minutes, with no design skills.

Start for free

Template: "Draw [pathway] from [receptor] through [intermediate nodes] to [endpoint]. Label [receptors/kinases/mediators/transcription factors]. Show the membrane, cytoplasm, and nucleus. Use a clean flat-vector style with activation arrows and inhibition bars."

Keep this template handy — every prompt below follows it, and you can swap in your own cascade. It works whether you need a quick lecture slide or a publication-ready pathway figure for a manuscript.

Tips for clean, accurate pathway figures

  • List nodes in order. Name the receptor, each kinase or mediator, and the endpoint so the kinase cascade figure lays out top-to-bottom correctly.
  • Be explicit about direction. Use "activation arrow" for stimulation and "flat-end inhibition bar" for suppression — pathway logic must read unambiguously.
  • Give spatial cues. Mention the membrane, cytoplasm, and nucleus so each component lands in the right compartment of the cell signaling diagram.
  • Label kinases precisely. Spell out exact names ("MEK1/2", "GSK-3β", "AKT") so the AI does not abbreviate or misspell them.
  • Mark feedback and crosstalk explicitly. Negative feedback loops and cross-pathway links are omitted unless you ask for them.
  • Iterate, don't restart. Refine with "add a negative feedback loop from ERK to RAF" instead of rewriting the whole prompt.

MAPK / ERK and growth signaling

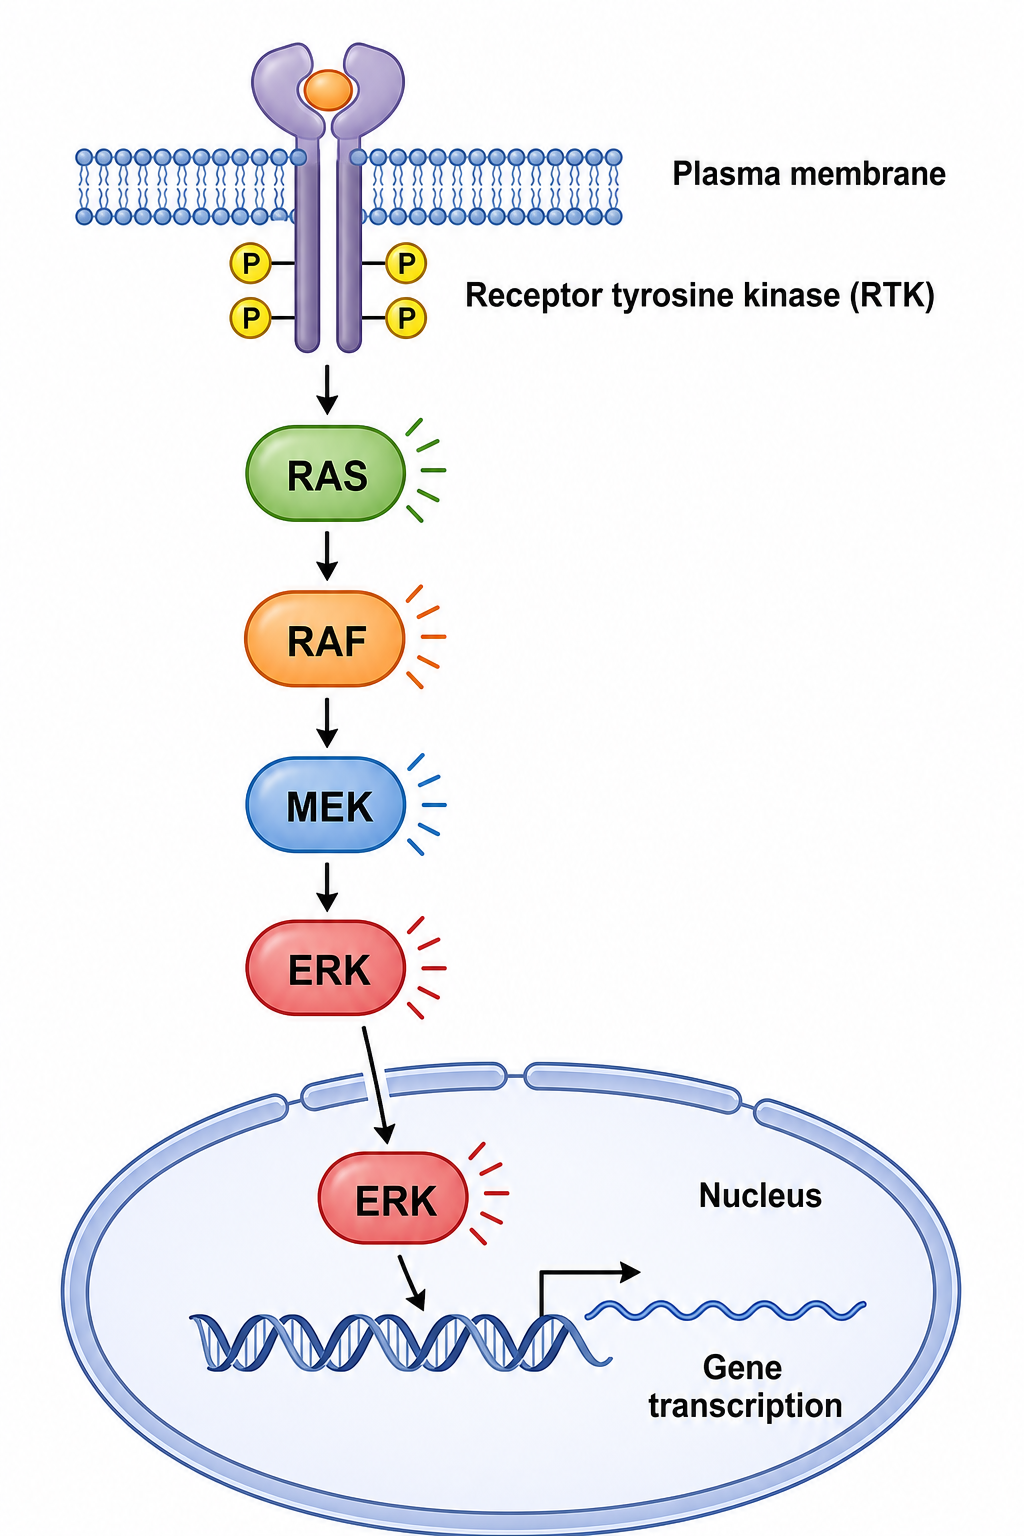
The MAPK/ERK pathway diagram is the canonical kinase cascade and the most requested signal transduction diagram — get the RAS → RAF → MEK → ERK order and the nuclear endpoint right and the rest follows.

MAPK ERK pathway diagram from receptor tyrosine kinase through RAS RAF MEK ERK to gene transcription in the nucleus

  1. Draw the MAPK/ERK pathway from a receptor tyrosine kinase through RAS, RAF, MEK, and ERK to gene transcription in the nucleus, labeling each kinase and showing the membrane and nucleus.
  2. Draw the RAS-RAF-MEK-ERK cascade with a negative feedback loop from ERK back to upstream components (RAF and SOS), clearly marked as inhibition bars.
  3. Draw a growth-factor receptor (RTK) dimerization and autophosphorylation event recruiting GRB2 and SOS to activate RAS, as a labeled membrane-level close-up.

PI3K-AKT-mTOR and survival signaling

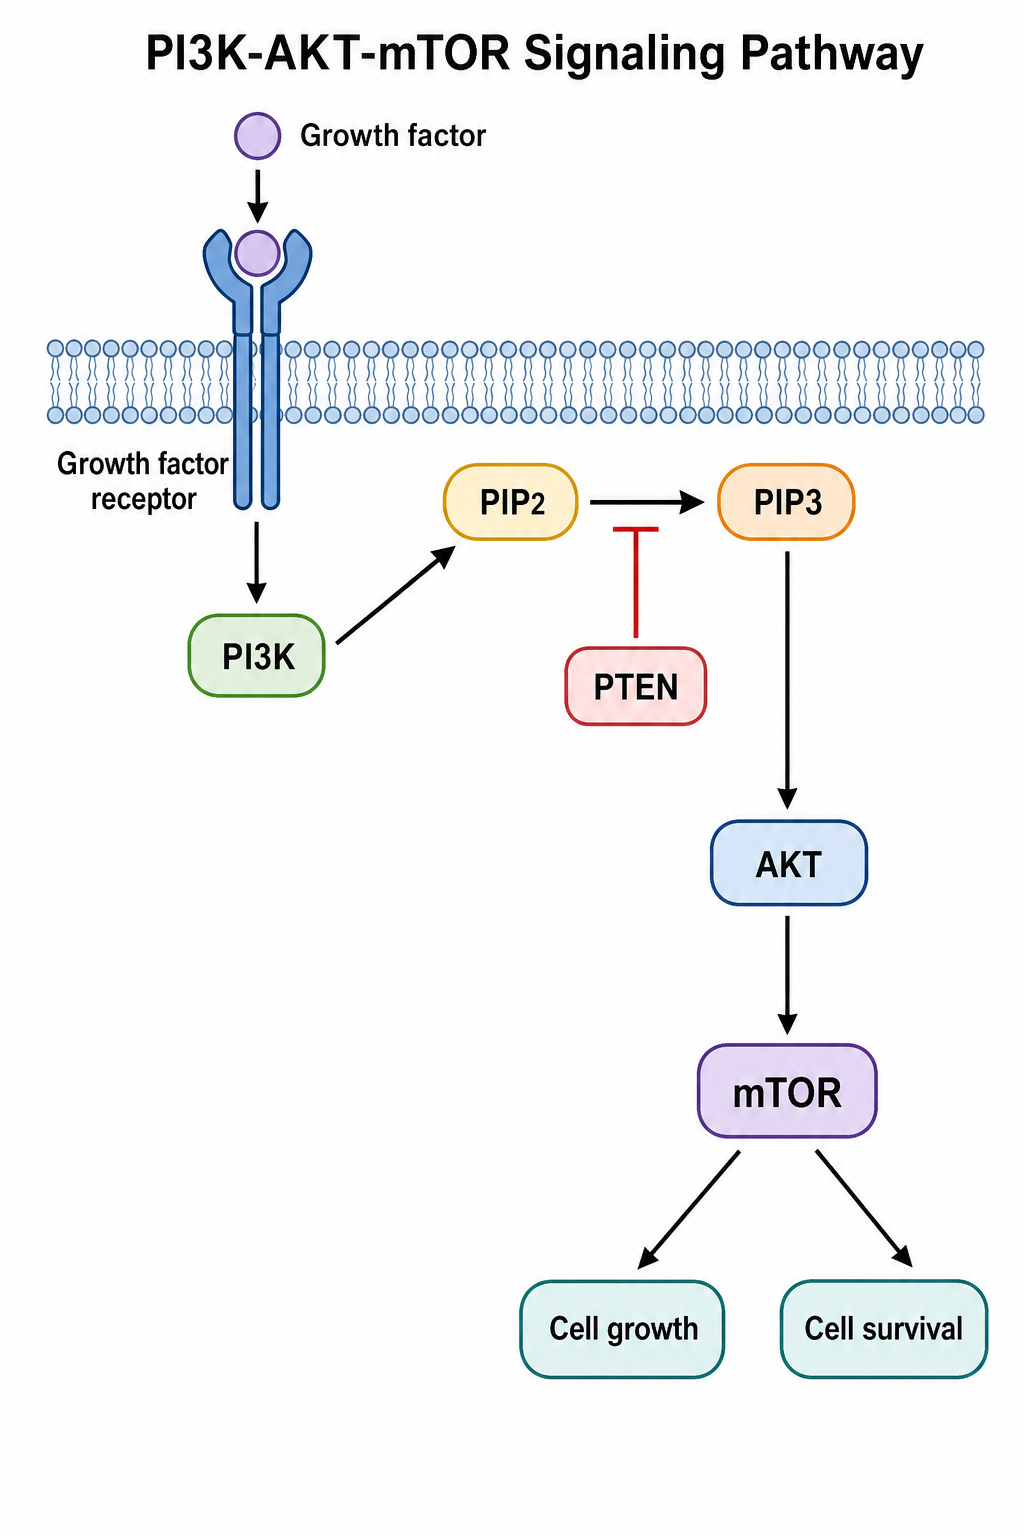
The PI3K-AKT-mTOR diagram is the central growth-and-survival axis, and the PTEN brake is the detail most figures get wrong — always show it as an inhibitor.

PI3K AKT mTOR pathway diagram from growth factor receptor through PIP3 AKT and mTOR with PTEN inhibitor labeled

  1. Draw the PI3K-AKT-mTOR pathway from a growth-factor receptor through PI3K, PIP3, AKT, and mTOR, with PTEN shown as an inhibitor (flat-end bar) and downstream effects on cell growth and survival labeled.
  2. Draw the insulin signaling pathway from the insulin receptor through IRS-1, PI3K, and AKT to GLUT4 translocation to the membrane, labeling each step and glucose uptake.
  3. Draw the mTORC1 pathway integrating growth-factor, amino-acid, and energy (AMPK) inputs, with downstream protein synthesis and autophagy effects labeled.
  4. Draw a two-pathway crosstalk diagram showing where MAPK/ERK and PI3K-AKT signaling intersect downstream of the same receptor tyrosine kinase.

Wnt, Hedgehog, and developmental pathways

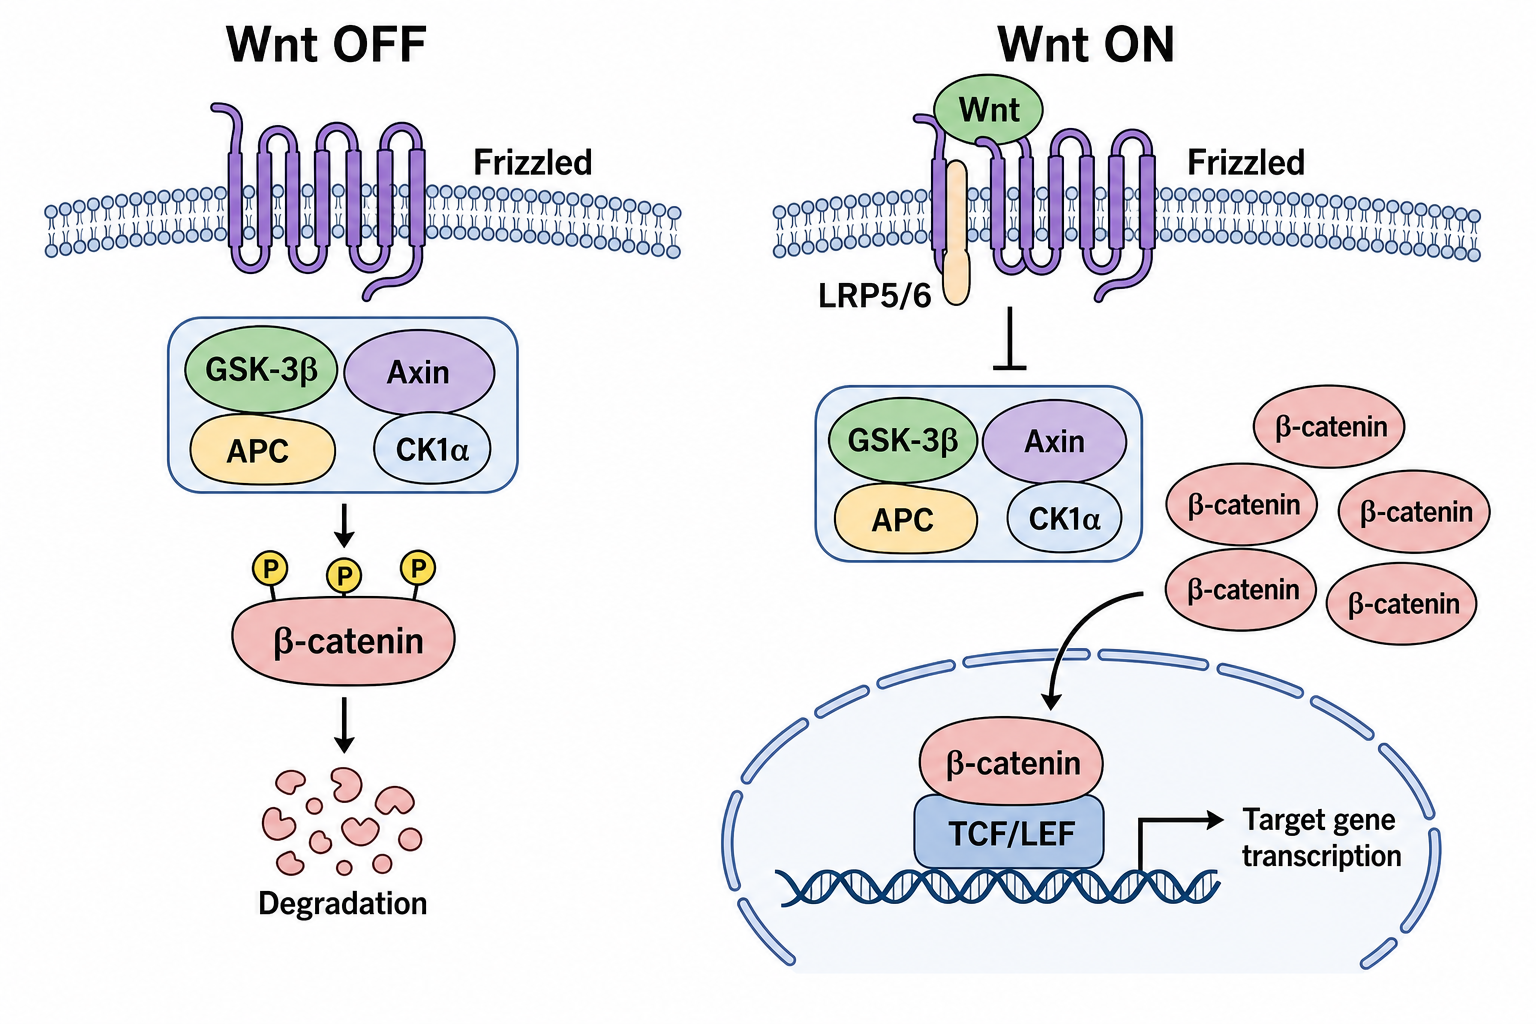
Developmental pathways are best shown as paired "off vs on" panels — the Wnt pathway diagram in particular only makes sense when the destruction complex and the stabilized β-catenin are contrasted.

Wnt beta-catenin pathway diagram in off and on states showing destruction complex GSK-3 beta and TCF LEF in the nucleus

  1. Draw the canonical Wnt/β-catenin pathway in two states: Wnt off (β-catenin degraded by the destruction complex) and Wnt on (β-catenin stabilized and entering the nucleus), labeling Wnt, Frizzled, LRP, GSK-3β, APC, Axin, β-catenin, and TCF/LEF.
  2. Draw the Hedgehog signaling pathway showing PTCH, SMO, and GLI transcription factors in the off and on states, with the cilium context labeled.
  3. Draw the Notch signaling pathway with ligand-receptor binding, receptor cleavage by γ-secretase, and the Notch intracellular domain (NICD) entering the nucleus.

Inflammation and immune signaling

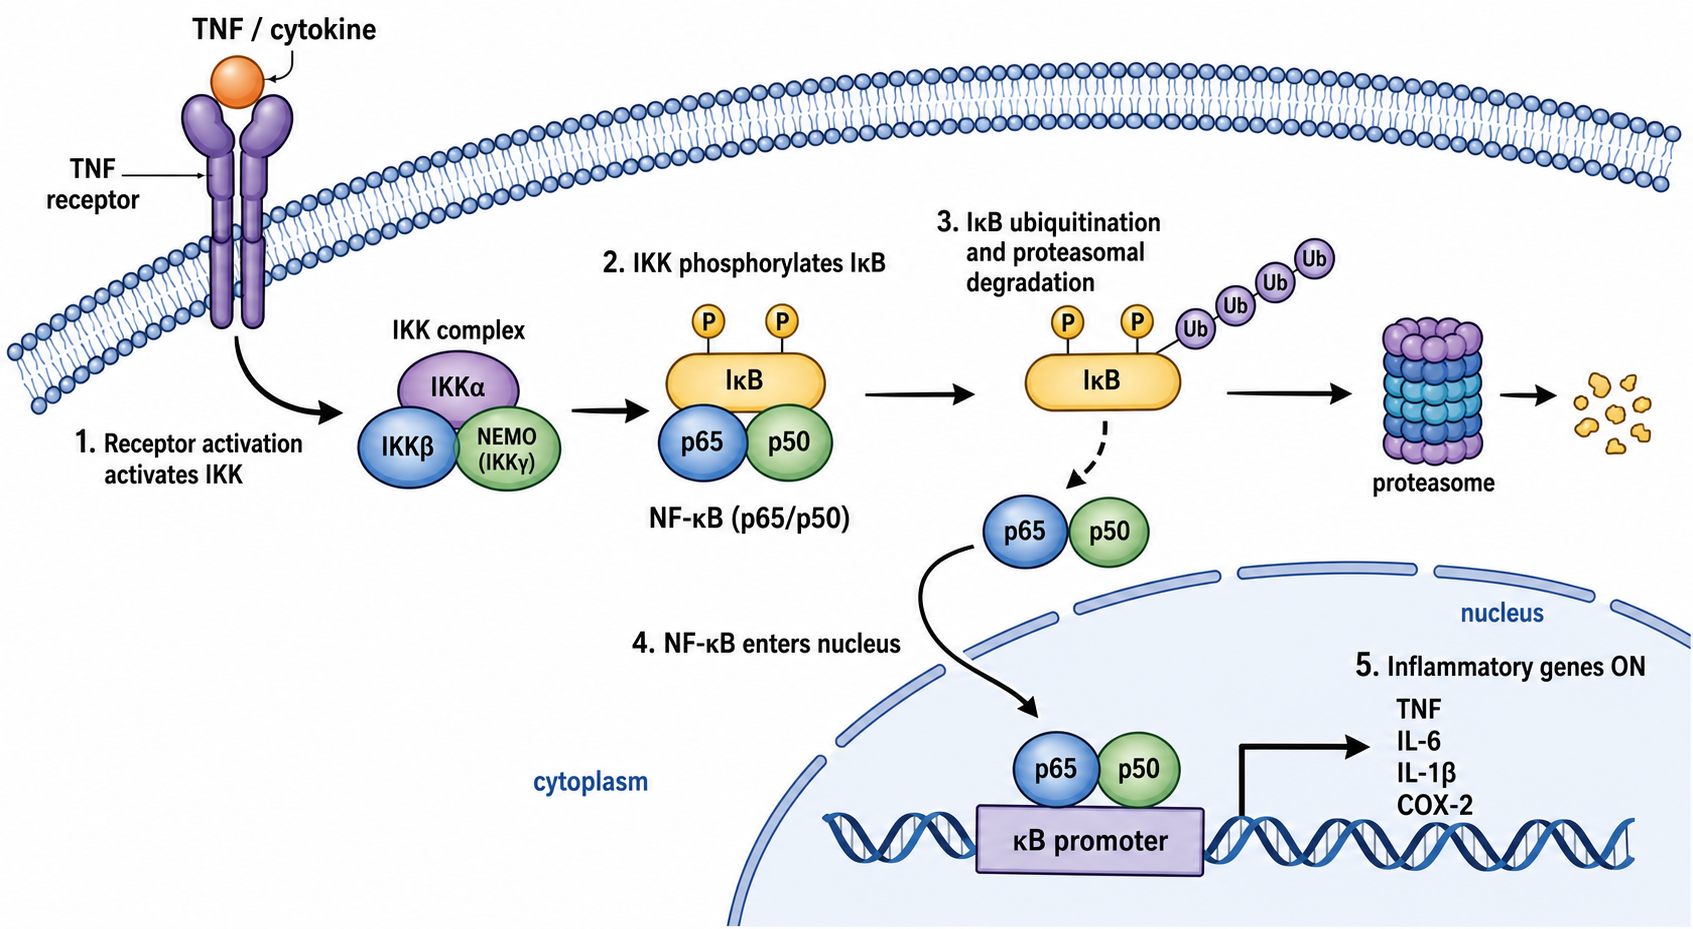
Inflammatory cascades end in transcription factors entering the nucleus — the NF-κB diagram and JAK-STAT diagram are the two most searched, so show the nuclear translocation step clearly.

NF-kappaB pathway diagram TNF receptor activating IKK complex IkB degradation and NF-kB entering the nucleus

  1. Draw the NF-κB pathway: a TNF receptor activating the IKK complex, IκB phosphorylation and degradation, and NF-κB entering the nucleus to switch on inflammatory genes.
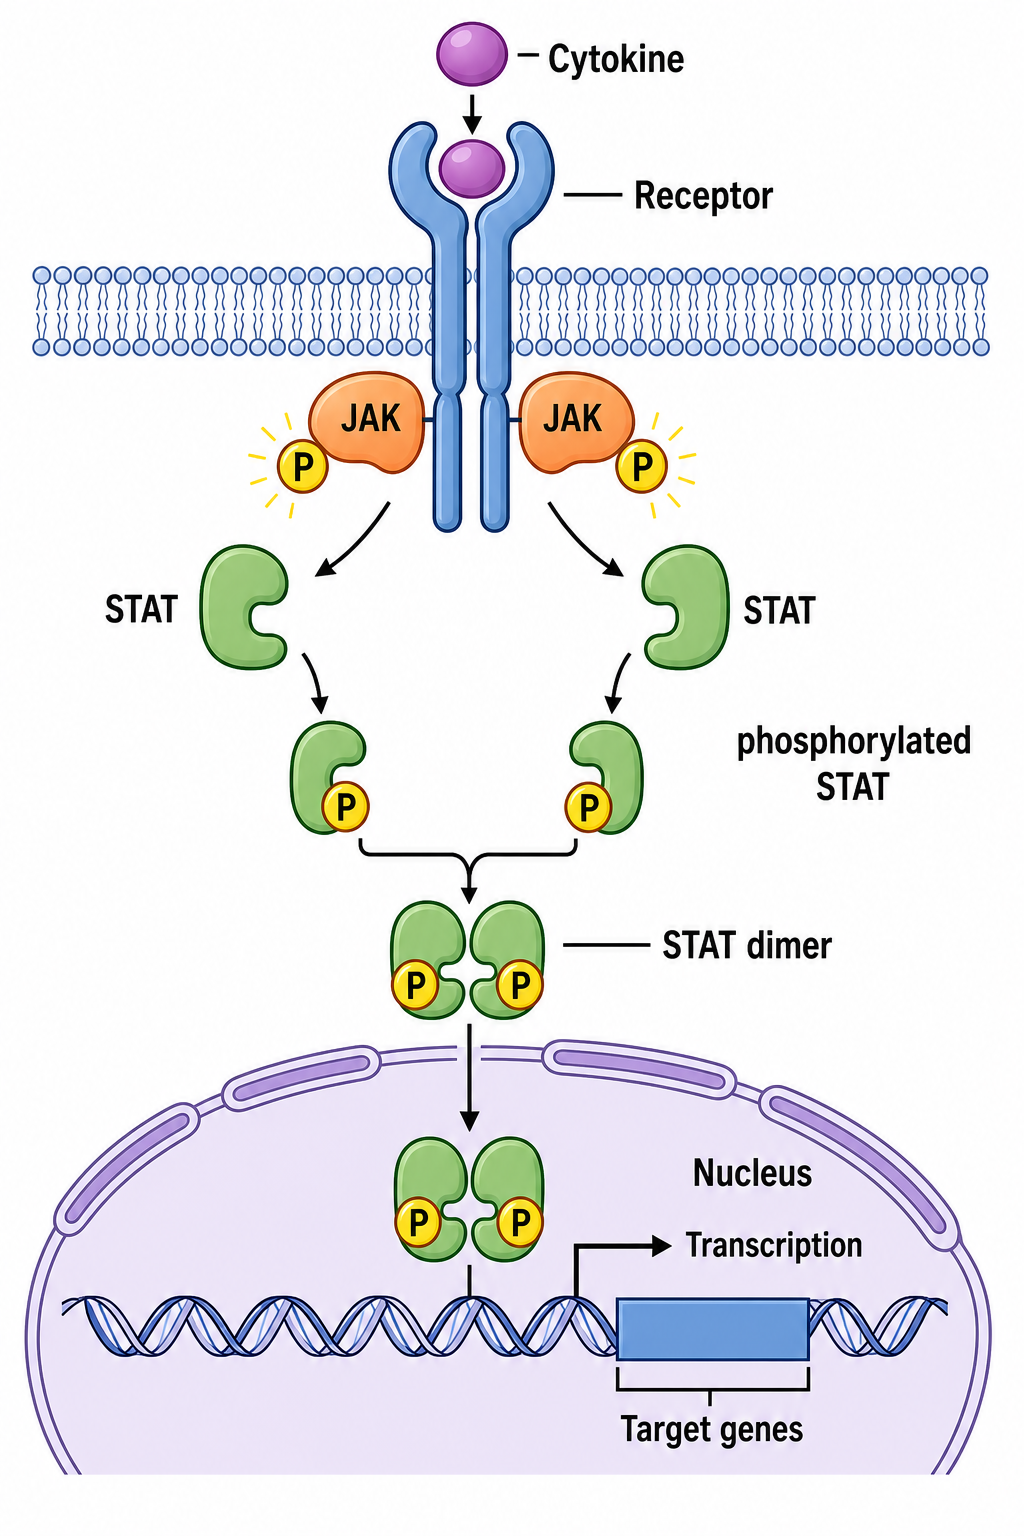
  2. Draw the JAK-STAT pathway: a cytokine binding its receptor, JAK activation, STAT phosphorylation and dimerization, and STAT dimers entering the nucleus to drive transcription.
  3. Draw the inflammasome (NLRP3) activation pathway leading to caspase-1 activation and IL-1β maturation, with the priming and activation signals labeled.

JAK STAT pathway diagram cytokine receptor JAK activation STAT phosphorylation dimerization and nuclear transcription

Stress, apoptosis, and TGF-β

Stress and death pathways need their negative regulators front and center — show MDM2 braking p53, and draw the TGF-β pathway SMAD relay all the way into the nucleus.

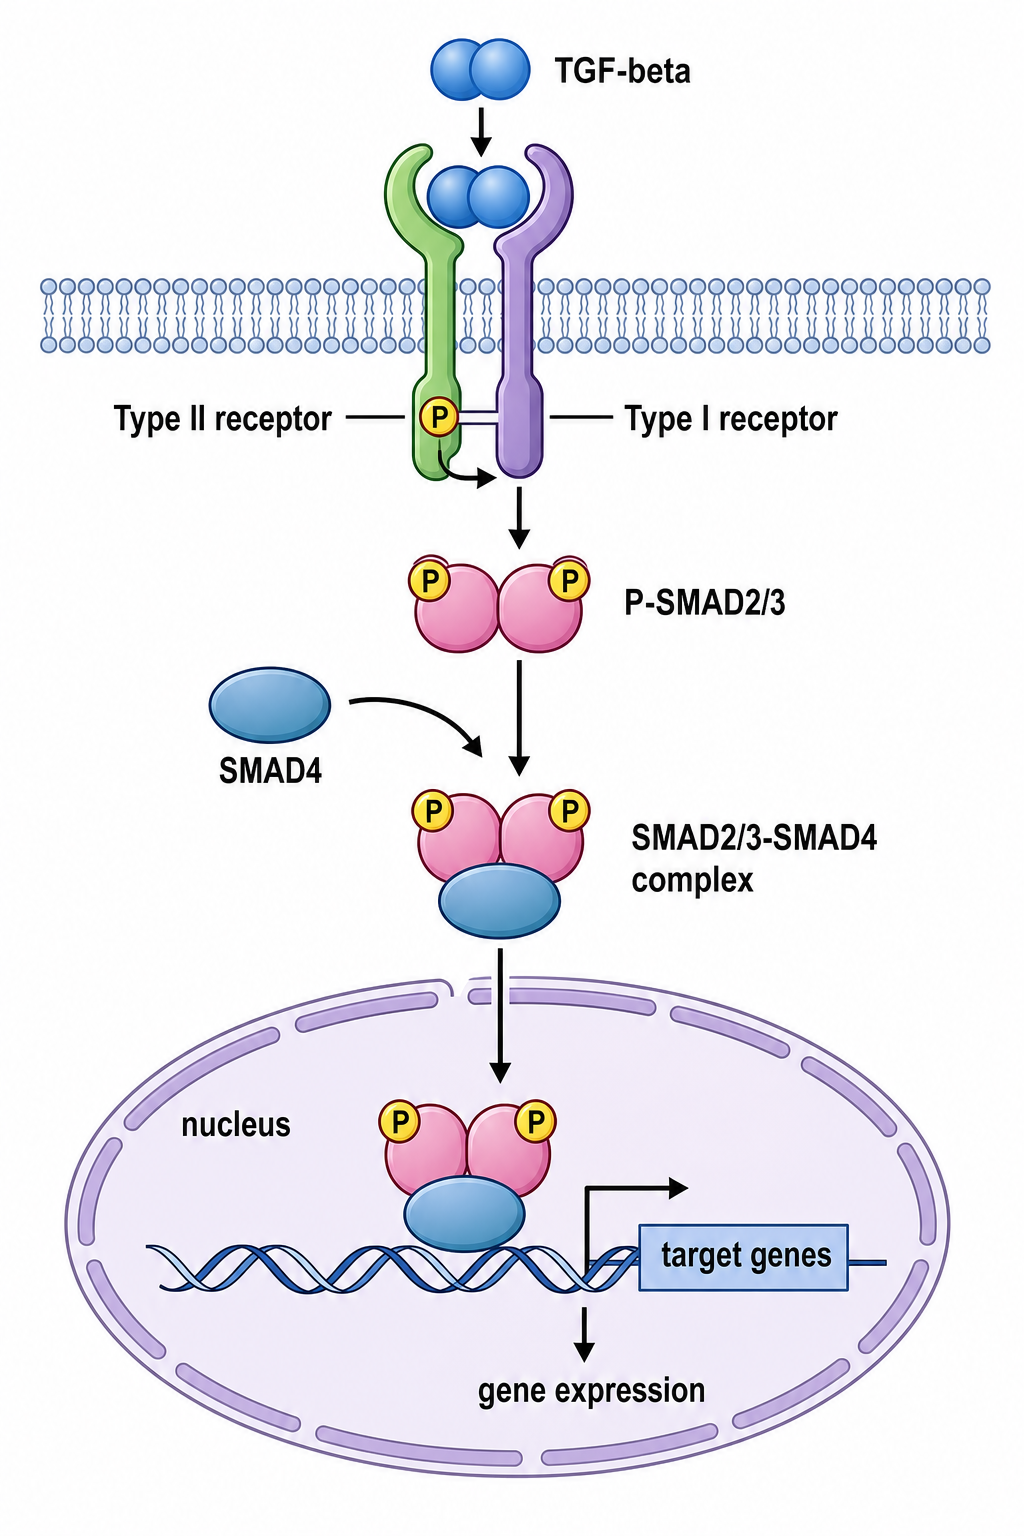
TGF beta SMAD pathway diagram type I and II receptors SMAD2 3 phosphorylation SMAD4 complex and nuclear gene regulation

  1. Draw the TGF-β/SMAD pathway: TGF-β binding type I and type II receptors, SMAD2/3 phosphorylation, SMAD4 complex formation, and nuclear gene regulation.
  2. Draw the p53 stress-response pathway from DNA damage to cell-cycle arrest and apoptosis, with MDM2 shown as a negative regulator (inhibition bar).
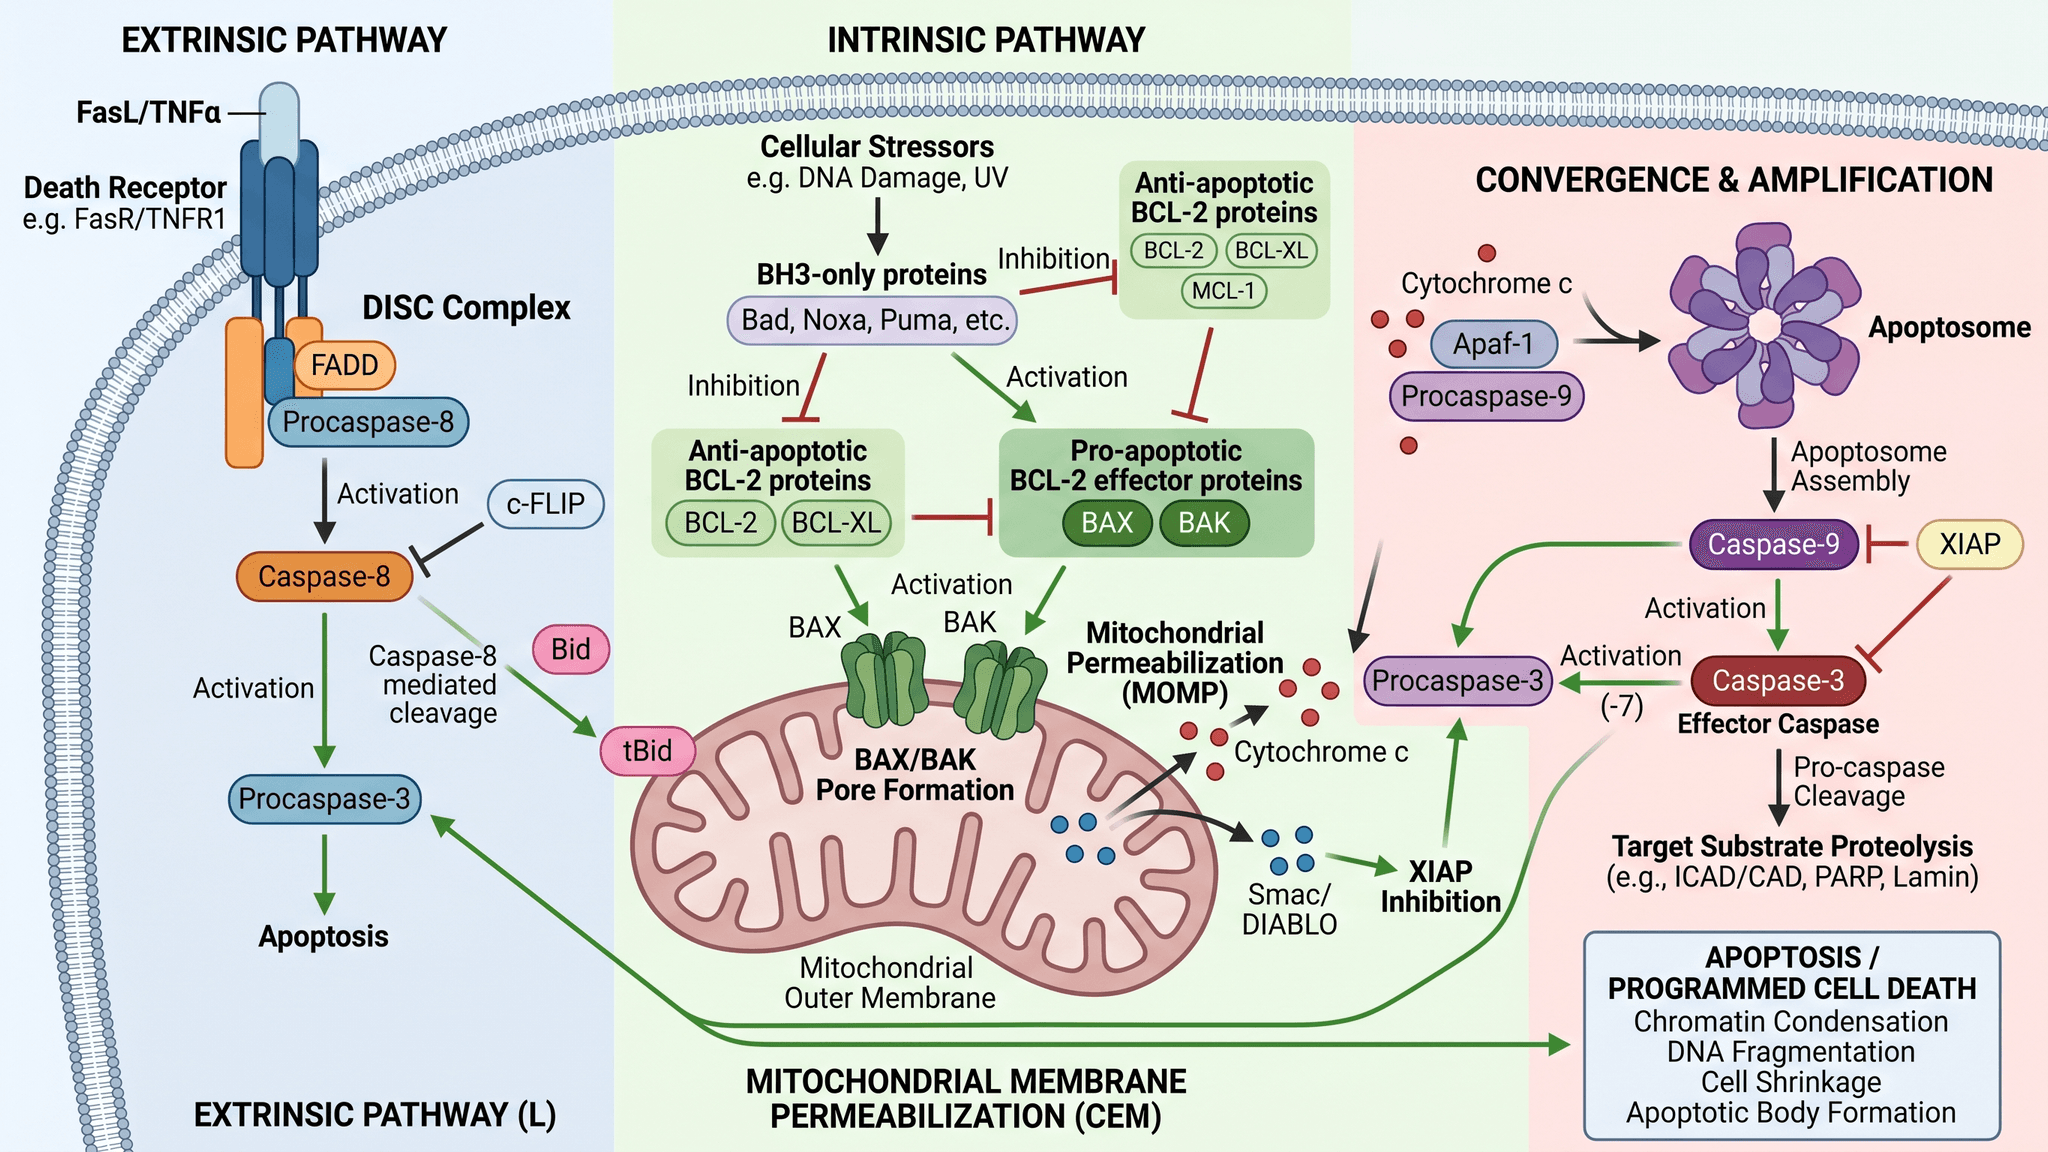
  3. Draw the intrinsic (mitochondrial) apoptosis pathway: cytochrome c release, apoptosome formation, and caspase-9 then caspase-3 activation, with BCL-2 family regulators (BAX, BAK, BCL-2) labeled.
  4. Draw the extrinsic apoptosis pathway from a death receptor (Fas/FasL) through FADD and caspase-8 to executioner caspase activation.
  5. Draw the oxidative-stress KEAP1-NRF2 pathway, showing NRF2 stabilization on KEAP1 inhibition and antioxidant response element (ARE) gene activation.

Metabolic, receptor, and crosstalk signaling

Membrane-to-second-messenger cascades round out the set — the GPCR/cAMP and AMPK energy-sensing pathways pair well with feedback and crosstalk views.

  1. Draw a G-protein-coupled receptor (GPCR) cAMP/PKA pathway from ligand binding, through Gαs activation and adenylyl cyclase, to cAMP and PKA-driven phosphorylation.
  2. Draw the AMPK energy-sensing pathway responding to a high AMP:ATP ratio, switching on catabolic processes and switching off anabolic processes (inhibition bars), with mTORC1 inhibition labeled.
  3. Draw the calcium-calmodulin signaling pathway from a GPCR through PLC, IP3, and ER calcium release to CaMKII activation.
  4. Draw a receptor tyrosine kinase pathway with two negative feedback loops, one fast (receptor internalization) and one slow (transcriptional), both marked as inhibition.
  5. Draw a crosstalk diagram showing how NF-κB and JAK-STAT signaling converge on overlapping inflammatory gene sets in the nucleus.
  6. Draw a one-page overview connecting MAPK/ERK, PI3K-AKT-mTOR, and Wnt pathways from shared upstream receptors, color-coding each cascade and labeling the shared nodes.

Common mistakes (and how to fix them)

  • Reversed or missing direction. Fix: explicitly request "activation arrows and flat-end inhibition bars" and name what inhibits what ("PTEN inhibits PIP3").
  • Wrong node order. Fix: list the cascade in sequence in the prompt (RAS → RAF → MEK → ERK) so the AI does not shuffle the kinases.
  • Components in the wrong compartment. Fix: state "show the membrane, cytoplasm, and nucleus" and say which node ends up in the nucleus.
  • Missing feedback or crosstalk. Fix: ask for it directly ("add a negative feedback loop from ERK to RAF") — it is omitted by default.
  • Misspelled or abbreviated kinases. Fix: spell out exact names ("GSK-3β", "MEK1/2"); re-prompt with "correct the label 'GSK3' to 'GSK-3β'."
  • Garbled text (typical of generic image AI). Fix: SciDraw AI renders clean sans-serif labels; re-prompt the exact wording if a label is wrong.

Export and use your pathway figures

Once a cascade looks right, export it to editable SVG or PowerPoint (PPTX), or download a high-resolution image for your manuscript, slides, or poster. Need to fix a kinase name or translate a label? See how to edit text and labels in an AI figure. Need a different color scheme — for example a colorblind-safe palette that keeps each cascade distinct? See how to recolor a scientific diagram. Editable export is what makes this a practical BioRender alternative for pathways: you can keep iterating after the first draft instead of starting over.

Frequently asked questions

What is the best AI tool to draw a signaling pathway? SciDraw AI's Signaling Pathway Diagram Generator is built for publication-ready pathway figures — MAPK/ERK, PI3K-AKT-mTOR, Wnt, NF-κB, JAK-STAT, and TGF-β — with correct activation arrows, inhibition bars, and editable SVG/PPTX export.

How do I draw a signaling pathway online from a description? Describe the cascade in order — receptor, each kinase or mediator, and the nuclear endpoint — and name everything you want labeled, then generate. Use the four-part template above, or start from any prompt in this guide and adapt it.

Can I make a signaling pathway diagram for free? Yes — you can start generating a signaling pathway diagram free, then upgrade for more credits and editable SVG/PPTX export when you need it for a manuscript or talk.

Is this a good BioRender alternative for pathways? If you want a signal transduction diagram from a text description instead of dragging icons onto a canvas, an AI pathway diagram maker is a fast, low-cost alternative for MAPK, PI3K-AKT, Wnt, NF-κB, JAK-STAT, and TGF-β figures.

Are the figures accurate enough for publication? They are designed for publication-ready output, but always review the biology for your specific model — node order, feedback loops, and exact kinase names — and correct any labels before submitting.

Start creating

Pick any prompt above, paste it into the Signaling Pathway Diagram Generator, and refine it in the SciDraw AI editor until it matches your model. From a single kinase cascade to a full crosstalk overview, your next signaling pathway figure is one sentence away.

AI Prompts
Prompts for Sensor Schematics and Microfluidic Chip Diagrams
AI Prompts

Prompts for Sensor Schematics and Microfluidic Chip Diagrams

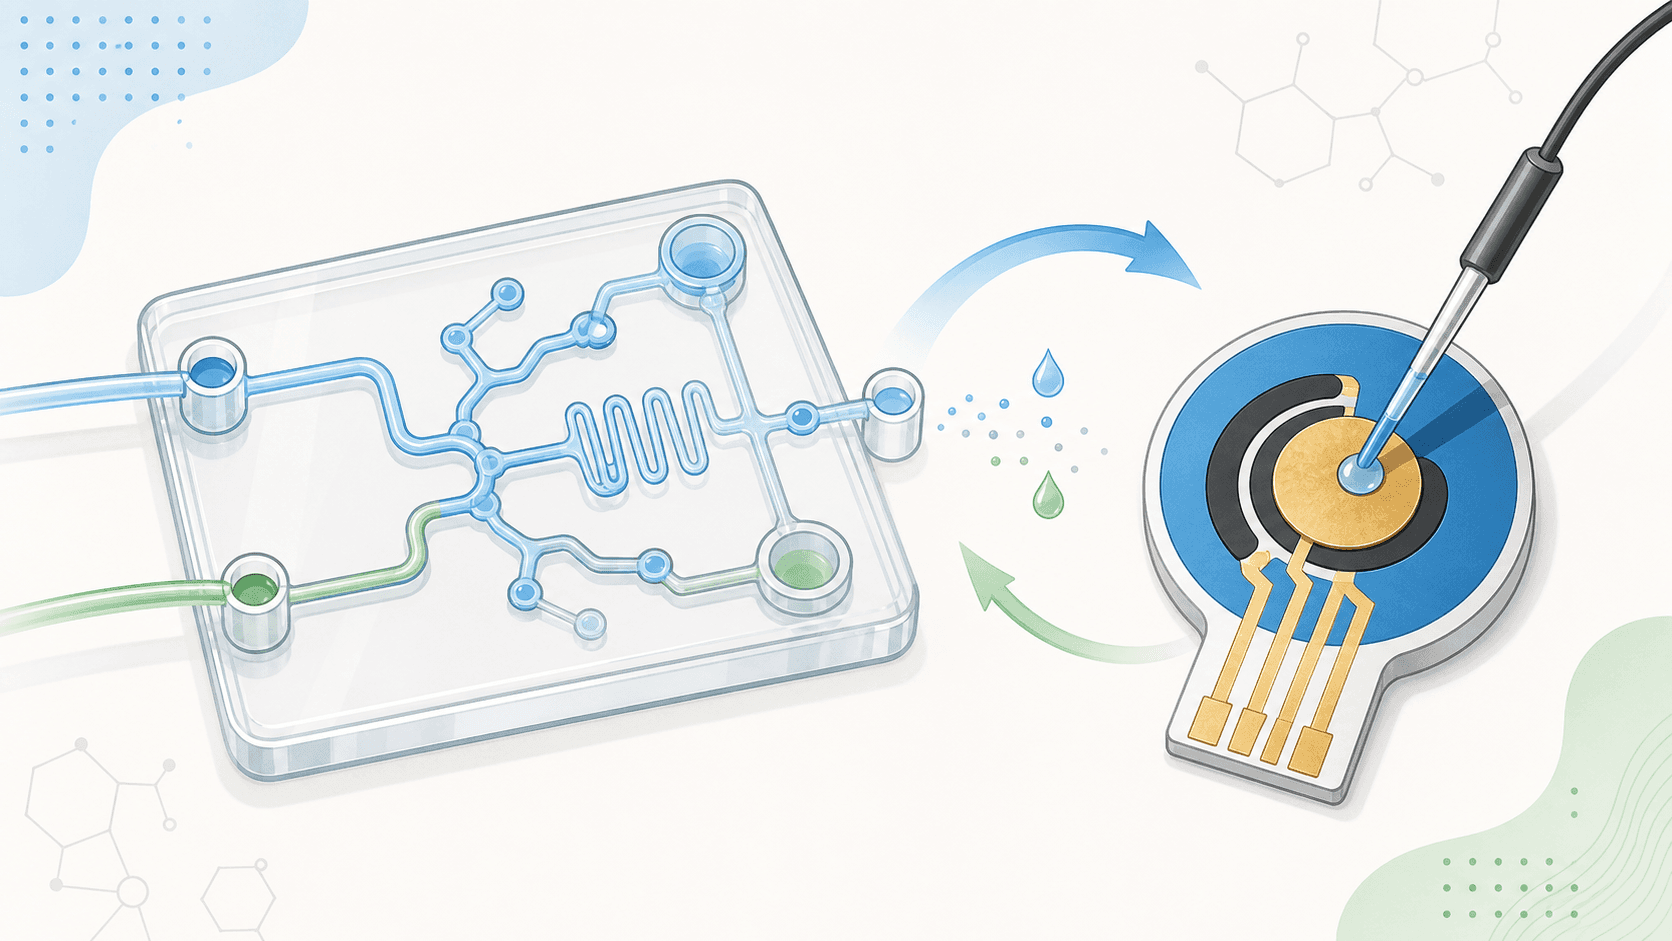
Copy-paste AI prompts and layout structure for drawing sensor schematics — electrochemical, fluorescent probe, electrode — and microfluidic chip diagrams like lab-on-a-chip, droplet, and organ-on-a-chip.

avatar for Davie Chen / SciDraw AI
Davie Chen / SciDraw AI
2026/07/05
How to Make an Apoptosis Pathway Diagram with AI (2026 Guide)
AI Prompts

How to Make an Apoptosis Pathway Diagram with AI (2026 Guide)

Draw a clean, labeled apoptosis pathway diagram with AI — intrinsic and extrinsic pathways, caspases, BCL-2 family, cytochrome c, and the apoptosome — using a reusable prompt template, real examples, and publication-ready export. No design software required.

avatar for Davie Chen / SciDraw AI
Davie Chen / SciDraw AI
2026/06/18
How to Make an NF-κB Inflammation Pathway Diagram with AI (2026)
AI Prompts

How to Make an NF-κB Inflammation Pathway Diagram with AI (2026)

Draw a clean, labeled NF-κB and inflammasome pathway diagram with AI — TLR signaling, IKK, IκB degradation, p65/p50 nuclear translocation, NLRP3 inflammasome, caspase-1, and IL-1β — with a reusable prompt template, real examples, and publication-ready export.

avatar for Davie Chen / SciDraw AI
Davie Chen / SciDraw AI
2026/06/18
Explore Our Tools
Signaling Pathway Diagram Generator·Cell Illustration Generator·Biological Pathway Diagram Generator·Scientific Diagram Maker