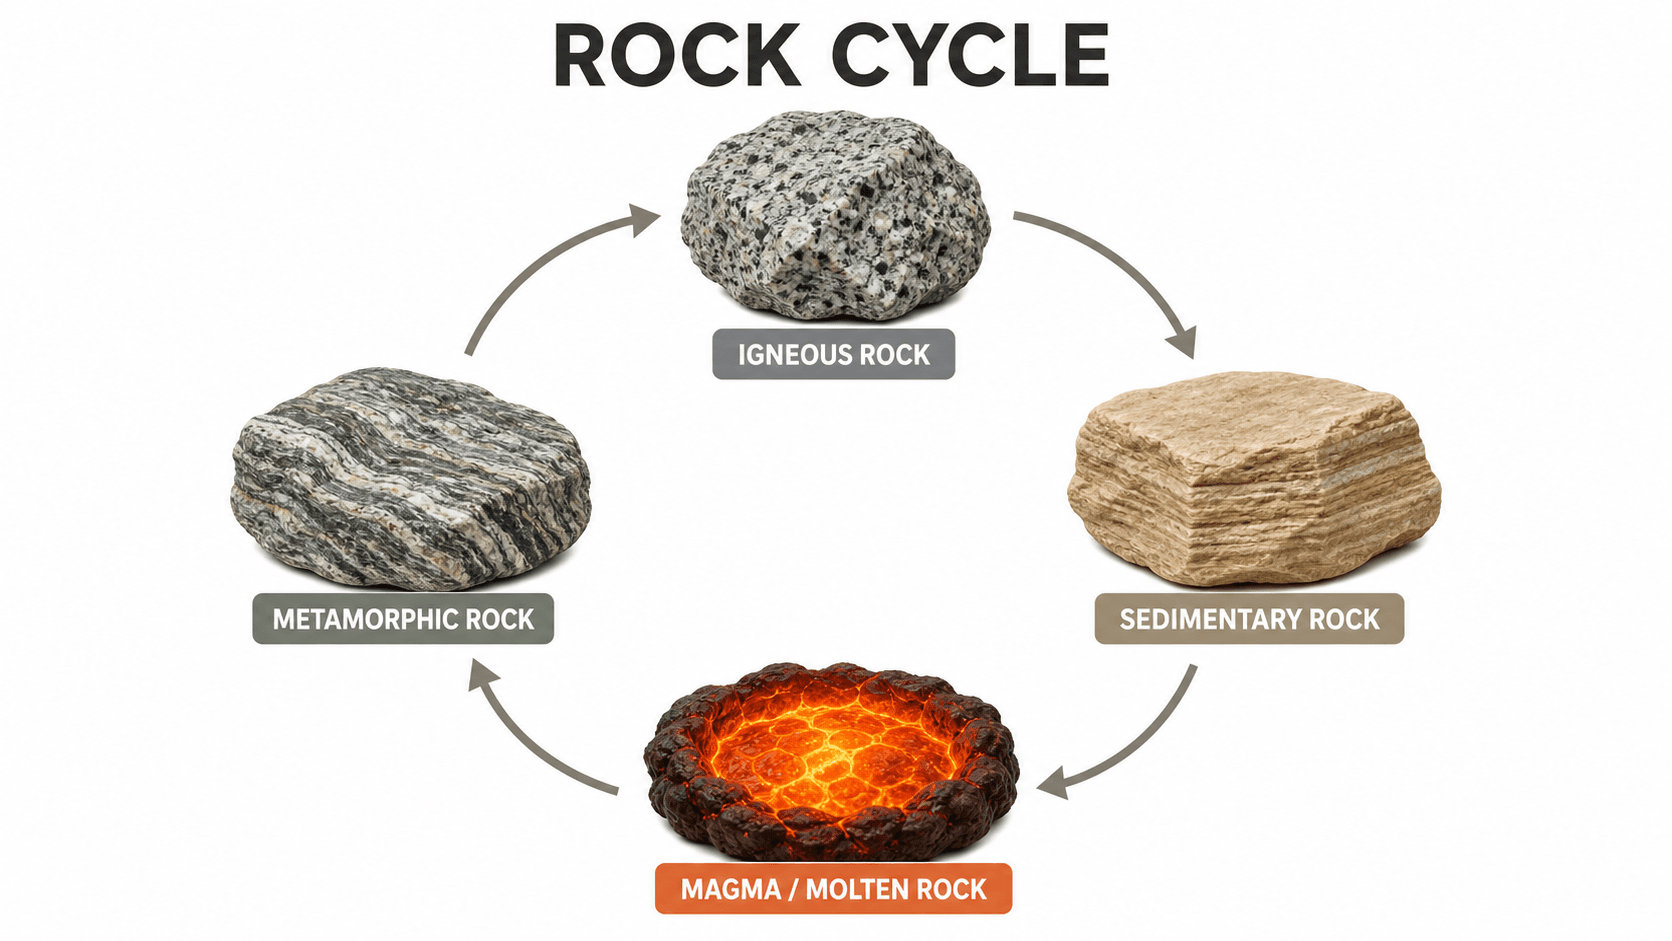
A rock cycle diagram looks simple — three rock types and a few arrows — but it is easy to misread the direction of a process or forget that any rock can become any other rock given the right conditions. The reliable way to read one is to identify the three rock types first, then follow each arrow as a specific process that transforms one type into the next.
This guide explains what a rock cycle diagram shows, the processes that connect igneous, sedimentary, and metamorphic rock, and how to build an accurate labeled version. If you need a finished figure now, the rock cycle diagram generator can draw a labeled cycle from a plain-language description.
Common rock cycle diagram mistakes
Check these before you worry about color or layout:
- Treating the cycle as one-directional. The rock cycle has no fixed start or end. Any rock type can transform into any other type — the arrows run in multiple directions, not a single loop.
- Confusing weathering with erosion. Weathering breaks rock down in place; erosion transports the resulting sediment. They are sequential, not interchangeable.
- Skipping the magma and lava distinction. Magma is molten rock below the surface; lava is molten rock that has reached the surface. Both cool to form igneous rock, but the labels differ.
- Forgetting that igneous rock forms two ways. Intrusive (plutonic) rock cools slowly underground with large crystals; extrusive (volcanic) rock cools quickly at the surface with small crystals.
- Labeling "heat and pressure" as melting. Heat and pressure produce metamorphic rock without fully melting it. Only full melting produces magma.
- Leaving out compaction and cementation. Sediment does not become sedimentary rock on its own — it is buried, compacted, and cemented over time.
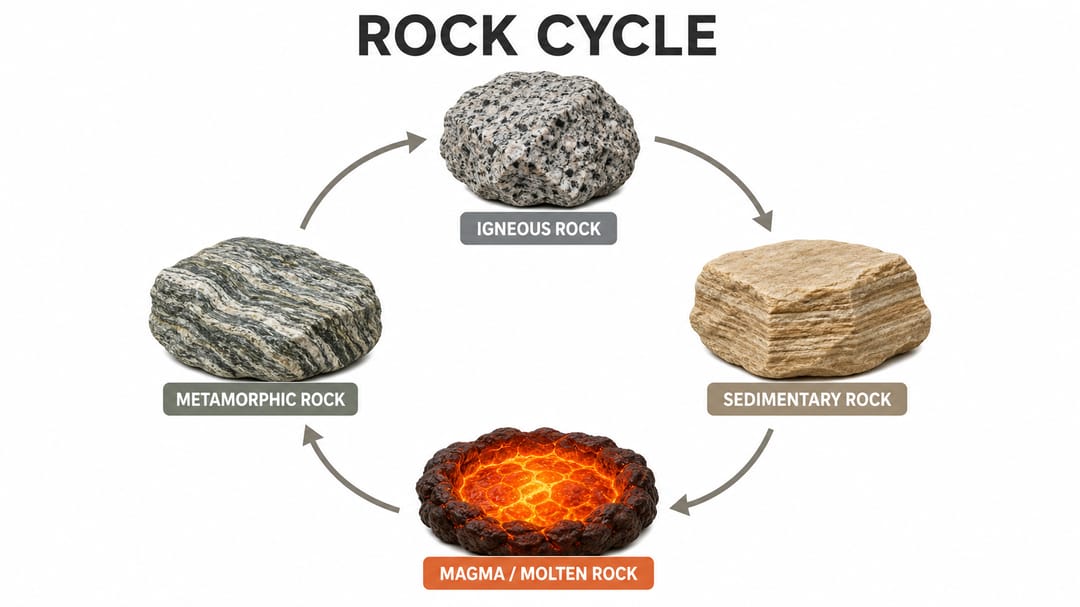
A clear rock cycle diagram labels each rock type and names the process on every arrow.
The three rock types
Every rock cycle diagram is built around three rock types. Learn these first and the processes make sense.
| Rock type | How it forms | Examples |
|---|---|---|
| Igneous | Cooling and crystallization of magma or lava | Granite (intrusive), basalt (extrusive) |
| Sedimentary | Compaction and cementation of sediment | Sandstone, limestone, shale |
| Metamorphic | Existing rock altered by heat and pressure | Marble (from limestone), slate (from shale), gneiss |
The processes that connect them
The arrows in a rock cycle diagram are the important part — each one is a named process:
- Weathering and erosion break rock into sediment and transport it.
- Deposition drops sediment in layers, usually in water.
- Compaction and cementation press and glue sediment into sedimentary rock.
- Heat and pressure deep underground turn any rock into metamorphic rock.
- Melting converts rock into magma when temperatures are high enough.
- Cooling and crystallization turn magma or lava into igneous rock.
- Uplift and exposure bring buried rock back to the surface, where weathering starts the cycle again.
Step-by-step: reading the cycle
- Locate the three rock types. Find igneous, sedimentary, and metamorphic — usually the three main nodes.
- Find magma. It sits at the "molten" stage, often at the bottom or center.
- Trace each arrow to a process. Read the label on every arrow rather than assuming direction.
- Confirm reversibility. Check that arrows show any rock can reach any other rock, sometimes through several steps.
- Follow one full path. For example: igneous rock → weathering → sediment → compaction → sedimentary rock → heat and pressure → metamorphic rock → melting → magma → cooling → igneous rock.
Better prompts for an AI rock cycle diagram
Vague prompts produce decorative but inaccurate figures. Describe the structure you want:
- "Label all three rock types and name the process on every arrow."
- "Show weathering and erosion as separate steps from deposition."
- "Distinguish magma (underground) from lava (surface) at the melting stage."
- "Use a muted earthy palette and keep leader lines from crossing."
The rock cycle diagram generator reads these instructions and produces an editable figure, so you can adjust a label or arrow with words instead of redrawing.
Accuracy checklist
Before you submit a rock cycle diagram, confirm:
- All three rock types are labeled correctly.
- Every arrow names a specific process, not just "changes into."
- Weathering and erosion are shown as distinct steps.
- Magma and lava are labeled where each applies.
- The cycle reads as multi-directional, not a single loop.
- Igneous formation shows cooling and crystallization.
Related diagram guides
- How to label a plant cell diagram for biology figures.
- How to make a cladogram for evolutionary relationships.
- Explore more Earth-science tools like the water cycle diagram and layers of the Earth diagram makers.
FAQ
Is there a starting point in the rock cycle? No. The rock cycle is continuous and has no fixed beginning or end. Any rock type can transform into any other type.
What is the difference between magma and lava? Magma is molten rock beneath the surface; lava is molten rock that has erupted onto the surface. Both cool to form igneous rock.
Can sedimentary rock turn into metamorphic rock? Yes. Heat and pressure can transform sedimentary rock (such as limestone) directly into metamorphic rock (such as marble).
How do I make a labeled rock cycle diagram quickly? Describe the rock types and processes to the rock cycle diagram generator and export a labeled figure, then remove labels for a blank worksheet version.