Chemistry is a visual science. Whether you are depicting the electron flow in an organic mechanism, the electrode architecture of an electrocatalytic cell, or the self-assembly of a supramolecular host-guest complex, clear illustrations are essential for publication and peer review.
With over 300 chemistry-specific illustrations generated on SciDraw AI recently, we see clear patterns in what researchers need most: reaction mechanisms, electrocatalysis schematics, energy profile diagrams, and molecular structure visualizations. This guide walks through each type with real examples and refined prompts from our community.
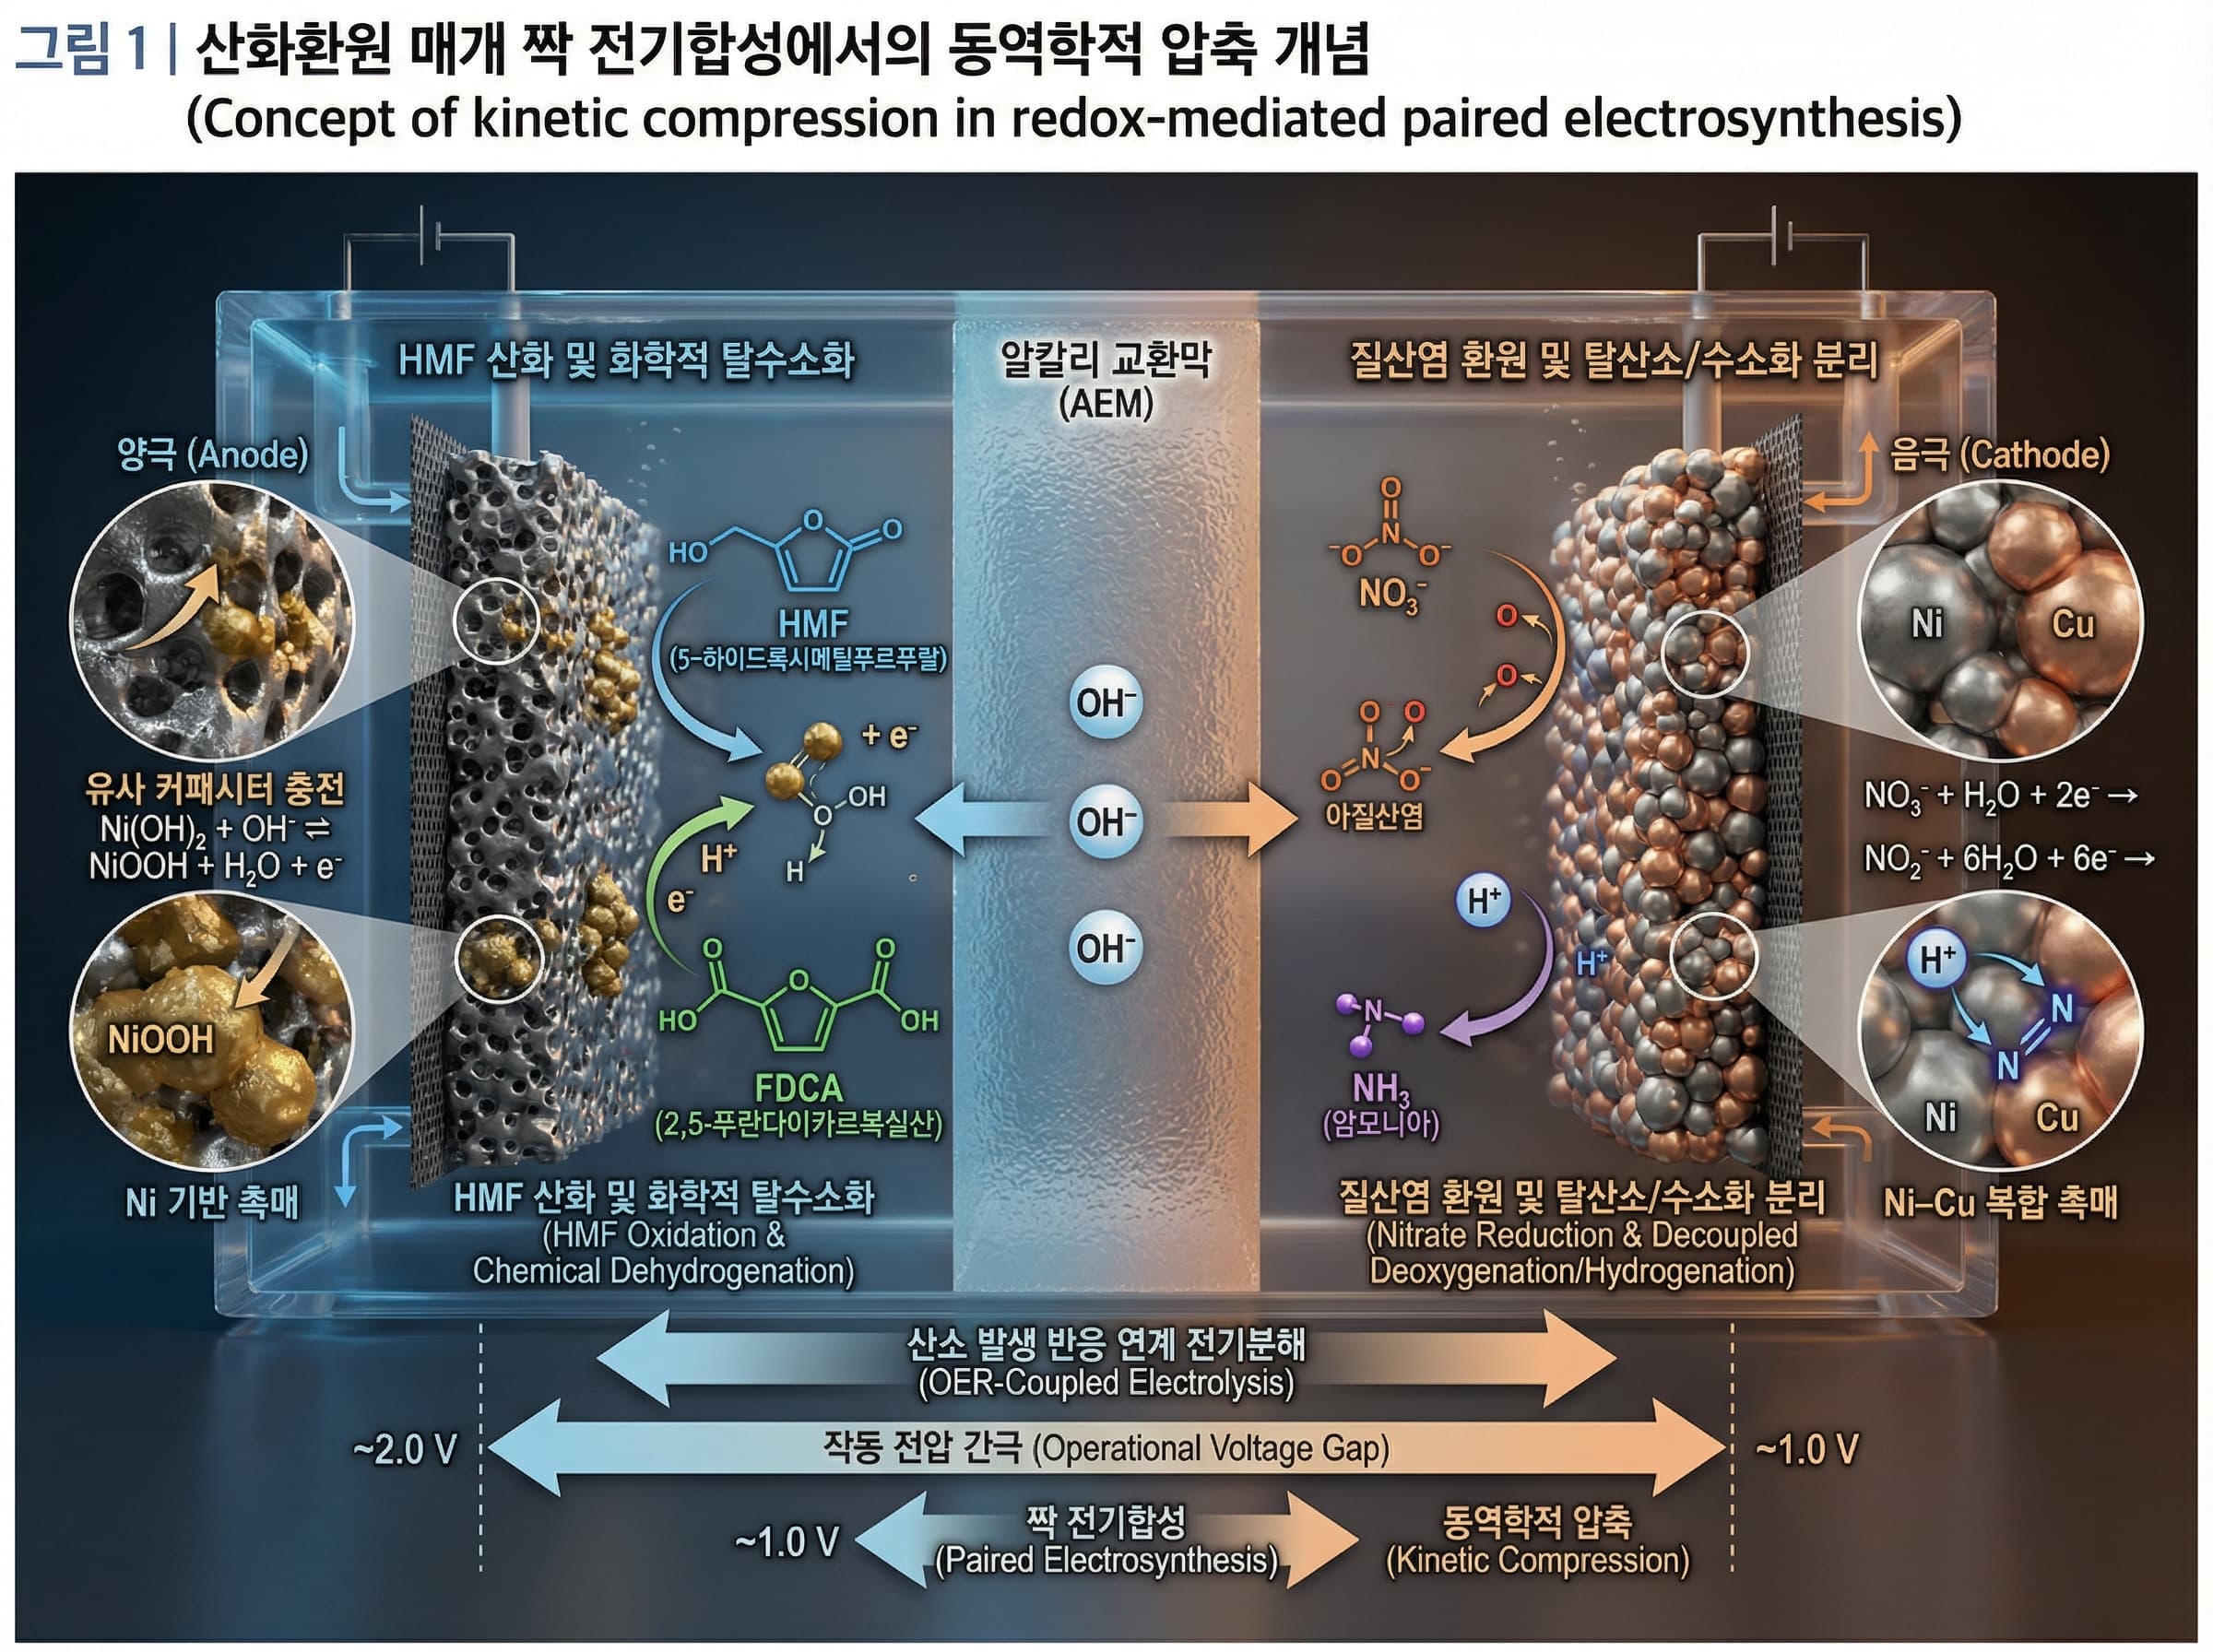
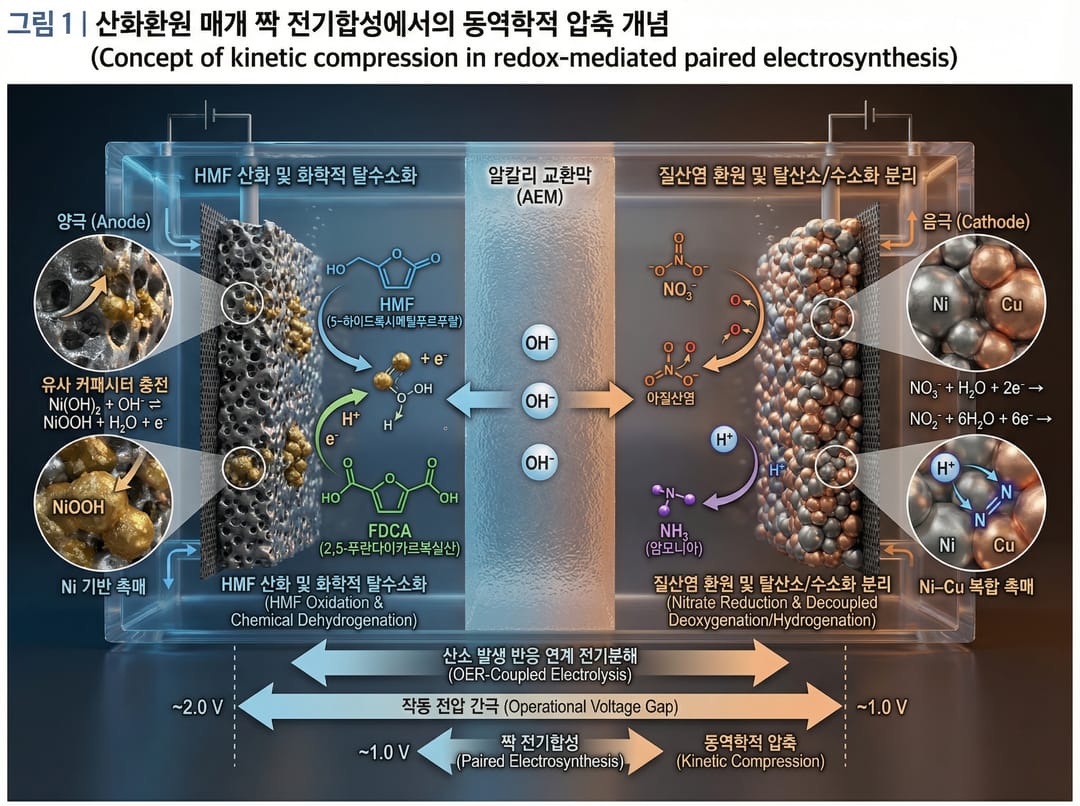 Alkaline membrane electrode assembly integrating HMF oxidation and nitrate reduction — a real researcher-created illustration
Most Popular Chemistry Illustration Topics
Based on keyword analysis of real researcher prompts, the top chemistry themes are:
- Reaction mechanisms (22% of chemistry prompts mention "reaction")
- Water and solution chemistry (17% mention "water" or "solution")
- Surface chemistry and catalysis (15% mention "surface")
- Molecular structures (11% mention "molecular")
- Energy diagrams (10% mention "energy")
- Electrochemistry (frequent terms: "electrode", "electrolysis", "transfer")
Electrocatalysis and Electrochemistry
Electrocatalysis is one of the fastest-growing illustration topics, reflecting the surge in clean energy research.
Membrane Electrode Assembly
Figure 1: Concept of kinetic compression
in redox-mediated paired electrosynthesis.
Schematic representation of an alkaline membrane electrode assembly
integrating HMF oxidation and nitrate reduction.
Show anode (HMF → FDCA), cathode (NO₃⁻ → NH₃),
anion exchange membrane separating compartments,
electron flow in external circuit,
mediator redox cycling at each electrode.
Nature Chemistry style, clean vector illustration.
Supercapacitor Architecture
GS-TCOP material assembled into a symmetric supercapacitor
using a KI-mixed H₂SO₄ redox electrolyte.
Show both electrodes with GS-TCOP coating,
separator membrane in center,
electrolyte ions (K⁺, I⁻, H⁺, SO₄²⁻) migrating,
charge storage mechanism at electrode-electrolyte interface,
Faradaic and non-Faradaic contributions labeled.
Electrochemistry journal style, cross-sectional view.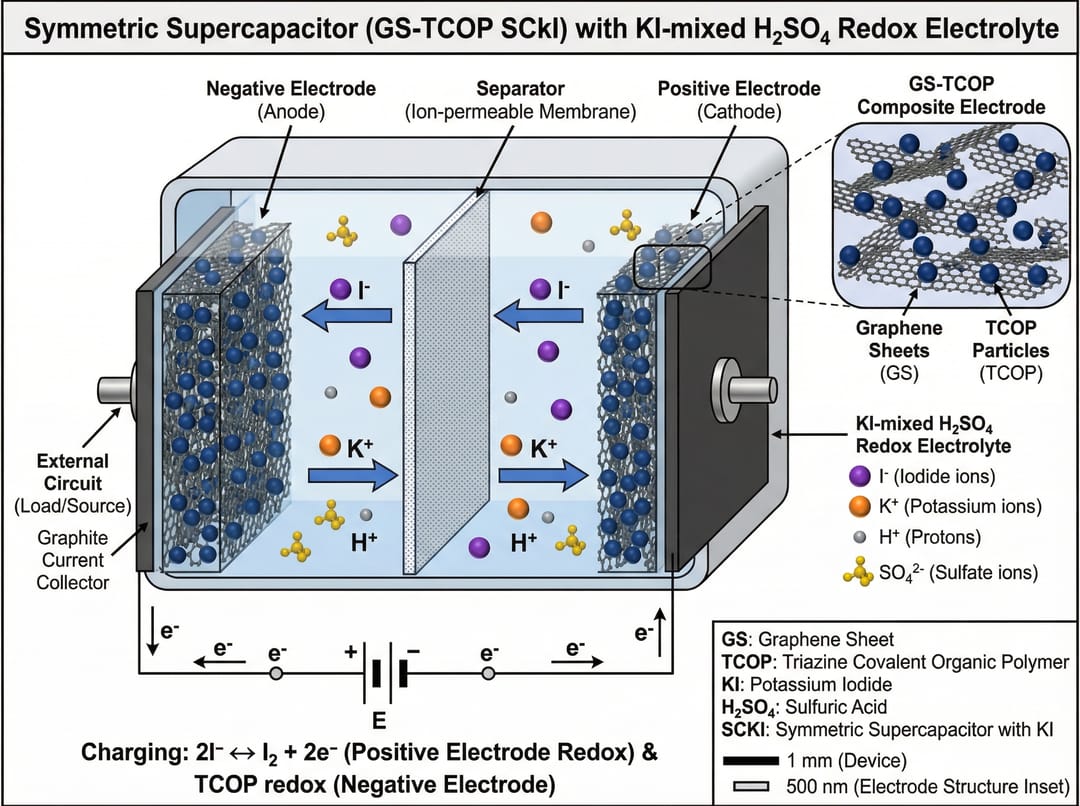 Symmetric supercapacitor with GS-TCOP material and redox electrolyte
Cathode Design for CO₂ Reduction
Schematic diagram for research project proposal.
Theme: construction of a cathode for electrocatalytic
carbon-nitrogen coupling of nitrite and carbon dioxide
to synthesize urea.
Show cathode material design, CO₂ and NO₂⁻ adsorption sites,
C-N bond formation at active sites,
urea product desorption,
Faradaic efficiency metrics.
Academic paper style for electrochemistry journal.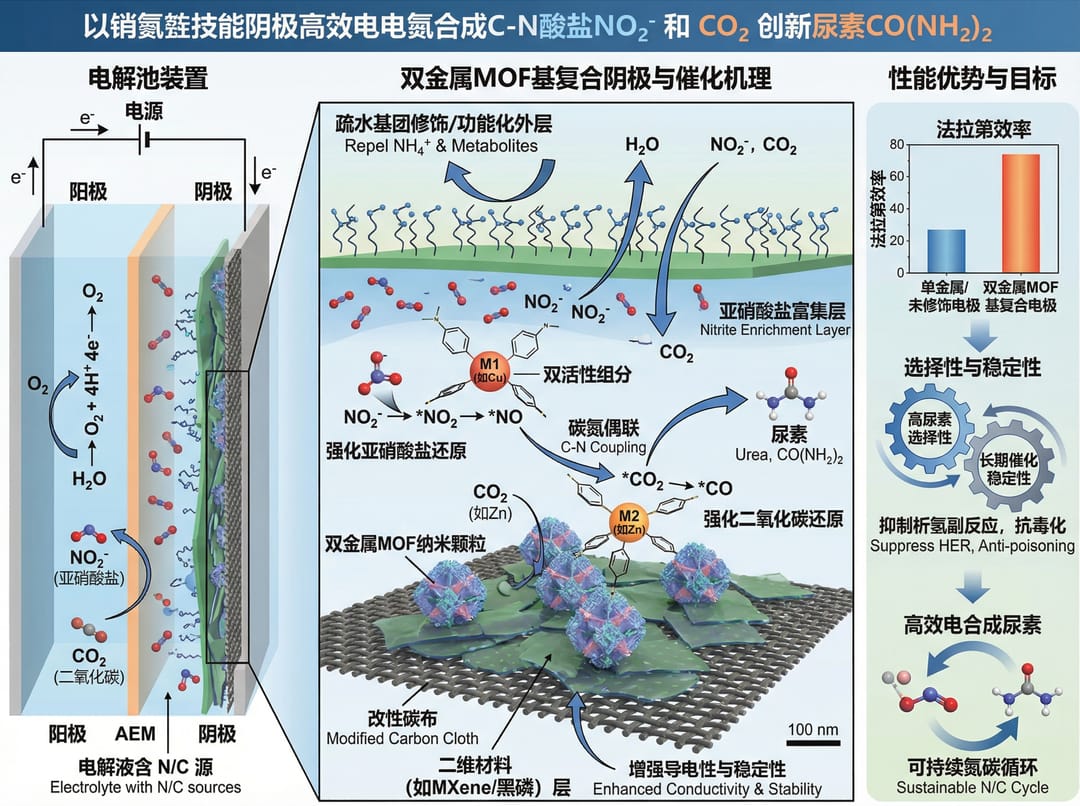 Cathode design for electrocatalytic CO₂-nitrite coupling to urea
Energy Diagrams and Reaction Coordinates
Free energy profiles are critical for computational and physical chemistry papers.
Multi-Path Energy Comparison
Unified Free Energy Profiles (ΔG coordinate graph).
Path 1 (Pure h-BN): Very high initial activation barrier,
Path 2 (Doped catalyst): Lower barriers at each step,
X-axis: reaction progress with labeled intermediates,
Y-axis: free energy (kcal/mol),
Transition states as peaks labeled TS1, TS2, TS3,
Activation energy Ea and ΔG° values annotated.
Clean scientific diagram, physical chemistry style,
suitable for addressing reviewer requests for activation barriers.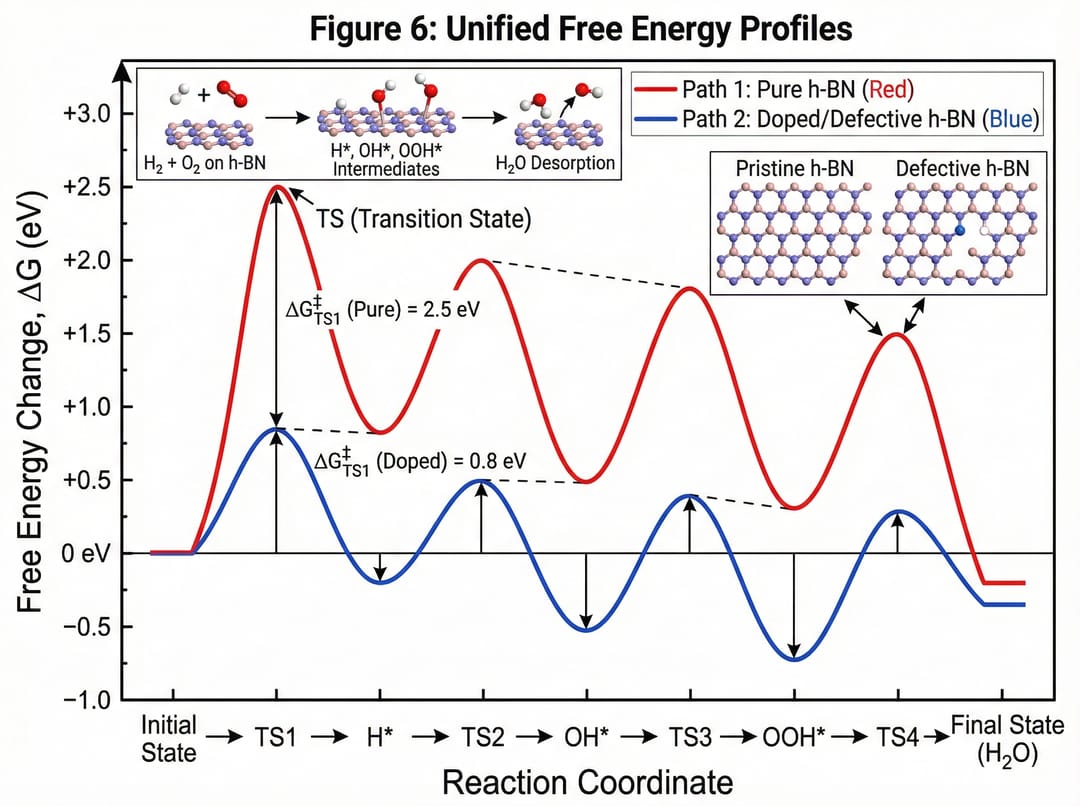 Unified free energy profiles comparing pure h-BN and doped catalyst pathways
Molecular Structure and Orbital Visualizations
Atomic Orbital Energy Levels
Color scientific illustration of Pauling's
approximate atomic orbital energy level diagram.
White background for clarity.
Clearly differentiate energy levels for
1s, 2s, 2p, 3s, 3p, 4s, 3d, 4p, 5s, 4d, 5p orbitals.
Show electron filling order with arrows,
Madelung rule diagonal lines,
orbital degeneracy indicated by spacing.
General chemistry textbook style.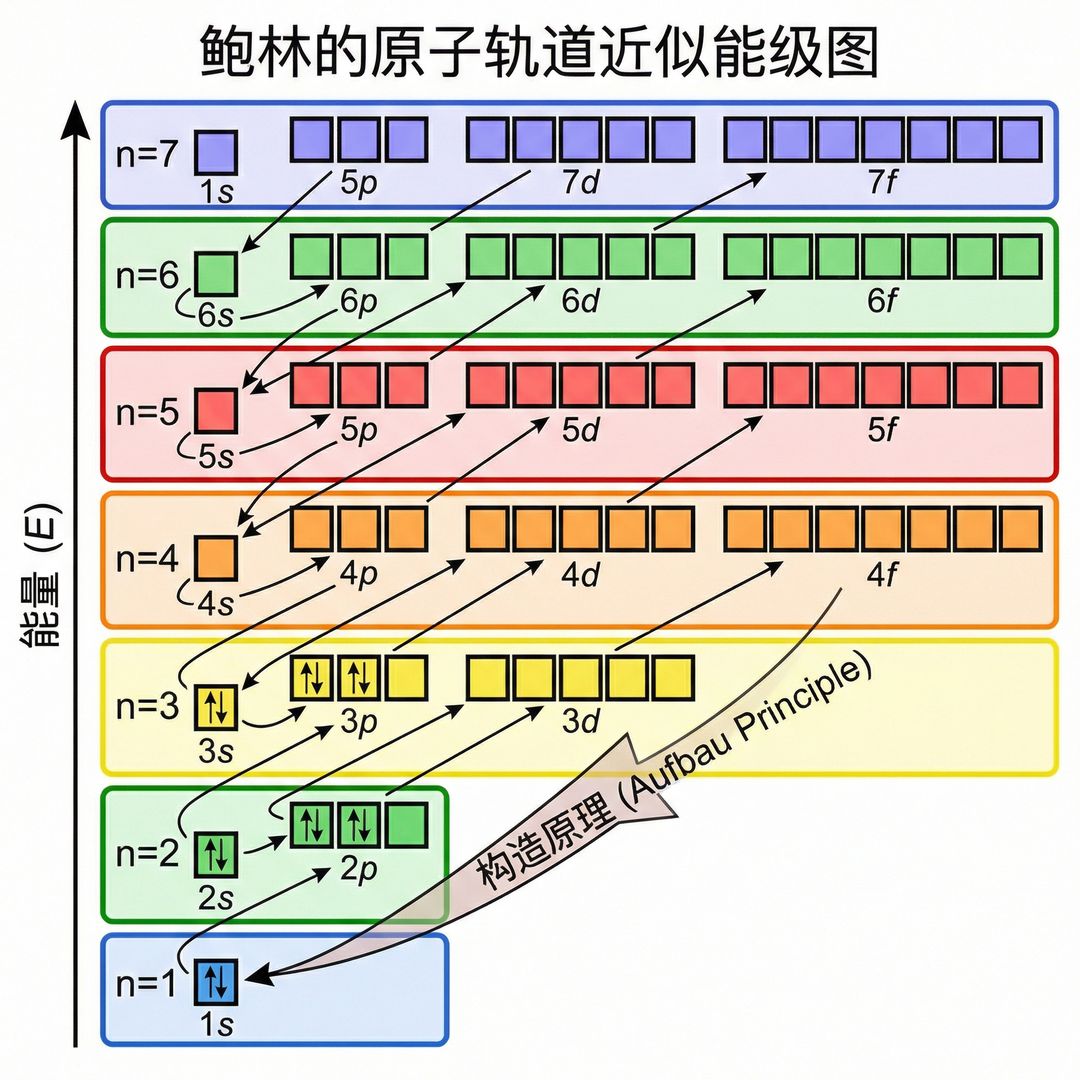 Pauling's atomic orbital energy level diagram with electron filling order
Organic Molecular Structure
Expanded structure of 2-methylbutane,
carbon atoms clearly highlighted and differentiated:
CH₃ (1°) | CH₃ (1°) - CH (3°) - CH₂ (2°) - CH₃ (1°).
Each carbon type color-coded:
primary (blue), secondary (green), tertiary (red).
Bond angles and hybridization labeled.
Organic chemistry textbook illustration style.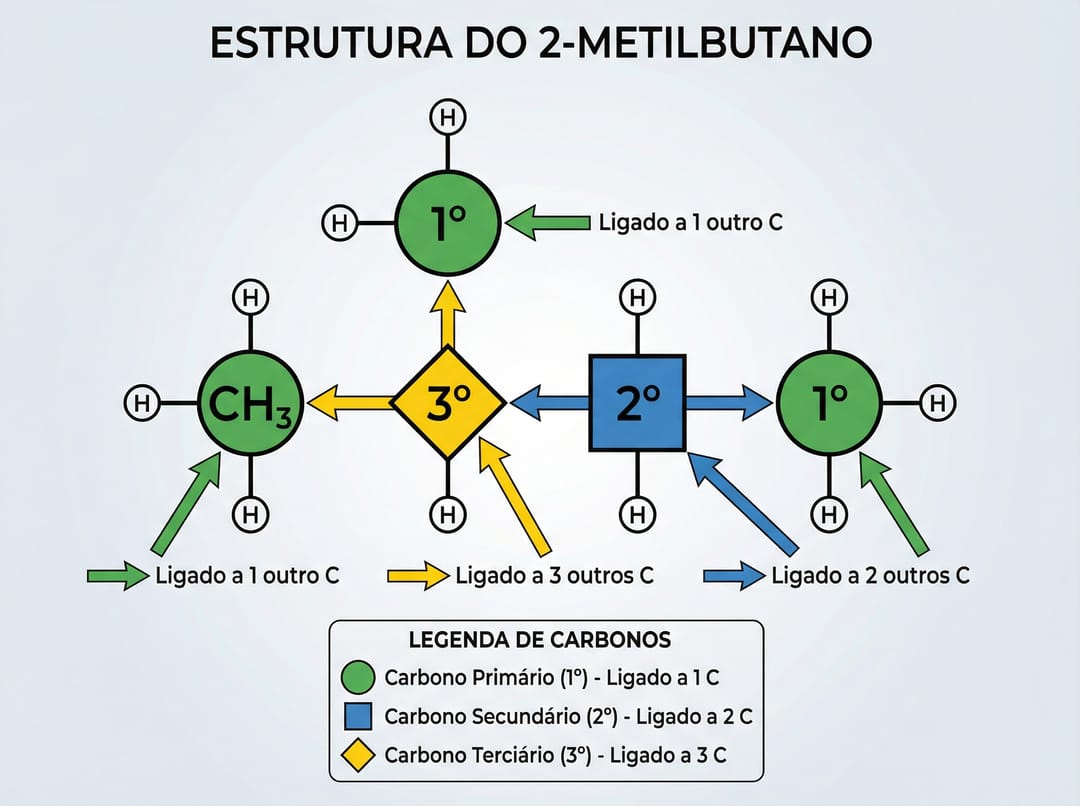 2-methylbutane with color-coded primary, secondary, and tertiary carbons
Supramolecular and Materials Chemistry
Host-Guest Complex Design
Generate image based on the following design concept:
Core Design Idea: α-CD + dynamic covalent amphiphiles,
emphasize the synergistic relationship
between cyclodextrin inclusion and dynamic covalent bonding.
Show host cavity encapsulating guest molecule,
reversible covalent bond formation at periphery,
self-assembly into vesicular structures.
Supramolecular chemistry journal style.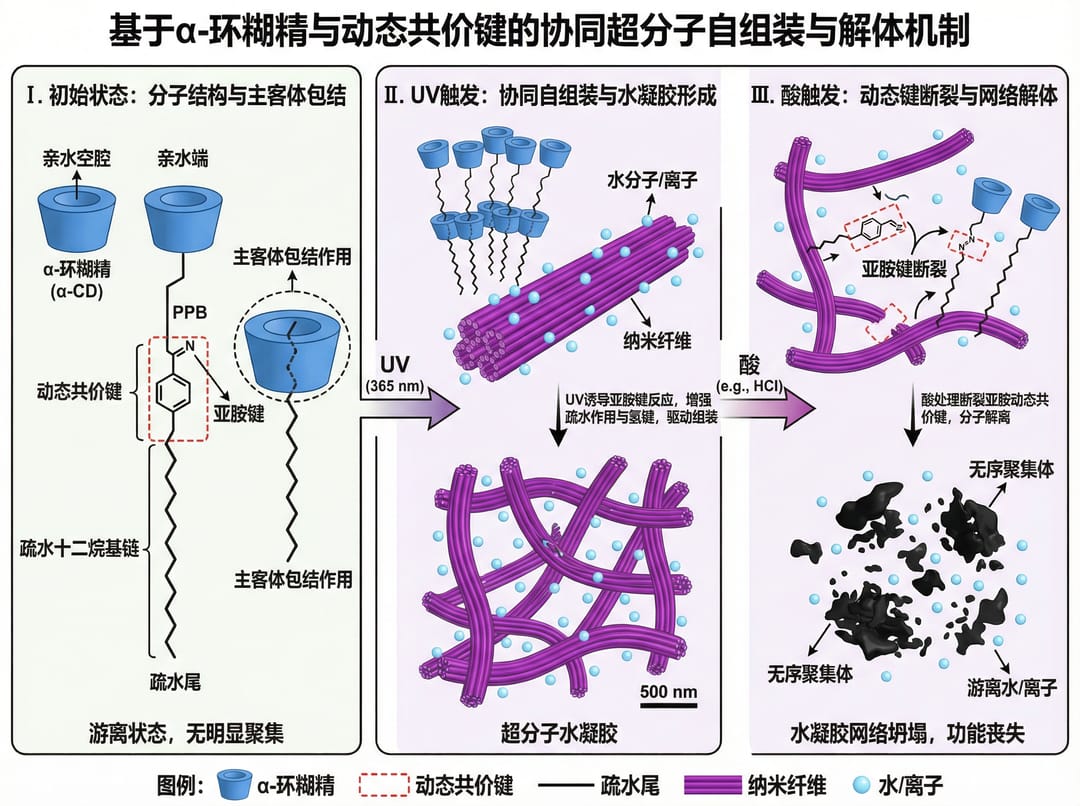 Cyclodextrin-based dynamic covalent amphiphile self-assembly
Photocatalysis Mechanism
Chemical structure of lignin and the photo-electron transfer
mechanism during photocatalysis of titanium dioxide (TiO₂).
Show TiO₂ band structure (valence band, conduction band),
UV light excitation generating electron-hole pairs,
electron transfer to lignin degradation products,
reactive oxygen species (ROS) generation pathway.
Physical chemistry / green chemistry journal style.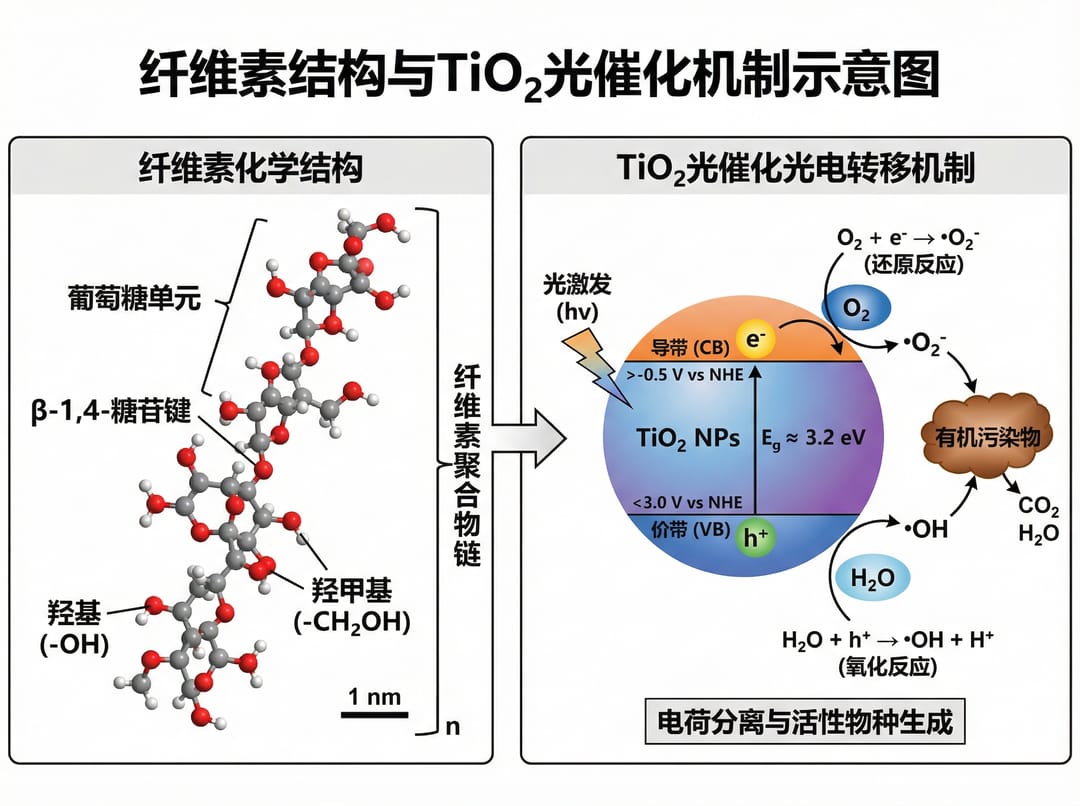 TiO₂ photocatalytic lignin degradation mechanism
Experimental Protocol Diagrams
Extraction and Characterization Workflows
Extraction of Water-Soluble Total Polysaccharides workflow.
Fenugreek seeds pulverized and passed through 40-mesh sieve.
Steps: defatting with petroleum ether →
hot water extraction at 90°C →
ethanol precipitation (4:1 ratio) →
dialysis and lyophilization →
characterization (FTIR, NMR, SEC-MALLS).
Sequential flowchart with icons at each step.
Analytical chemistry methods section style.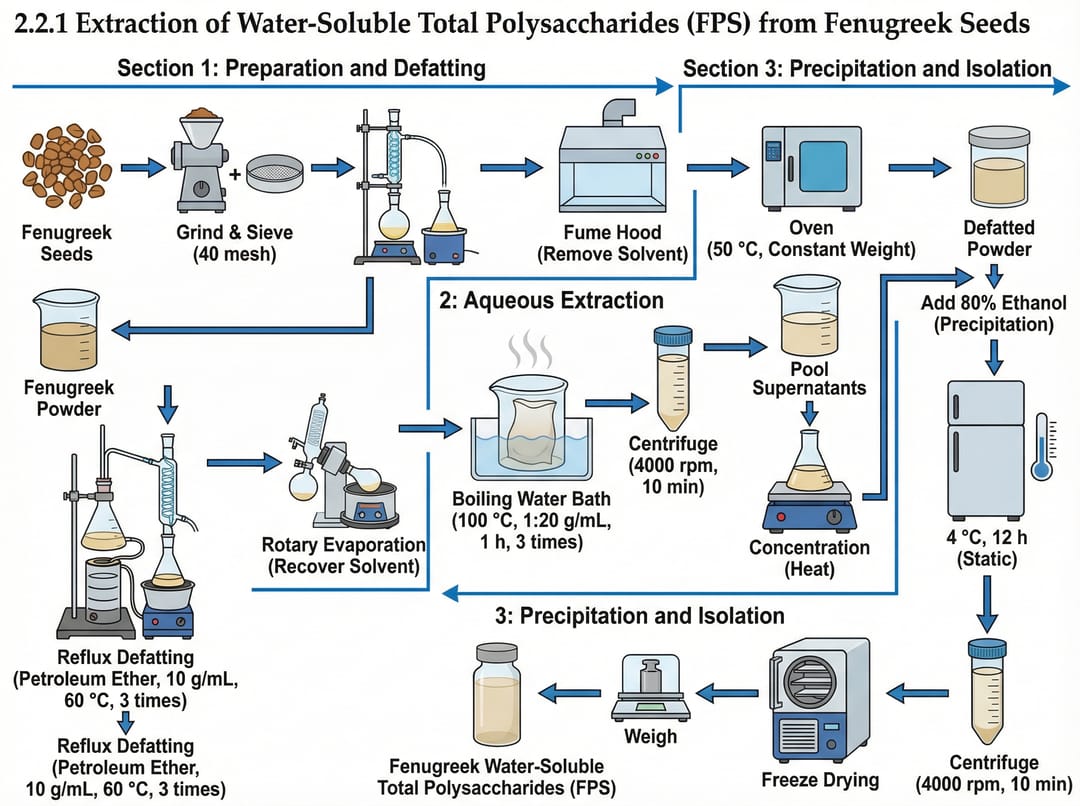 Fenugreek polysaccharide extraction and characterization workflow
Prompt Tips for Chemistry Illustrations
What Makes Chemistry Prompts Effective
Based on our analysis of 301 chemistry prompts, the most successful ones share these patterns:
| Element | Frequency | Example |
|---|---|---|
| Specific reagents | 22% | "Ag₂O oxidant, MeOH solvent" |
| Reaction conditions | 15% | "80°C, 12h, Pd catalyst" |
| Yield/metrics | 11% | "92% yield", "η = 23.5%" |
| Journal reference | 14% | "ACS Nano style", "JACS format" |
| Mechanism arrows | 12% | "electron flow direction", "curved arrows" |
Common Bigrams in Chemistry Prompts
The most frequent two-word phrases reveal what researchers emphasize:
- "schematic diagram" (31 occurrences) — the preferred format
- "the reaction" (25) — central focus on reaction processes
- "resulting in" (20) — cause-and-effect reasoning
- "surface of" (17) — surface chemistry emphasis
- "to form" (14) — product formation descriptions
Start Creating Chemistry Illustrations
Ready to generate professional chemistry figures for your next paper?
- Visit SciDraw AI Drawing
- Select Mechanism Illustration or TOC Graphical Abstract template
- Include specific reagents, conditions, and structural details
- Generate and refine your publication-ready chemistry visuals
From electrocatalysis schematics to molecular orbital diagrams, AI helps you communicate chemistry with precision and clarity.
Related Guides
- Reaction Mechanism Figure Generator — create chemistry-specific reaction mechanism figures
- Chemistry Diagram Generator — create chemistry figures, TOC graphics, and molecular visuals
- Mechanism Figure Generator — create reaction mechanism and pathway diagrams with AI
- Schematic Diagram Generator — create apparatus and experimental schematics with AI
- Chemistry Diagram Prompts — 40 prompts for molecular visualization
- Chemistry TOC Graphics Examples — TOC templates for chemistry journals
- Materials Science Illustration Prompts — 35 prompts for materials research
- Scientific Figure Maker Tool — create chemistry figures online