Materials science publications require precise visualizations of crystal structures, mechanical properties, characterization techniques, and processing methods. This guide presents 35 proven AI prompts from real materials research, helping you create publication-ready diagrams for journals and presentations.
What you'll find in this guide:
- Structural engineering and construction materials prompts
- Surface characterization and wettability illustrations
- Nanomaterial synthesis and processing diagrams
- Mechanical testing and failure analysis visualizations
1. Structural Engineering Materials
1.1 Seismic Design Systems
Prompt: Structural Wall Systems (EC8 Standards)
Technical infographic on buildings with structural wall systems according to
EC8-1/2004 updated to 2026. Illustrate the following:
- Reinforced concrete shear wall configuration
- Lateral load distribution paths
- Ductility class requirements (DCM, DCH)
- Connection details at wall-slab interfaces
- Seismic force reduction factors
Use a professional engineering diagram style with section views.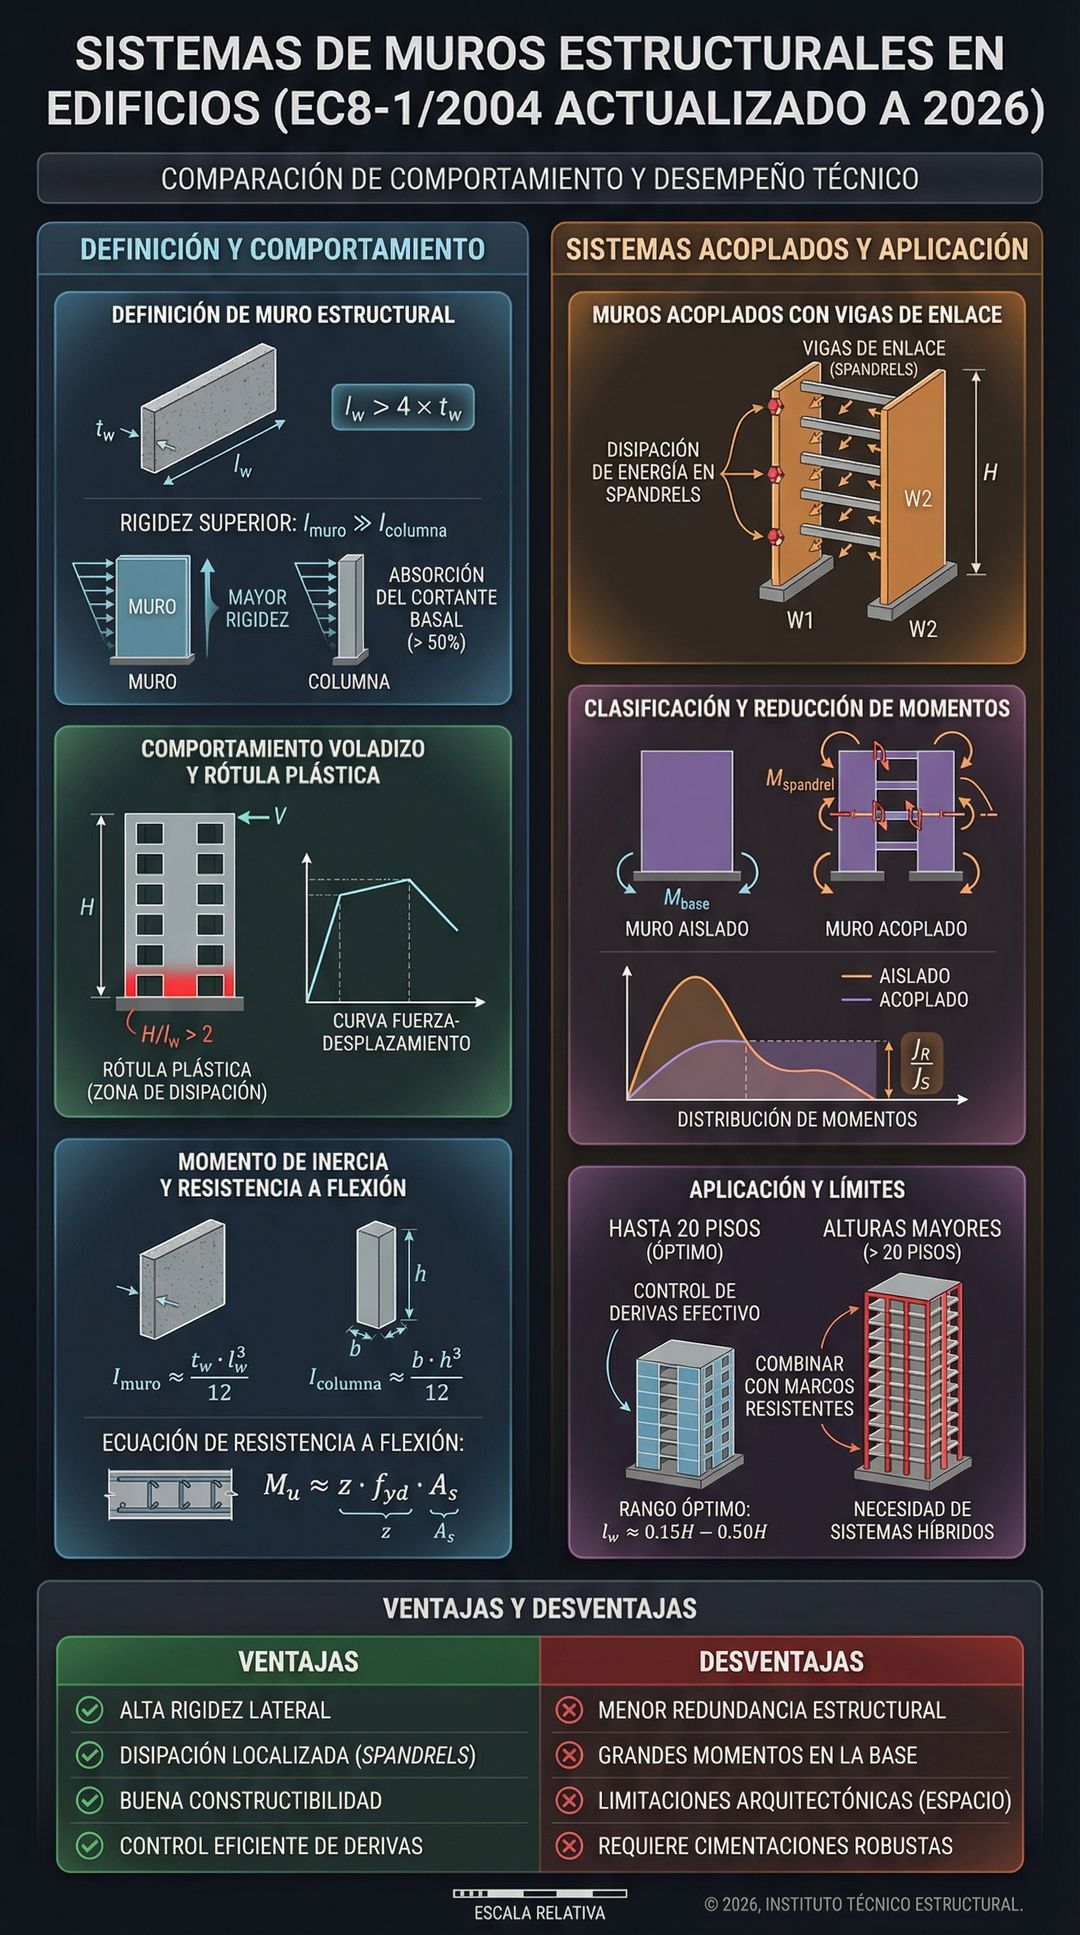
Prompt: Dual Structural Systems
Technical infographic on buildings with dual systems according to EC8-1/2004.
Illustrate the combination of structural walls and moment-resisting frames:
- Wall contribution to lateral resistance (>50%)
- Frame contribution to lateral resistance
- Interaction between systems
- Load path diagrams
- Typical floor plan layouts
Include Eurocode compliance annotations.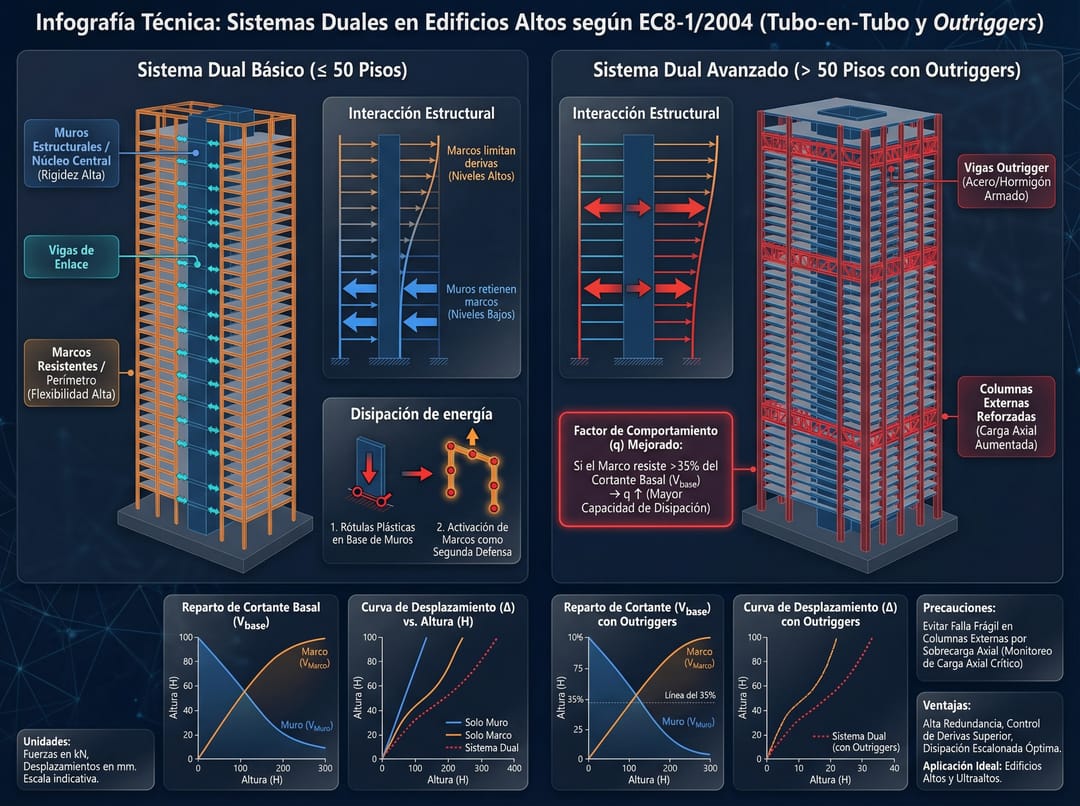
1.2 Advanced Building Systems
Prompt: Flat Slab and Shear Wall Combination
Technical infographic detailing building designs incorporating flat slab systems,
shear walls, and moment-resisting frames. Show:
- Flat slab punching shear reinforcement details
- Shear wall placement optimization
- Column-slab connection behavior
- Progressive collapse resistance measures
- Construction sequence considerations
Use WinUI3 style clean graphics with annotation callouts.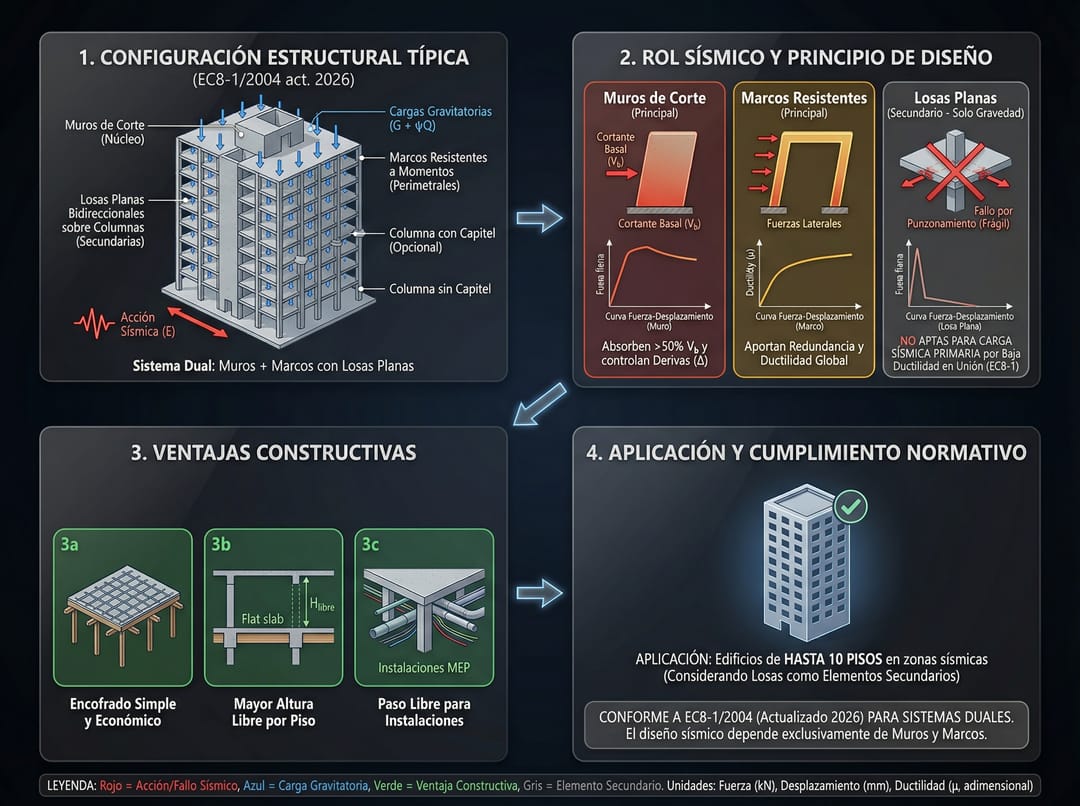
2. Surface Science and Characterization
2.1 Contact Angle Measurements
Prompt: Droplet Formation on Glass Substrate
Illustrate the formation of a liquid droplet on a glass substrate, explaining
the principles of contact angle measurement:
- Young's equation diagram with force vectors
- Sessile drop geometry
- Advancing and receding contact angles
- Hysteresis visualization
- Measurement technique (goniometer setup)
Include mathematical notation for surface energies.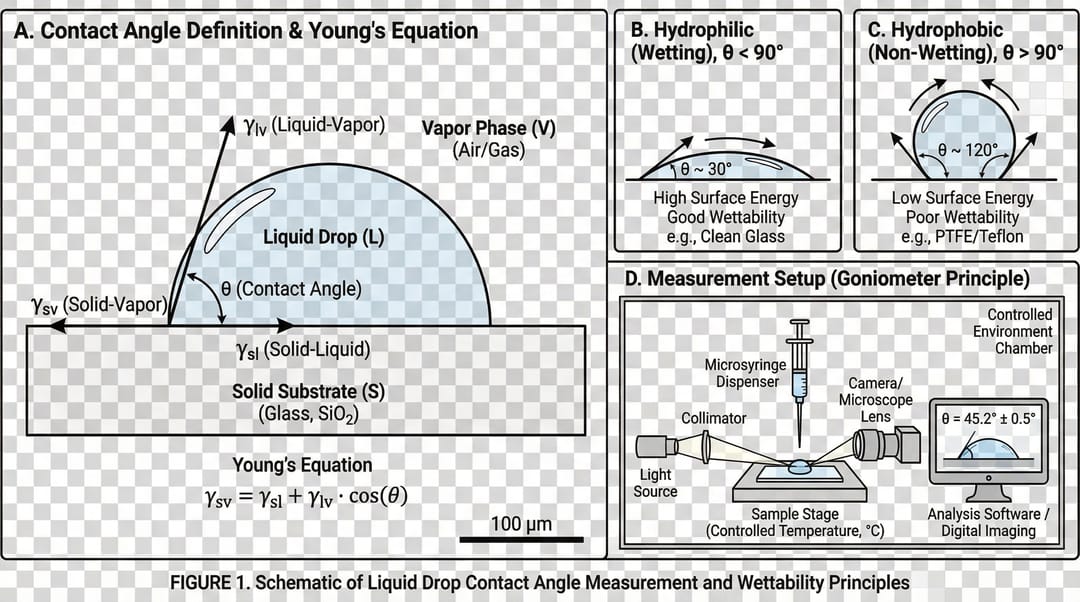
Prompt: Organic Film Wettability
Draw a figure illustrating a droplet on a glass substrate containing an organic
film. The droplet is used to measure the contact angle to assess the organic
film's surface properties. Show:
- Substrate layered structure (glass + organic coating)
- Water droplet with contact angle marked
- Surface energy components (polar, dispersive)
- Comparison of hydrophilic vs hydrophobic surfaces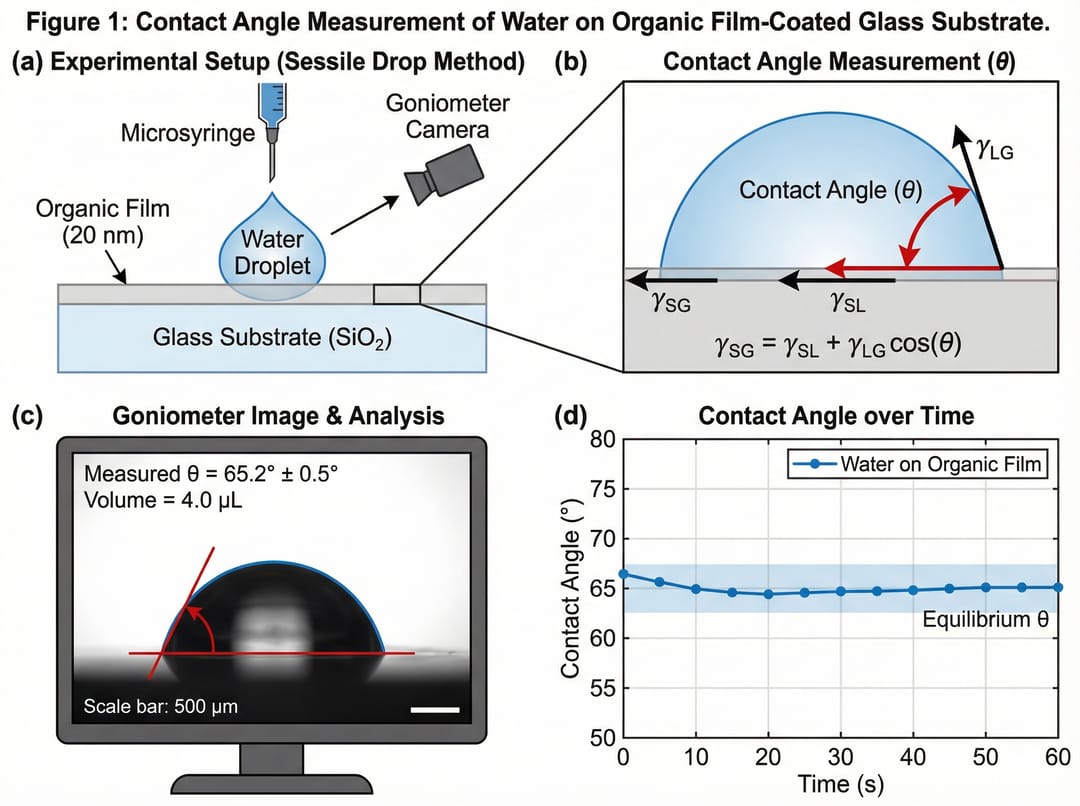
3. Nanomaterials and Advanced Processing
3.1 Aerogel Synthesis
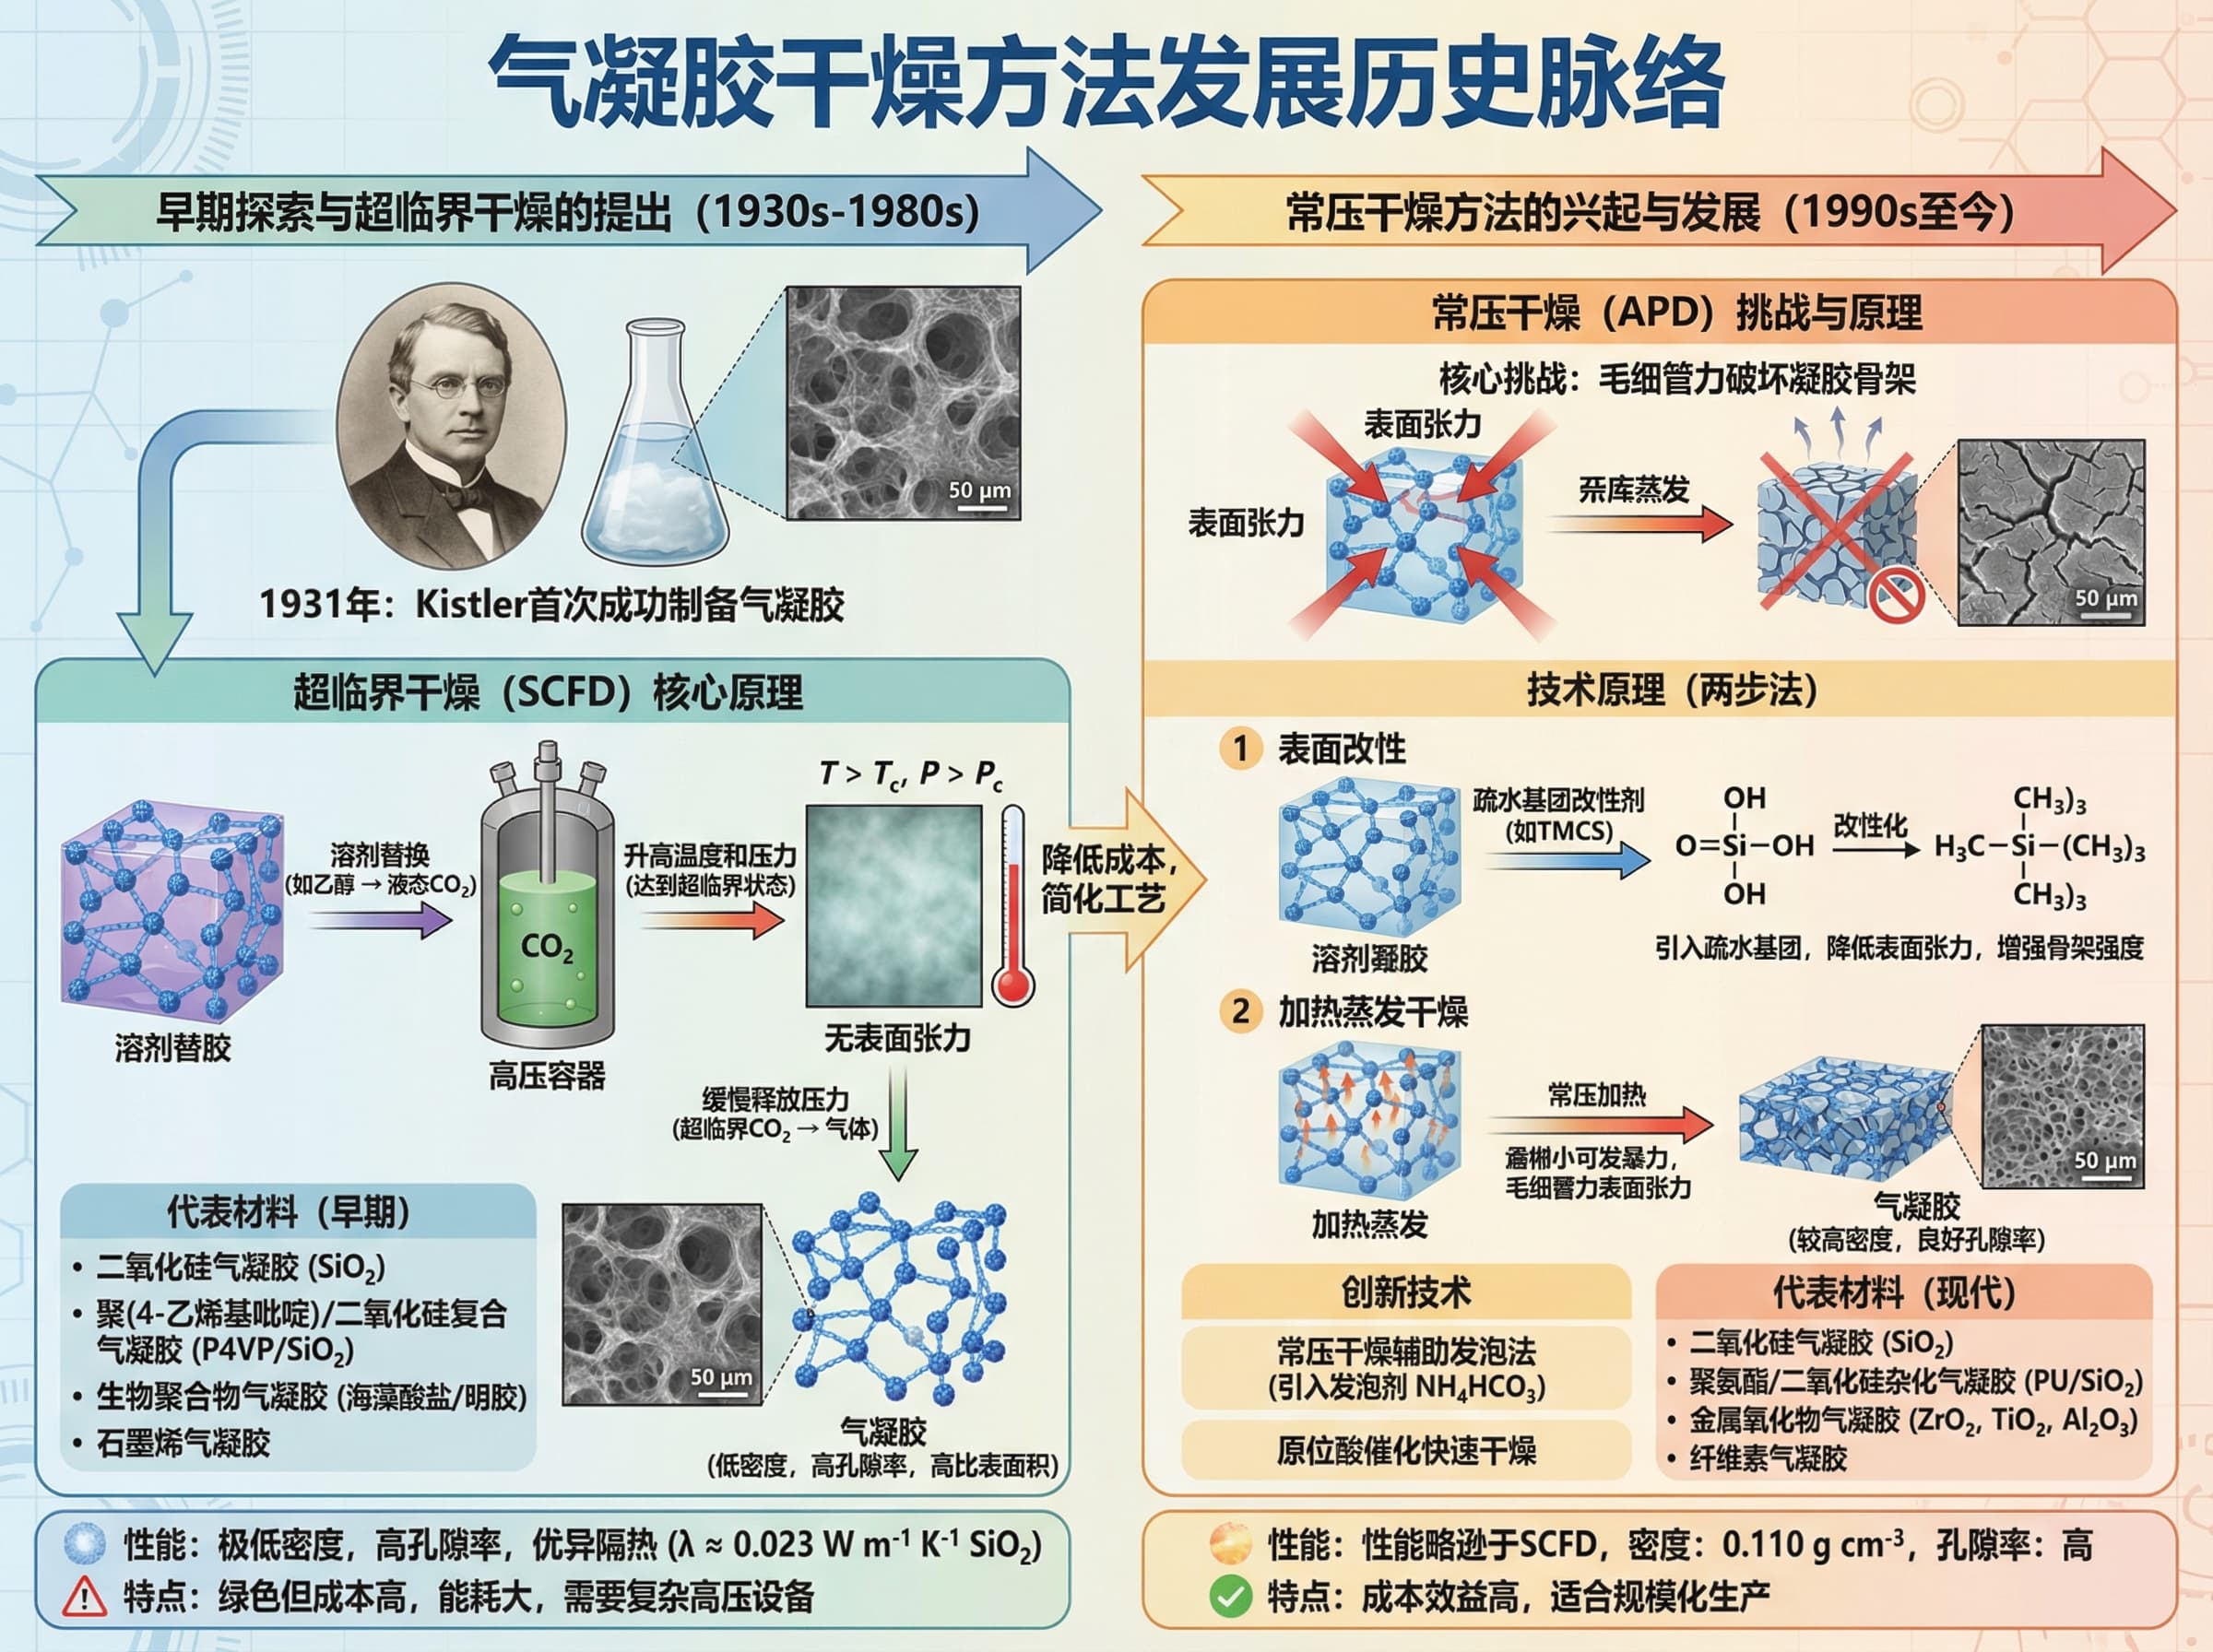
Prompt: Historical Development of Aerogel Drying Methods
Historical Development of Aerogel Drying Methods

Create a timeline-style infographic showing:
- Early Exploration and the Introduction of Supercritical Drying (1930s)
- Development of ambient pressure drying techniques
- Freeze drying innovations
- Modern hybrid approaches
- Key researchers and breakthroughs at each stage
Include process diagrams for each drying method.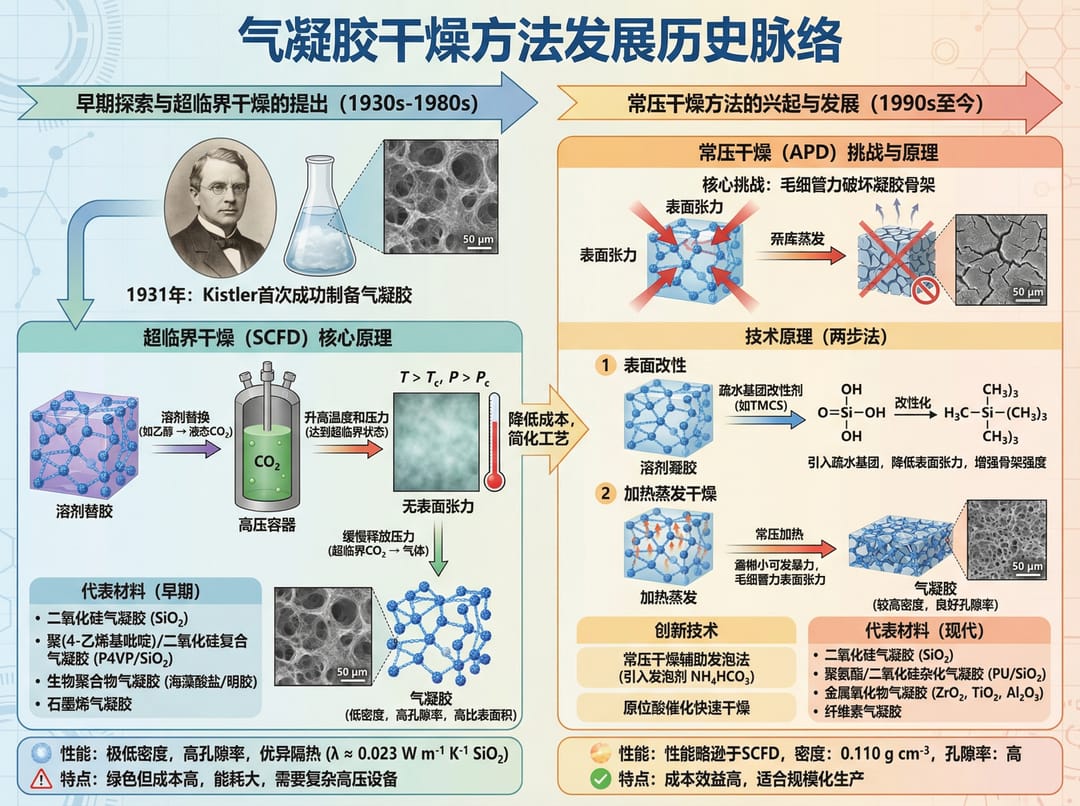
3.2 Multi-Panel Scientific Illustrations
Prompt: SCI Journal Multi-Panel Figure
This is a multi-panel scientific illustration suitable for an SCI journal,
presented in a clean 3D modeling style. Create:
- Panel A: Material synthesis schematic
- Panel B: Characterization results (XRD, SEM)
- Panel C: Performance testing setup
- Panel D: Comparison with benchmarks
Use consistent color scheme, clear panel labels (A, B, C, D), and
professional scientific illustration quality.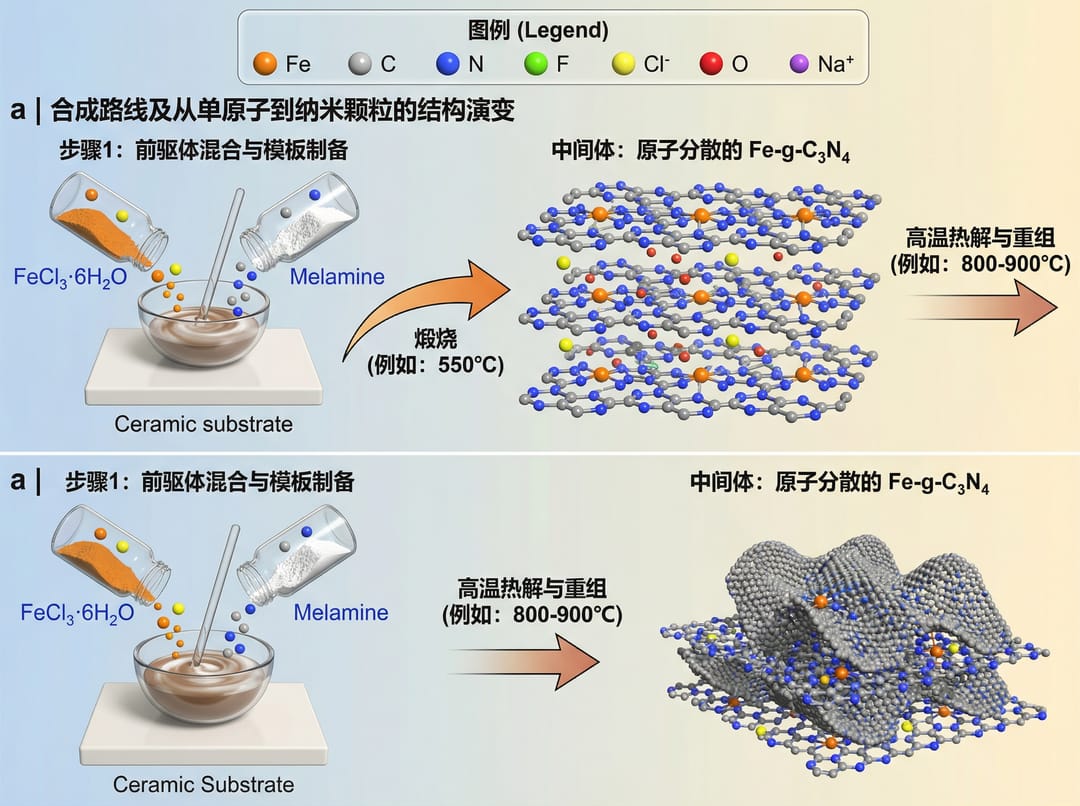
4. Mechanical Testing and Analysis
4.1 Fiber-Reinforced Composites
Prompt: Hybrid Fiber Concrete Ductility Study
I have conducted an analytical study using a MATLAB program to investigate
the ductility and failure patterns of a hybrid fiber reinforced concrete beam.
Create a figure showing:
- Beam cross-section with fiber distribution
- Load-deflection curve with key points labeled
- Crack pattern progression at different load levels
- Ductility index calculation visualization
- Comparison between hybrid and mono-fiber systems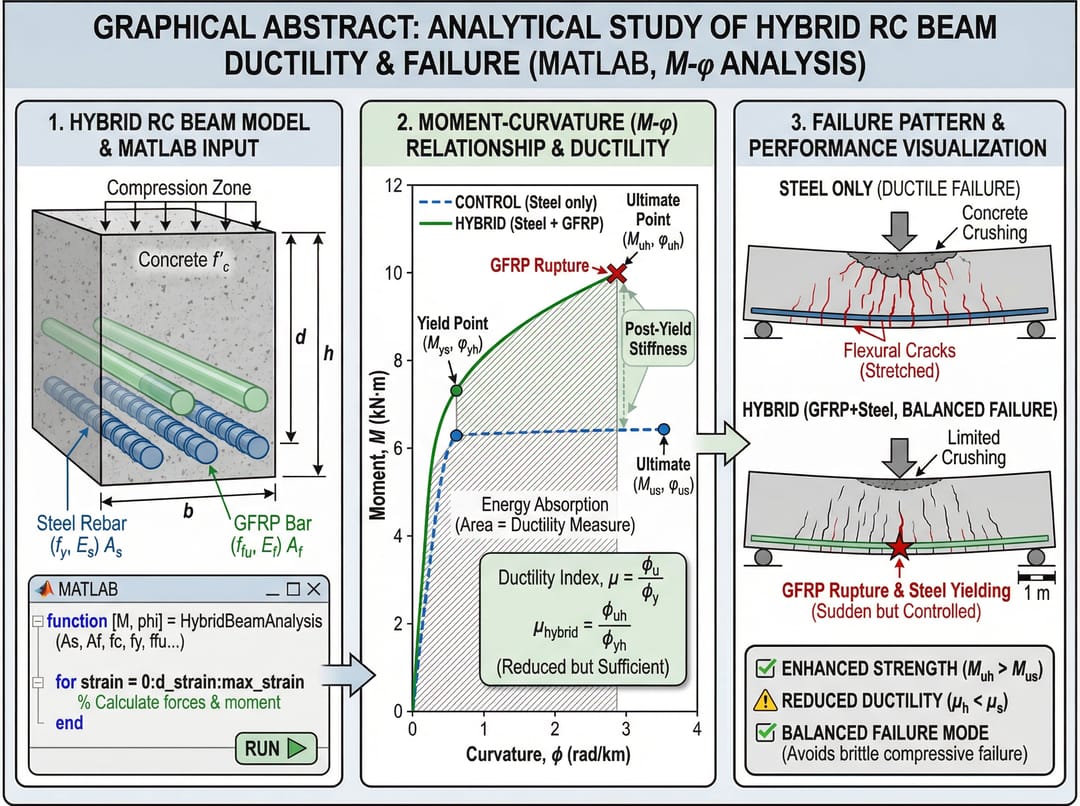
5. Best Practices for Materials Science Diagrams
Key Elements by Diagram Type
| Diagram Type | Essential Components |
|---|---|
| Structural Engineering | Load paths, reinforcement details, code references, dimensions |
| Surface Characterization | Scale bars, measurement geometry, surface energy notation |
| Nanomaterials | Size distributions, synthesis conditions, TEM/SEM scale |
| Mechanical Testing | Specimen geometry, loading conditions, failure modes |
Materials Science Prompt Tips
- Include Scale Information: Critical for nano/micro scale illustrations
- Reference Standards: ASTM, ISO, Eurocode specifications
- Show Processing Conditions: Temperature, pressure, atmosphere
- Indicate Material Phases: Crystal structure, grain boundaries
- Label Characterization Techniques: XRD, SEM, TEM, AFM
Start Creating Your Materials Science Diagrams
Try these prompts with SciDraw AI's AI illustration tools:
Related Guides
- Materials Science Figure Generator — create materials science diagrams and characterization schematics with AI
- Chemistry Reaction Mechanism Guide — reactions and electrocatalysis
- Chemistry Diagram Prompts — 40 prompts for molecular visualization
- 8 AI Prompt Rules for Scientific Figures — prompt techniques for materials visuals
- Scientific Figure Maker Tool — create materials figures online