AI Character Relationship Map & Chart Generator
From cast list to labeled relationship map for novels, plays, history and screen
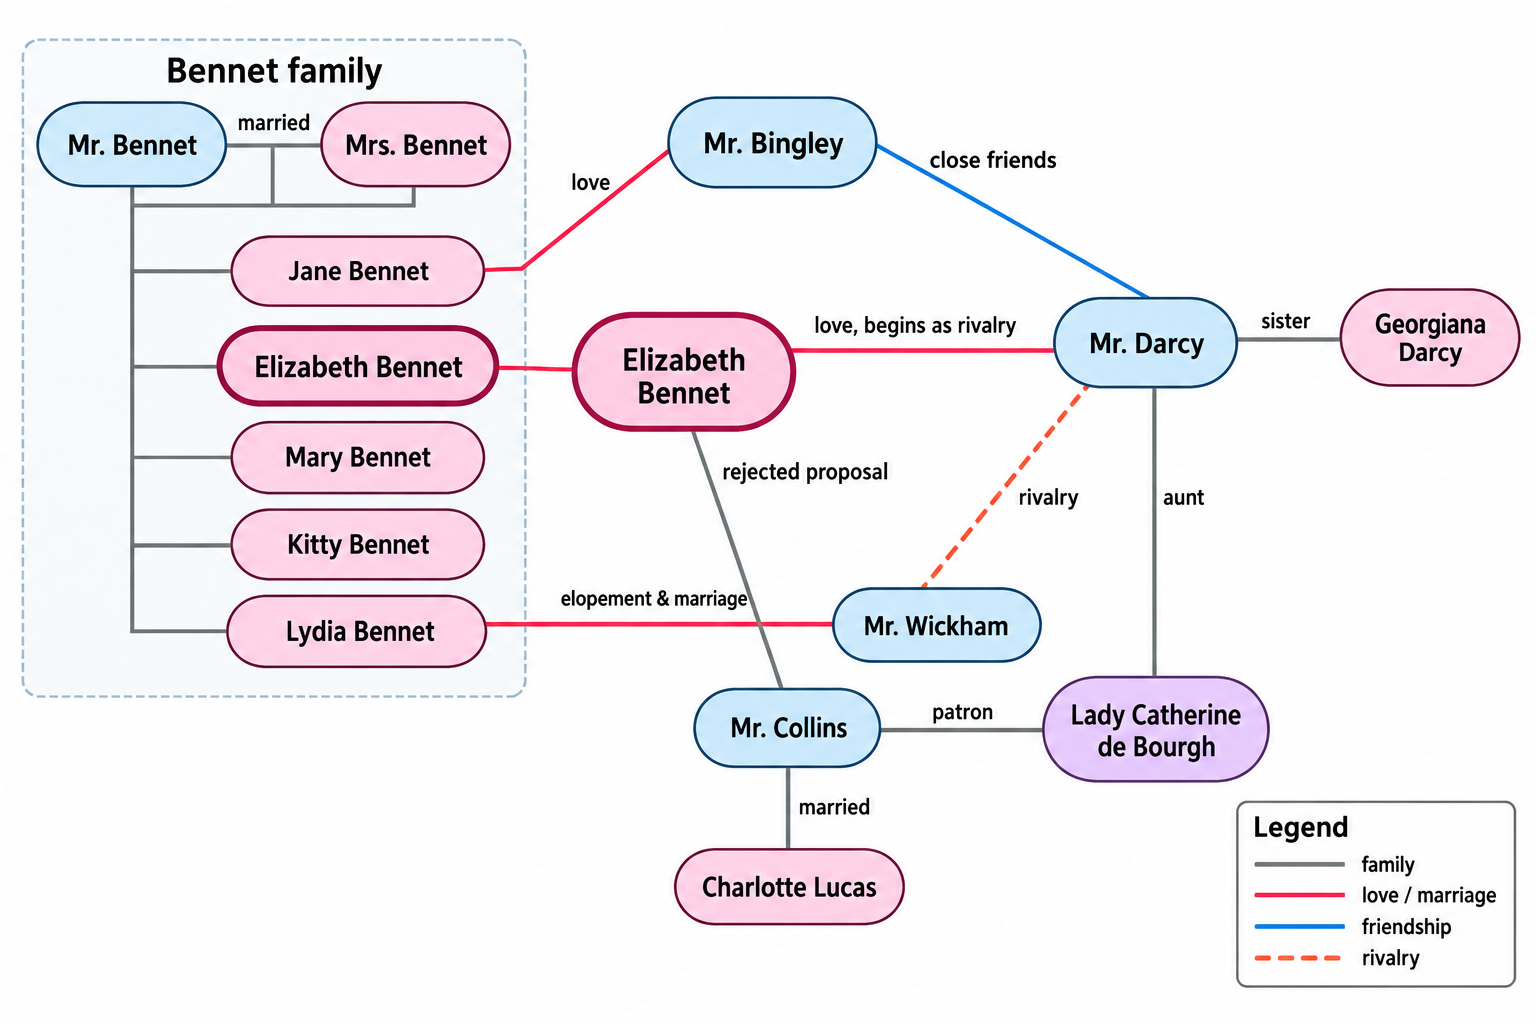
List your characters and how they relate, and SciDraw AI draws a clear relationship map with a distinct line style for every relationship type and a legend to match. Built for literature and history theses, film and media studies, teaching handouts, and planning the cast of your own story.
Character Relationship Map Examples
Browse relationship charts from novels, drama, history and original worlds, or generate your own above.
What does this character relationship map generator do?
This character relationship map generator turns a plain list of characters and relationships into a labeled relationship chart. You name each character with a role, then state who relates to whom, what the relationship is (family, marriage, love, friendship, mentorship, service, alliance, rivalry, betrayal) and, where it matters, its direction and the stage of the story or the year. SciDraw AI draws every character as a labeled node, every relationship as a line or arrow with the type written on it, gives each relationship category its own line style, and adds a legend so the chart reads without explanation. Characters are grouped into families, factions, courts or time periods only when you ask. The generator does not read the book for you and never adds characters, ties or plot events you did not list; a relationship you mark as uncertain or rumored is drawn with a dashed line. The result works as an analytical figure for a literature or history thesis, a study handout, a media-studies presentation, or a planning chart for your own novel.
Why readers, students and writers need a character map
- Keep track of who is who in a long novel, a multi-season series or a crowded historical period
- Turn a chapter of relationship analysis into one figure a thesis reader can grasp at a glance
- Show how kinship, marriage and alliance shape the plot of a play, novel or dynasty
- Spot missing links, unexplained ties and overloaded characters while planning your own cast
- Give students a clear study aid for exams and seminar discussion
How to make a character relationship chart
Start by listing every character who matters, each with a short role or title: protagonist, narrator, king, apprentice. Next, define your relationship types before you write the ties, so that family, marriage, love, friendship, rivalry and service each get one consistent name. Then state each relationship as who–whom, its type, and its direction where it is one-sided, such as patron and client or unrequited love; add the act, chapter, season or year if a tie changes over time. Group characters by family, house, faction or court only if that grouping helps your argument, and name the groups. Finally, read the list back against the text and check for missing people or ties before generating. Paste the list into the generator, pick the mode that matches your material, and regenerate with corrections until the chart matches your reading.
Common elements in a character relationship map
- Character nodes labeled with name and role, protagonist near the center
- Solid lines for kinship and marriage
- Distinct line styles for love, friendship, alliance and rivalry
- Arrows for one-directional ties such as mentorship, service or patronage
- Dashed lines for uncertain, rumored or disputed relationships
- A legend, plus optional family or faction groupings and stage labels
Frequently Asked Questions
Can SciDraw AI read my novel and build the character map for me?
No. The generator draws only what you give it. You list the characters with their roles and state each relationship yourself, which is also what makes the chart defensible in a thesis: every line traces back to a passage you chose. For a long novel, build the list chapter by chapter, then paste the finished list into the generator.
Can I use the chart in a literature or history thesis?
Yes. Use it as an analytical figure that summarizes relationships you have established from the text or the sources, and give it a caption that cites those sources for each tie, especially disputed historical ones. Check names, dates and titles against your primary texts before submission, since the chart reflects your list, not an external database.
What about copyright when I map characters from a published book or series?
Mapping character names and relationships for analysis, study notes, teaching or criticism is standard scholarly practice, and the chart is your own diagram of those facts. Charts of your own original characters are entirely yours. If you plan to publish a chart of someone else's work commercially, check the rules of the publisher or platform you are using.
What does the generator not do?
It does not invent characters, relationships or plot events, does not fill gaps with guesses, and does not add spoilers beyond what you write. Anything you mark as uncertain, rumored or disputed is drawn as a dashed line rather than a solid claim. If a character is missing from the chart, they are missing from your list; add them and regenerate.
How do I edit or regenerate the map?
Edit your character list and generate again; small changes such as renaming a tie, adding a stage label or moving someone to another faction usually need only one more run. For layout tweaks, open the result in the editor to move nodes, adjust labels and colors, and fix line routing by hand.
What formats can I export?
Each result can be downloaded as a PNG image, ready for a thesis, slide deck or study handout. You can also open the map in the editor to keep adjusting it there. If a journal or department requires a specific figure size, generate at the aspect ratio you need and check the exported PNG against the requirement.
Explore More Tools
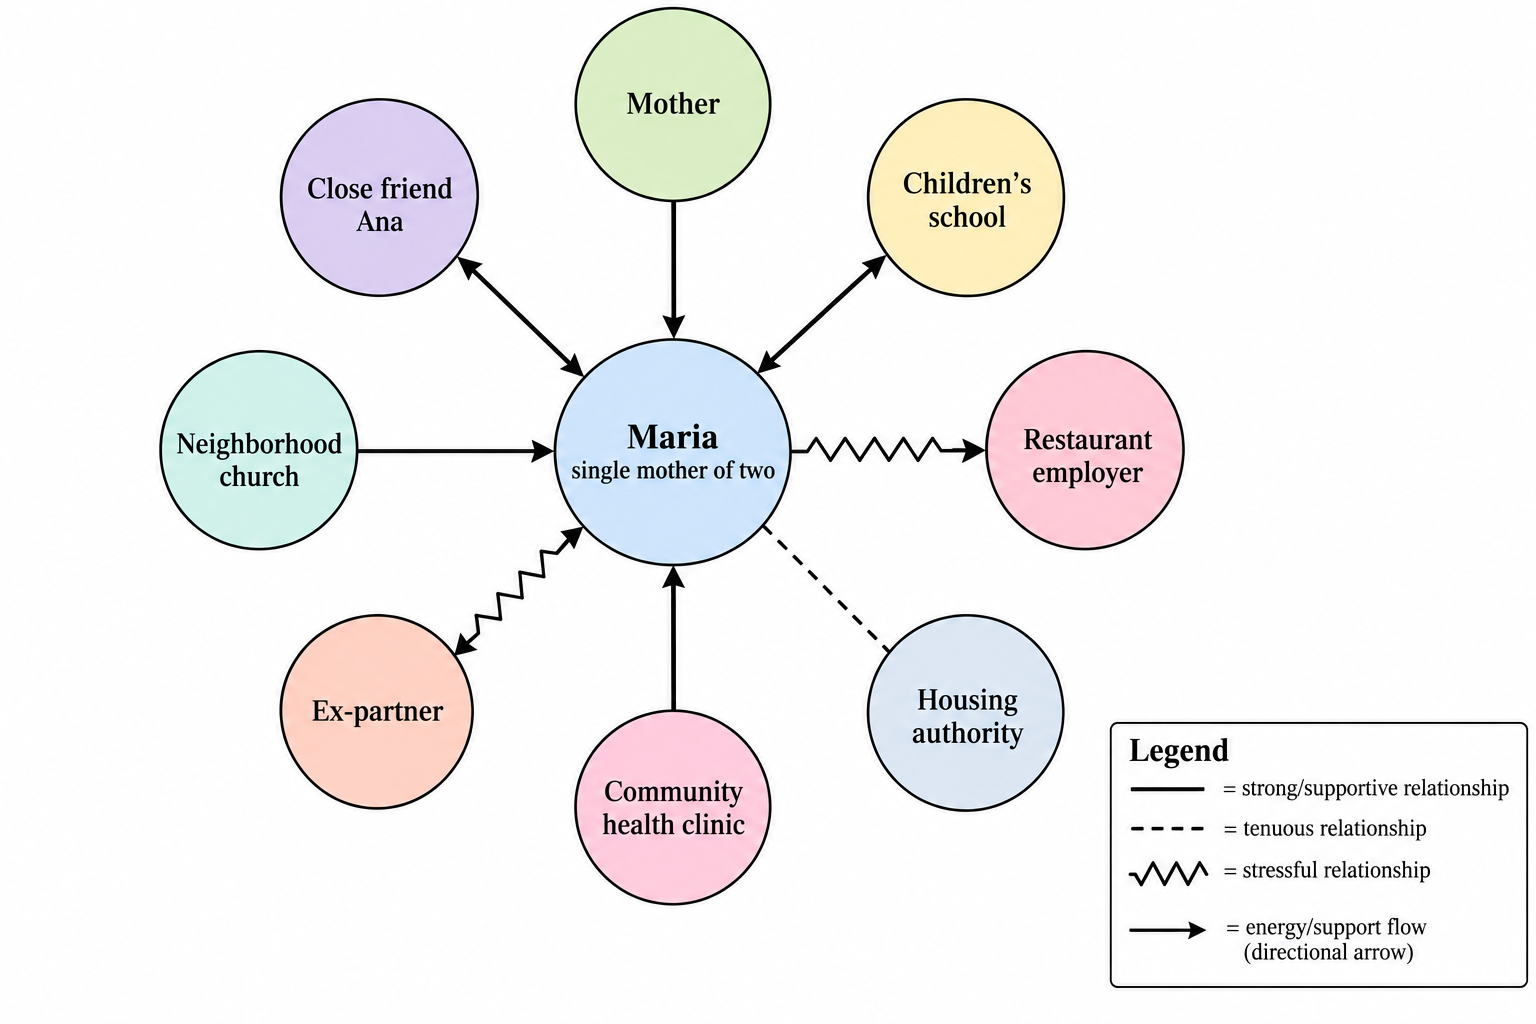
Ecomap Maker
Turn a case description into a labeled ecomap with standard solid, dashed and jagged lines, direction arrows and a legend.
Try it free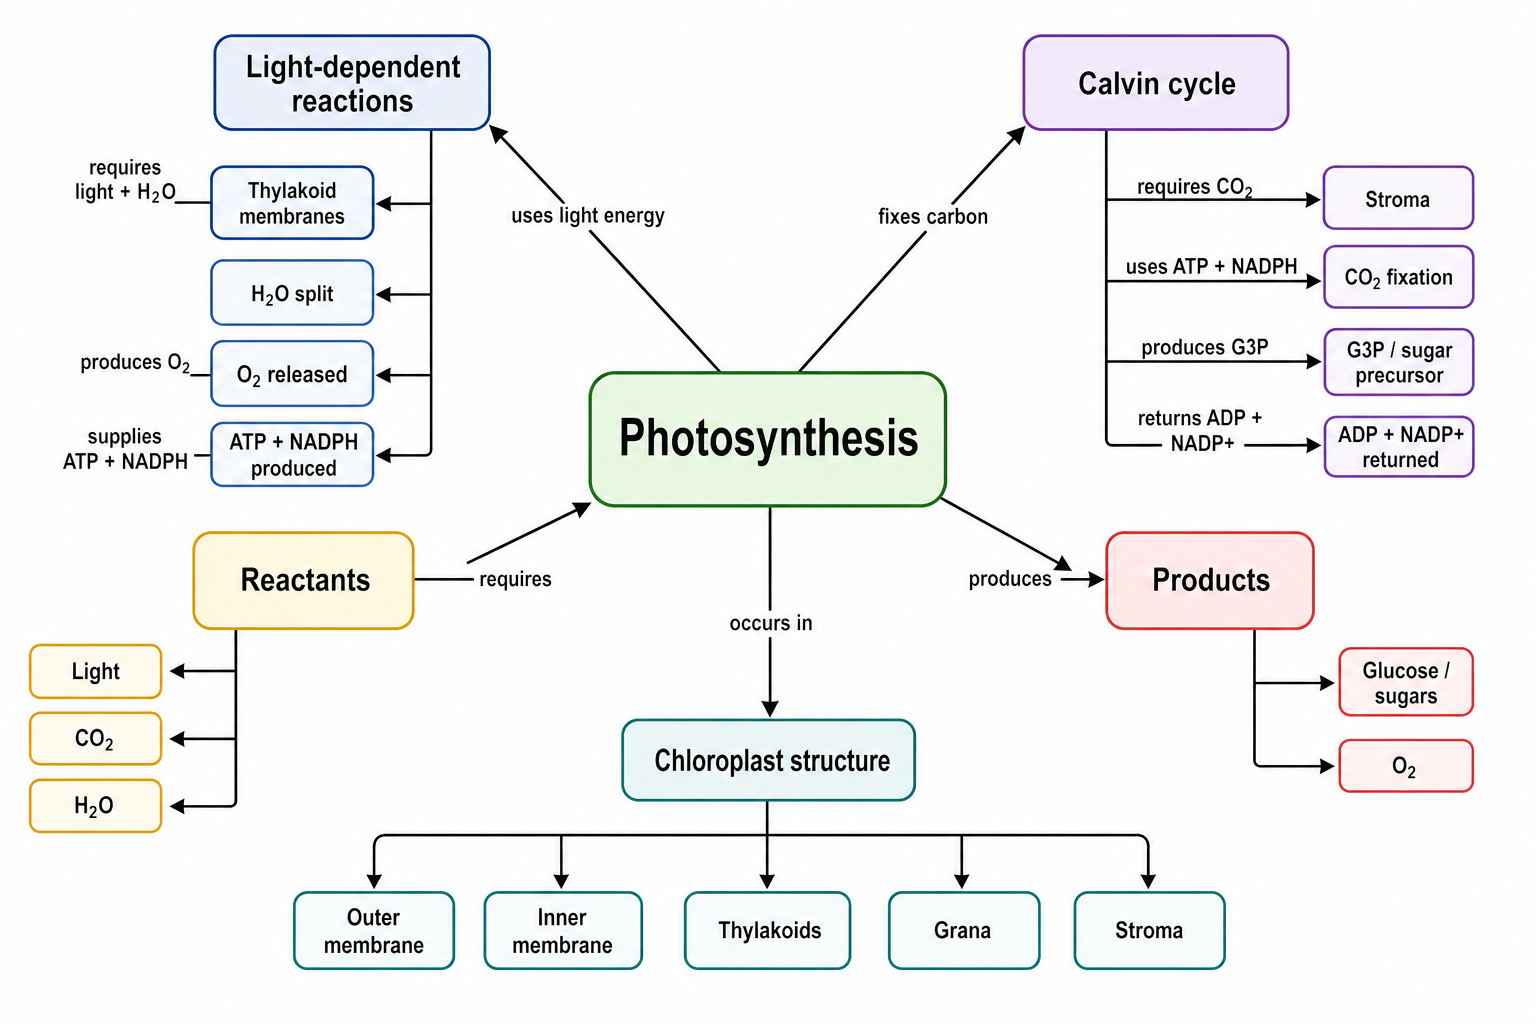
Concept Map Generator
Turn a science topic into a labeled concept map showing concepts and their relationships.
Try it free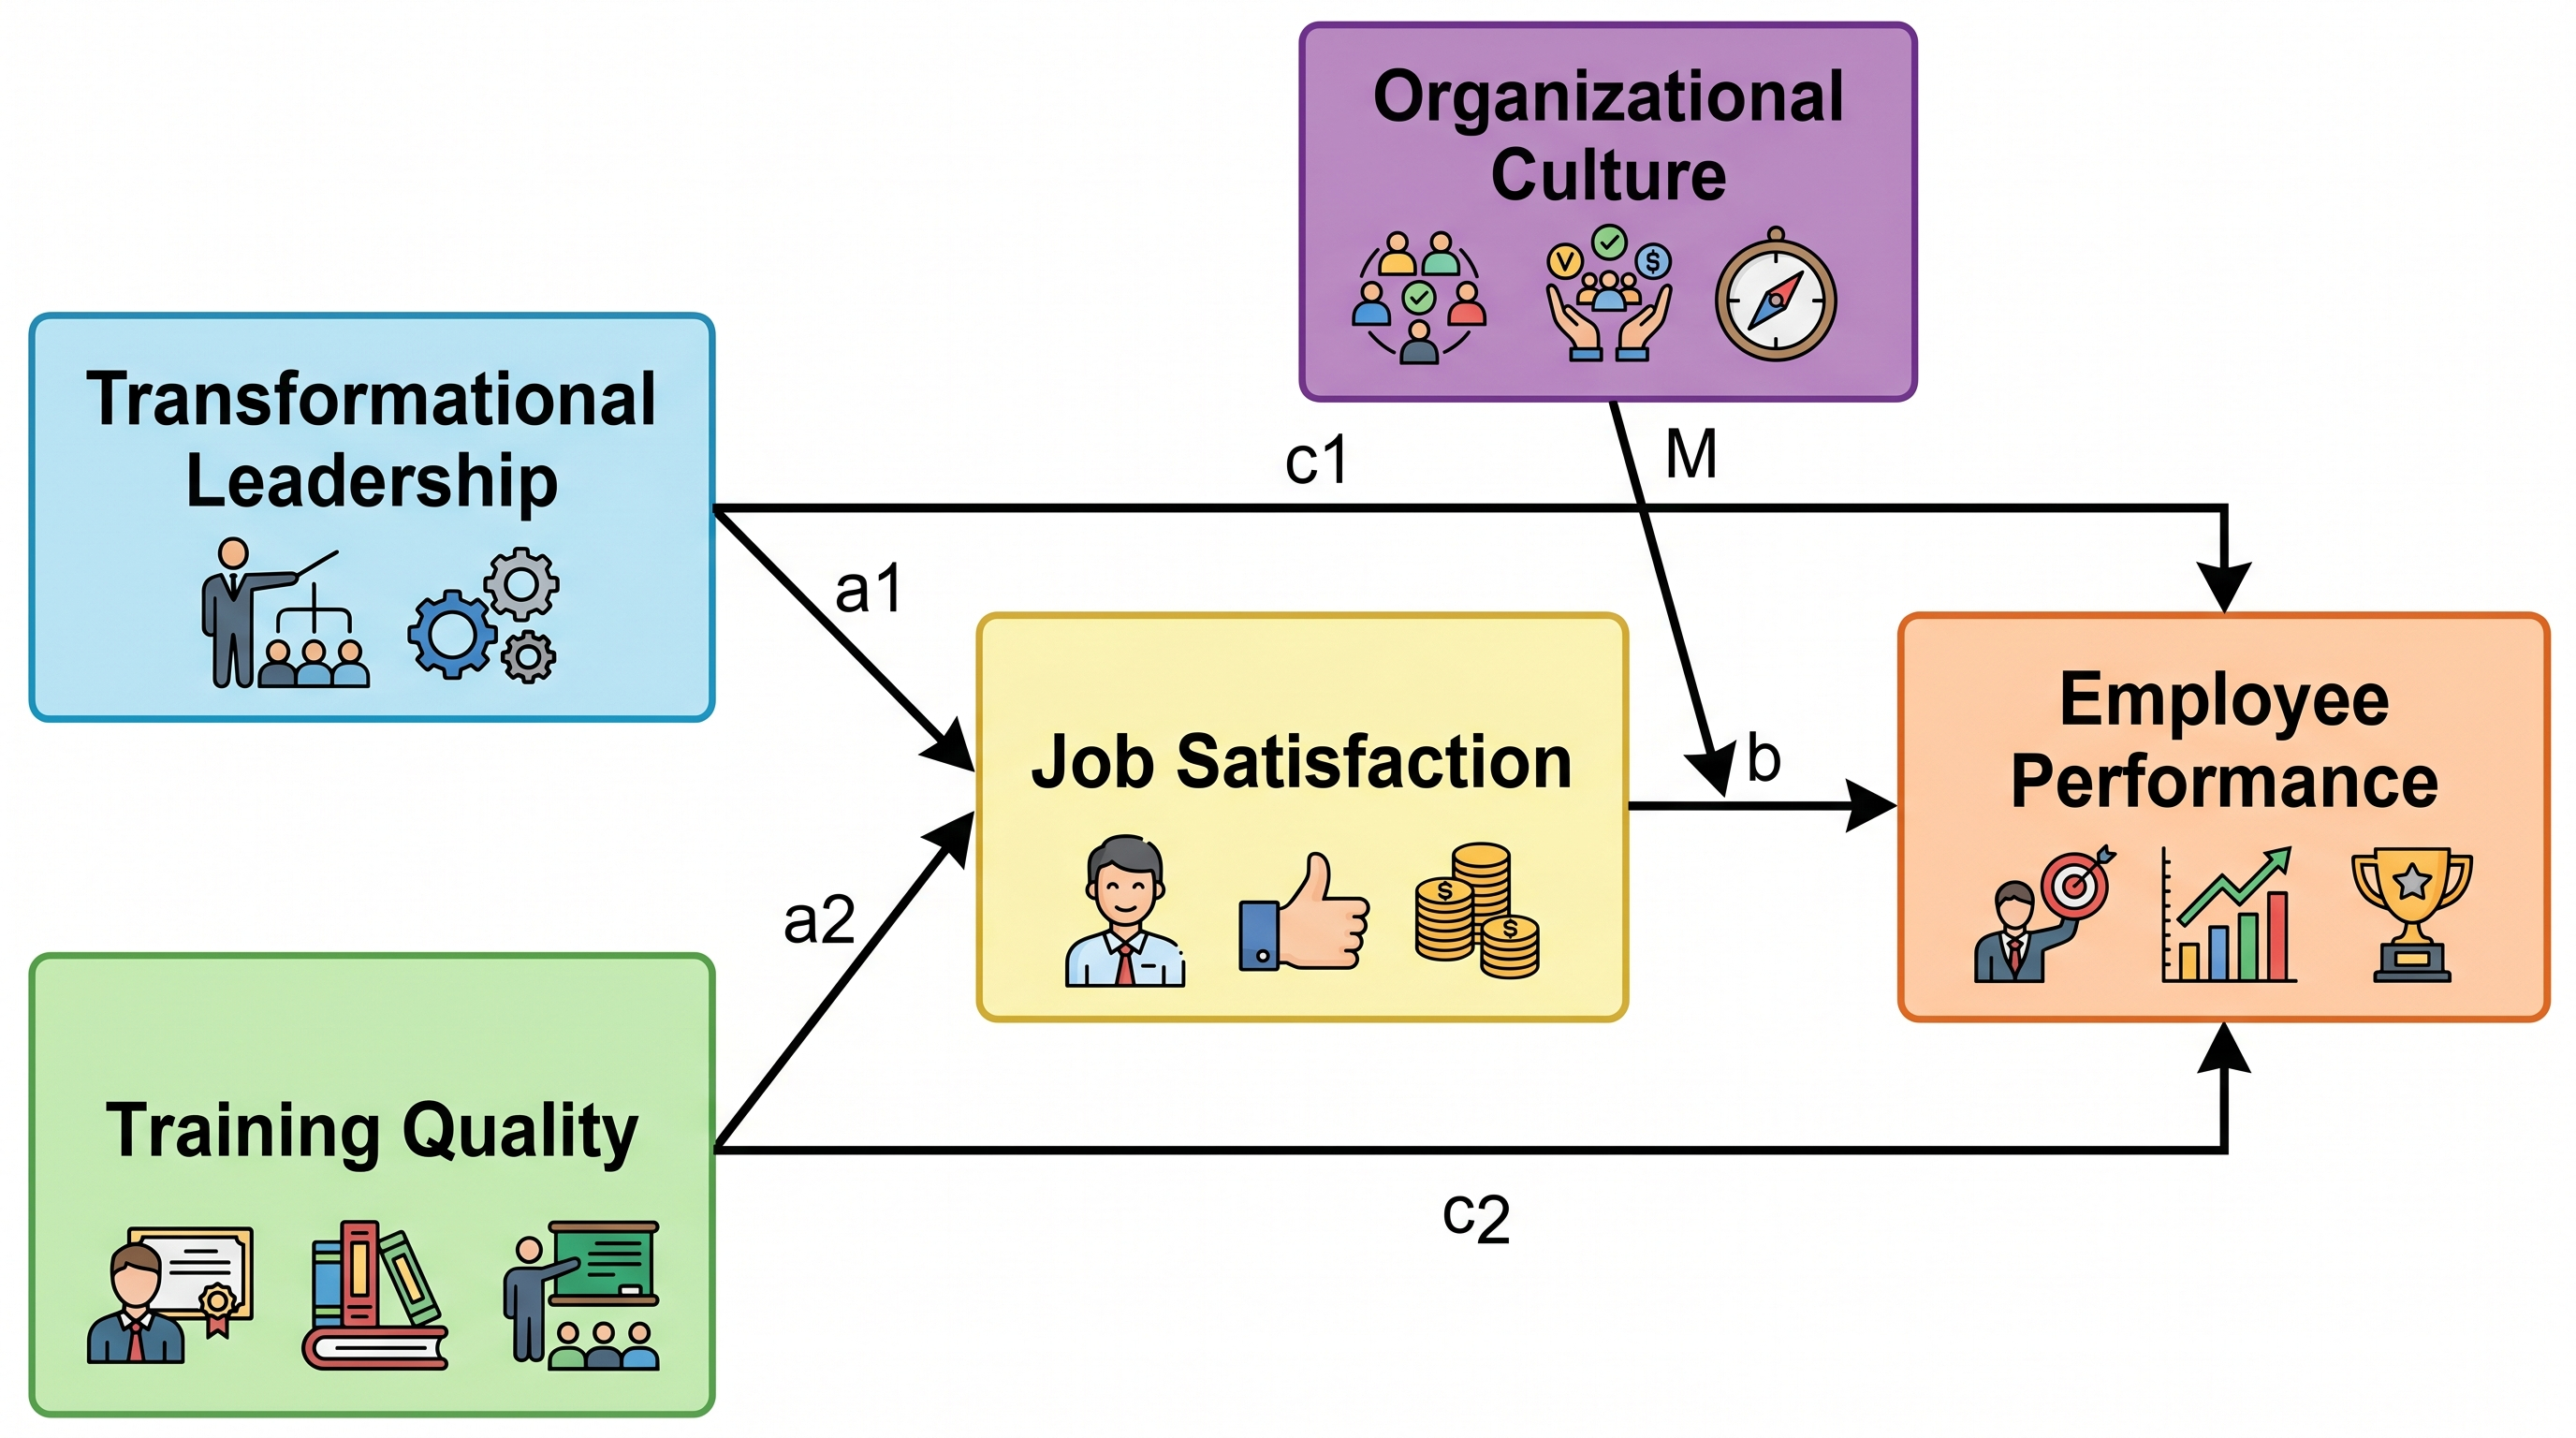
Conceptual Framework Maker
Generate labeled research framework diagrams with variables and relationships
Try it freeMap your cast now
List the characters and relationships you already know, and get a labeled relationship chart with a legend in seconds. Free to try.