💡 SciDraw AI Graphical Abstract Maker: describe your review's topic, categories and conclusion in a paragraph and get a first draft you can keep editing. Generate a graphical abstract →
The review is twelve thousand words long with two hundred references, and the only comment from your supervisor is "too few figures, start with an overview".
Review figures do not show your own data. They condense many papers into a structure a reader can take in at a glance. This guide covers each type: where it goes, a layout that works, common mistakes, and prompts to copy. For grant proposals, see the research grant illustration guide.
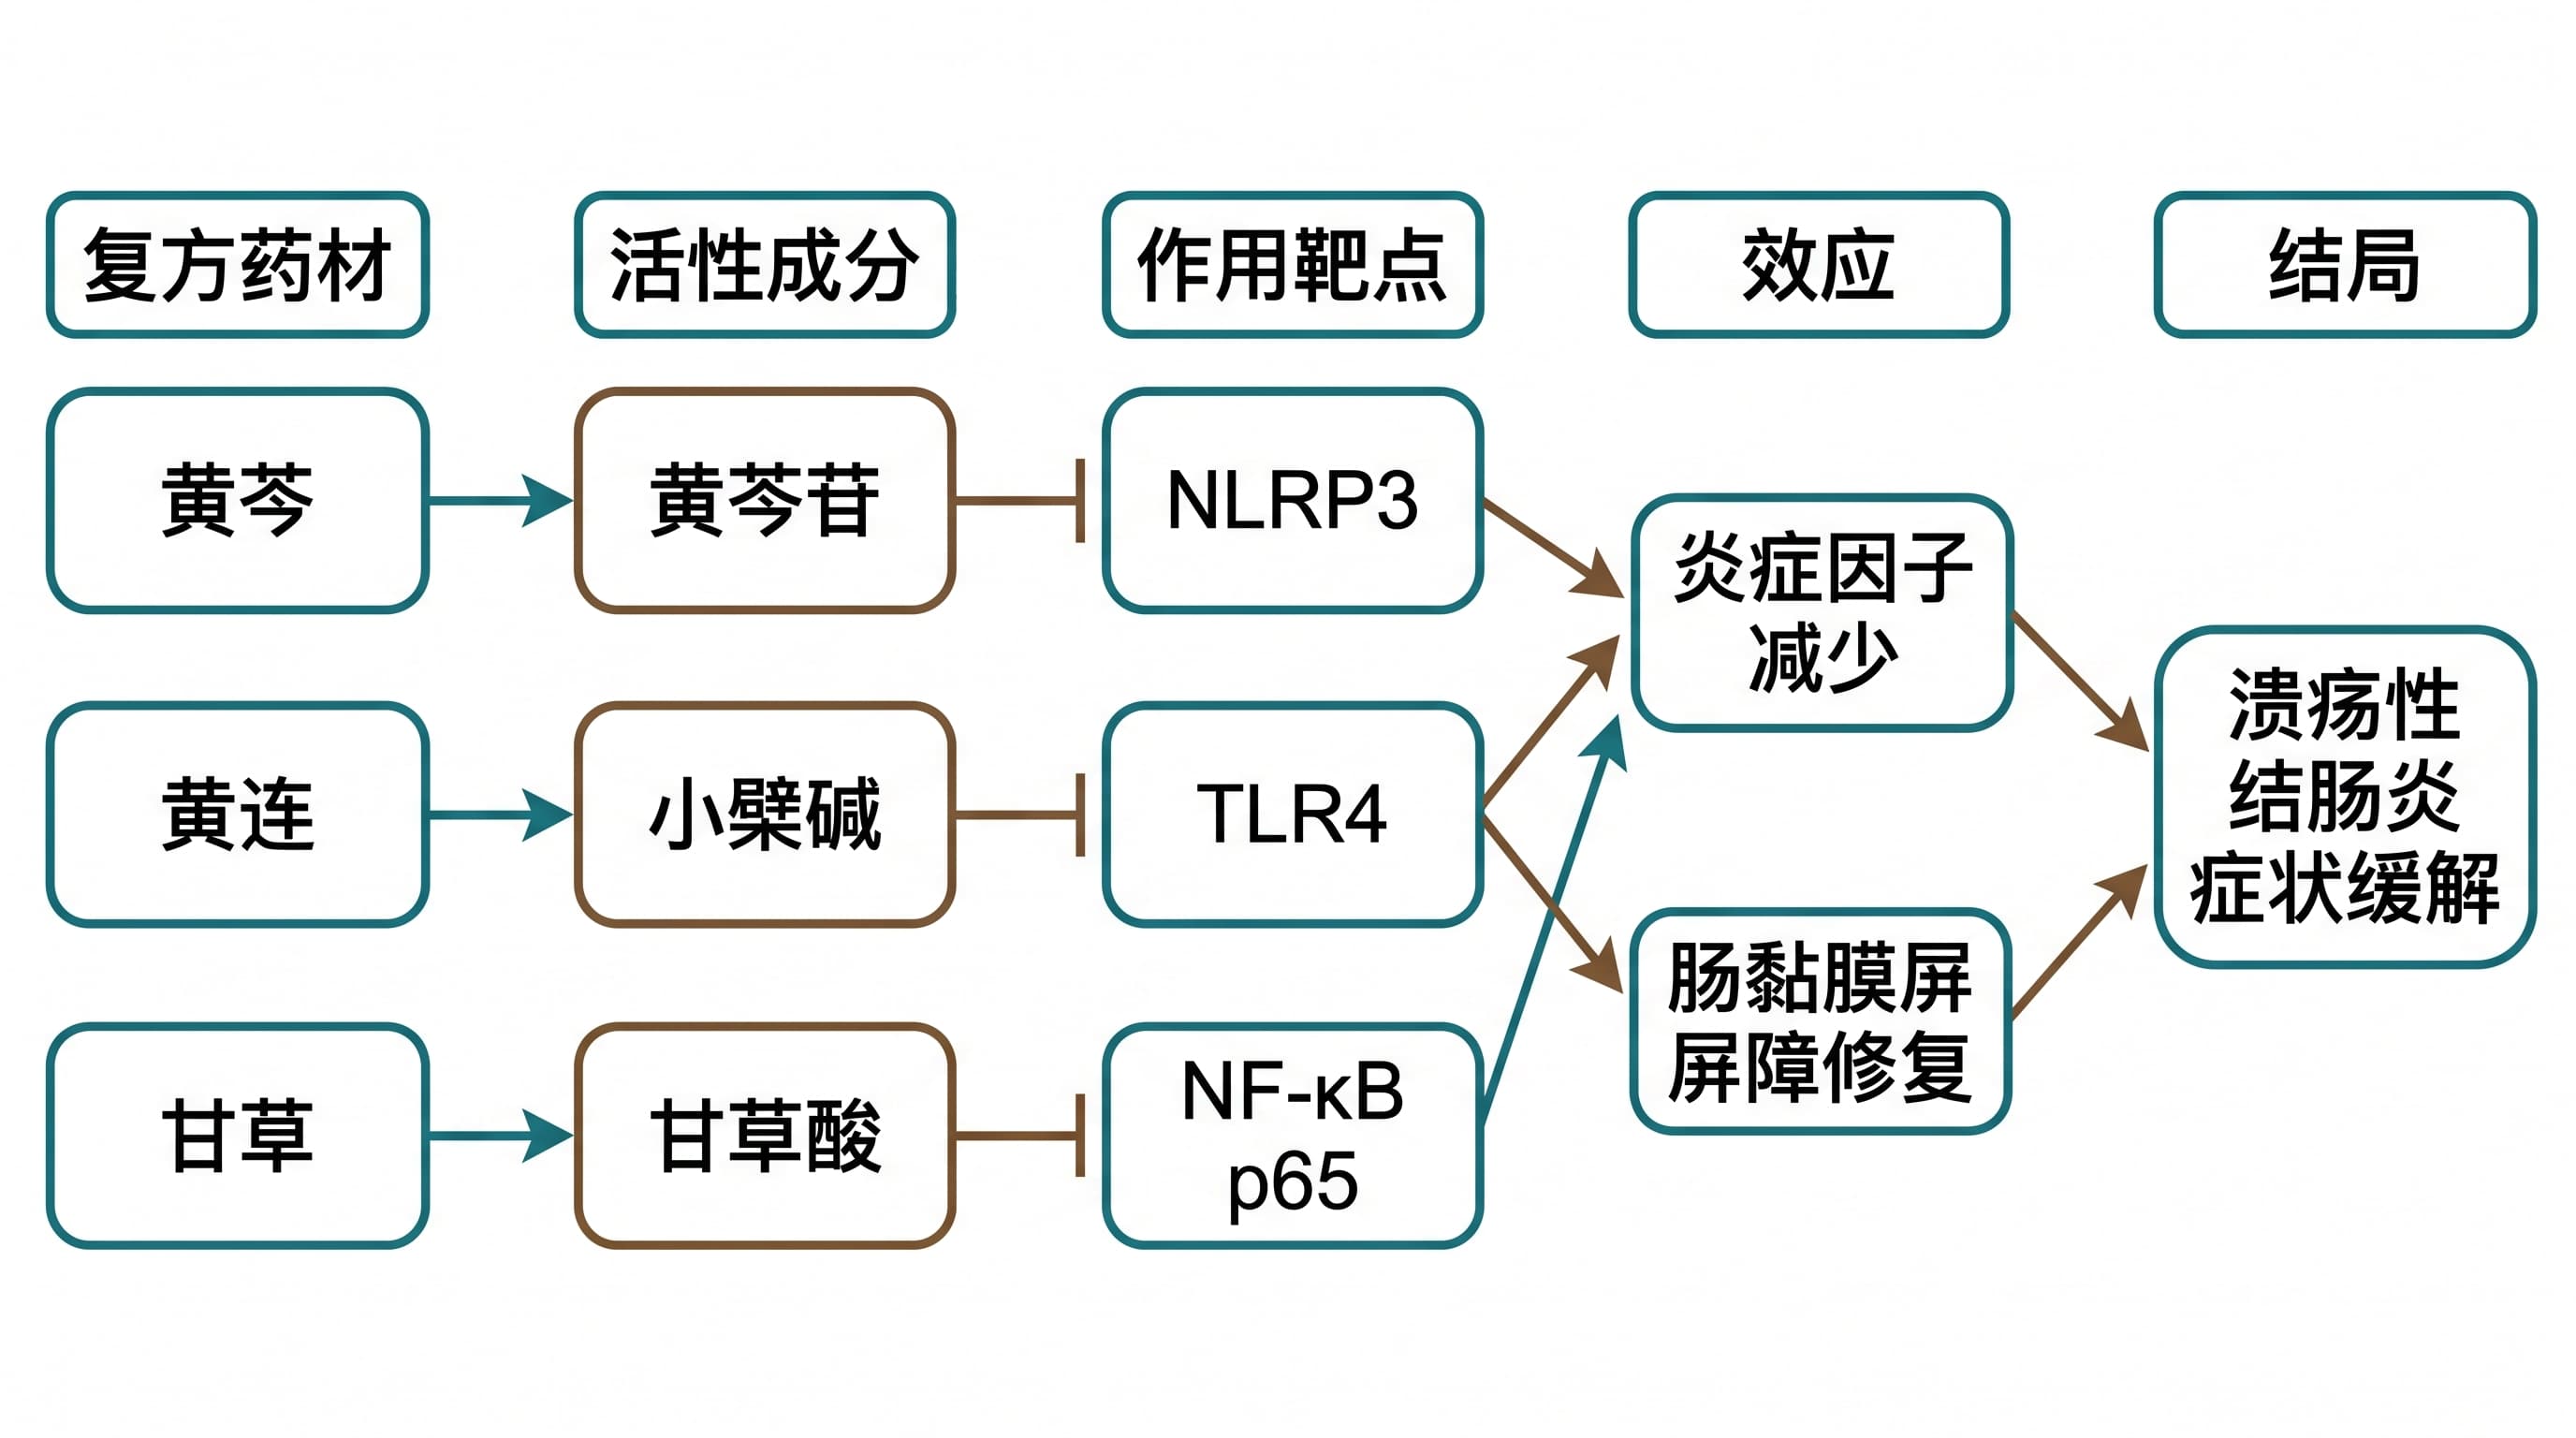
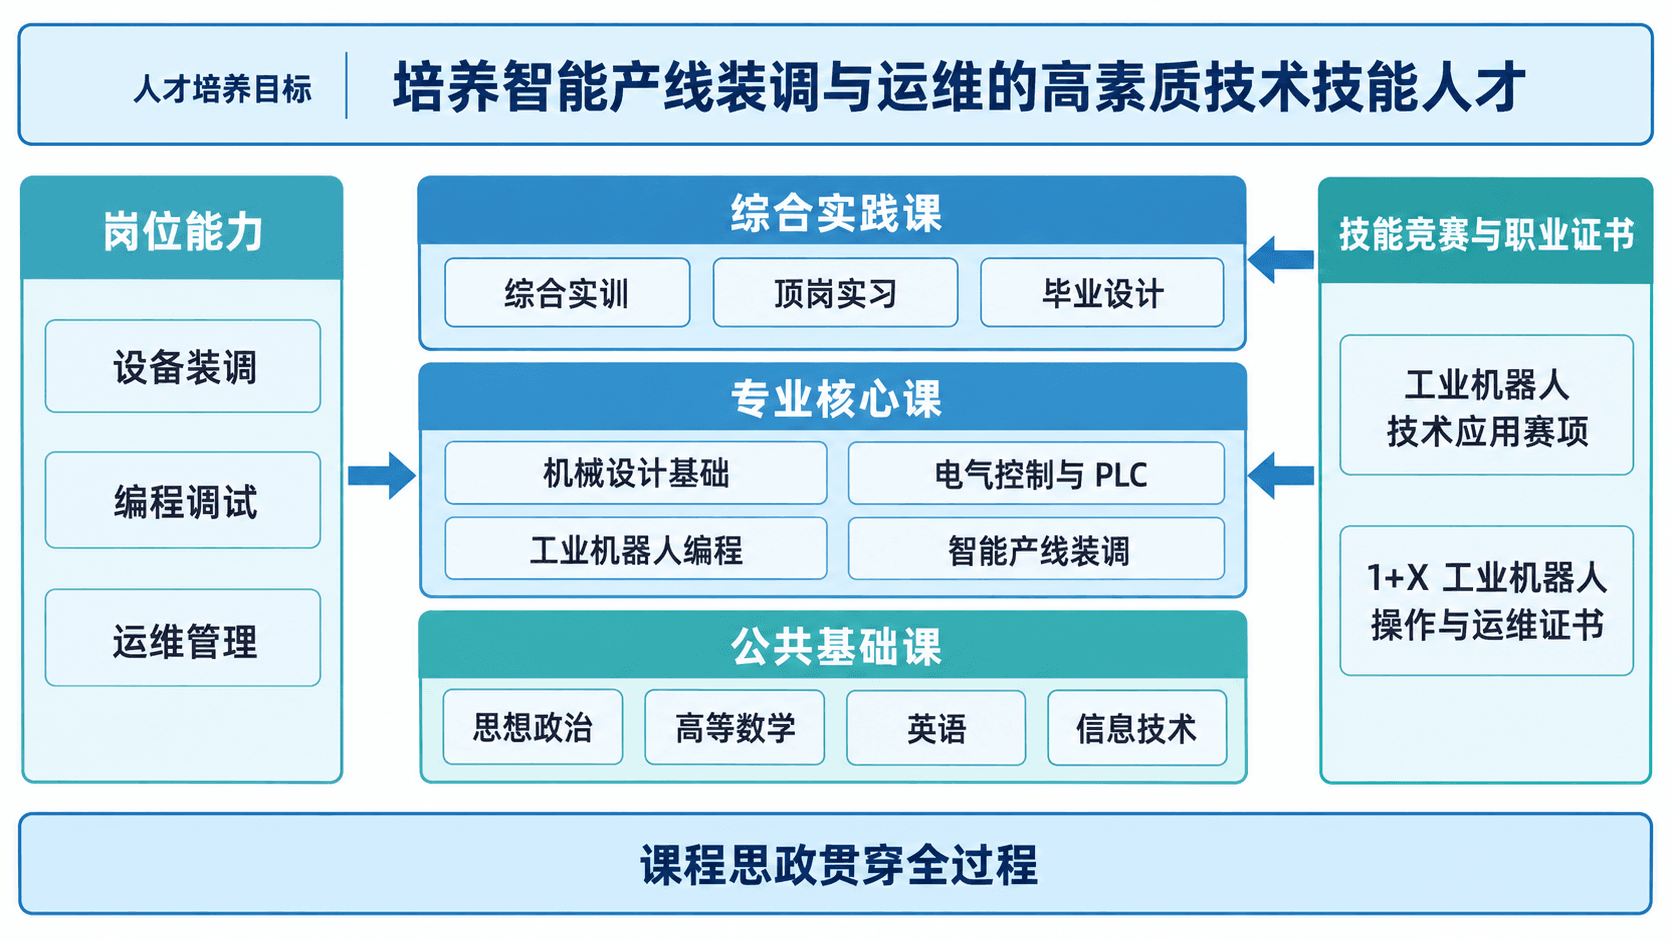
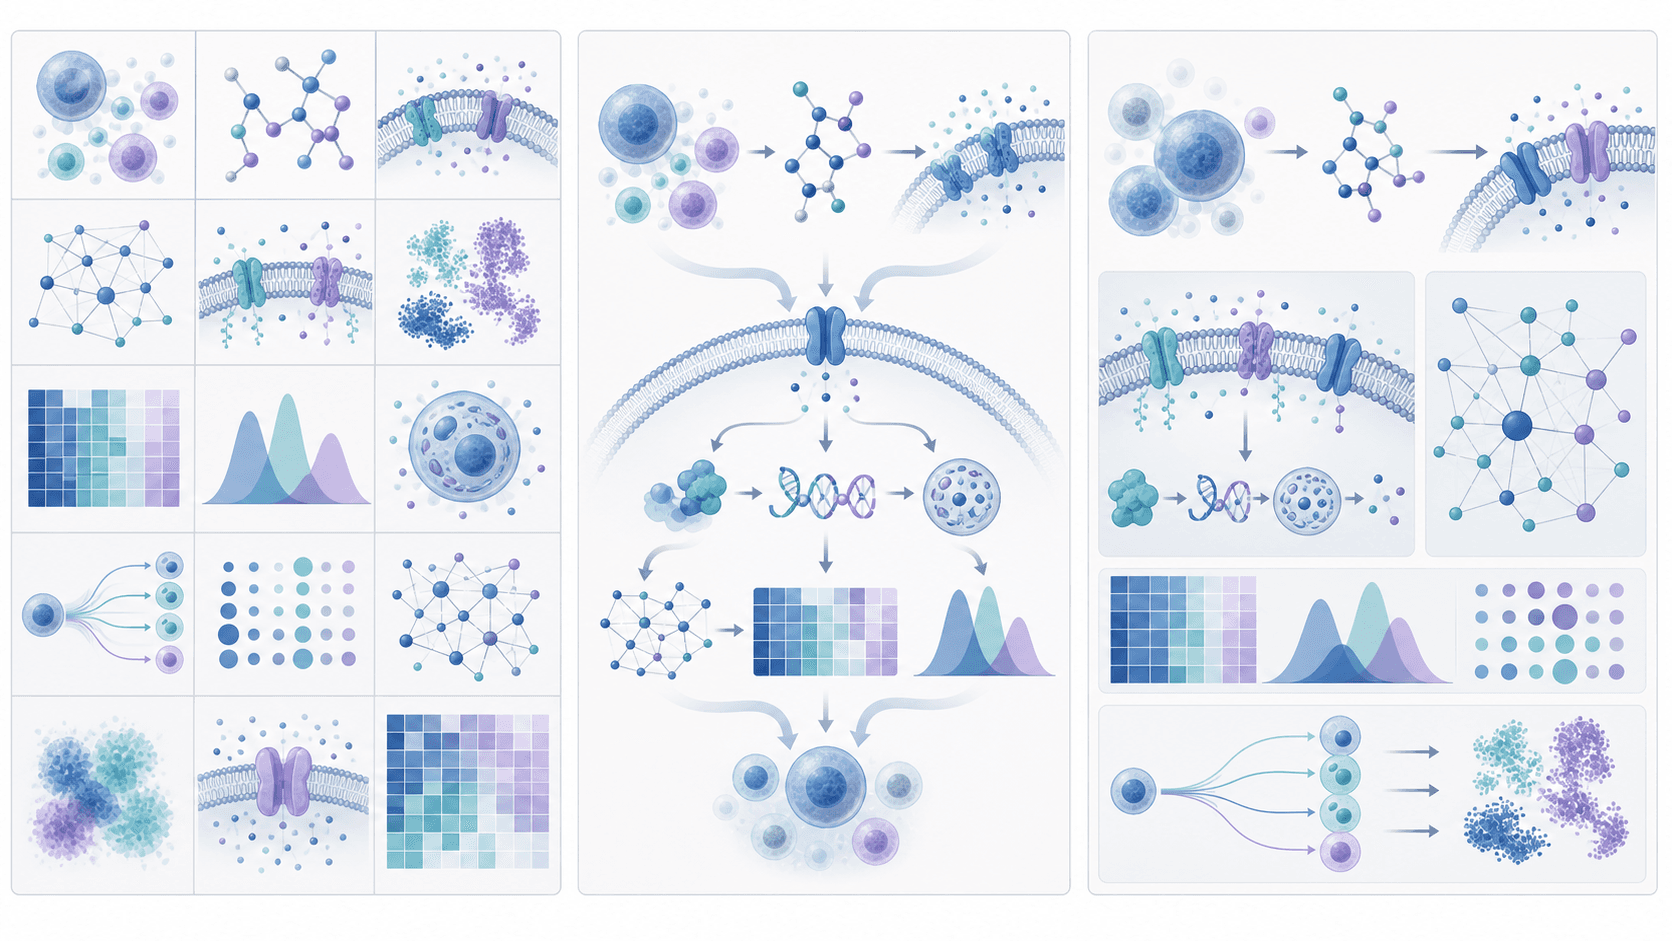
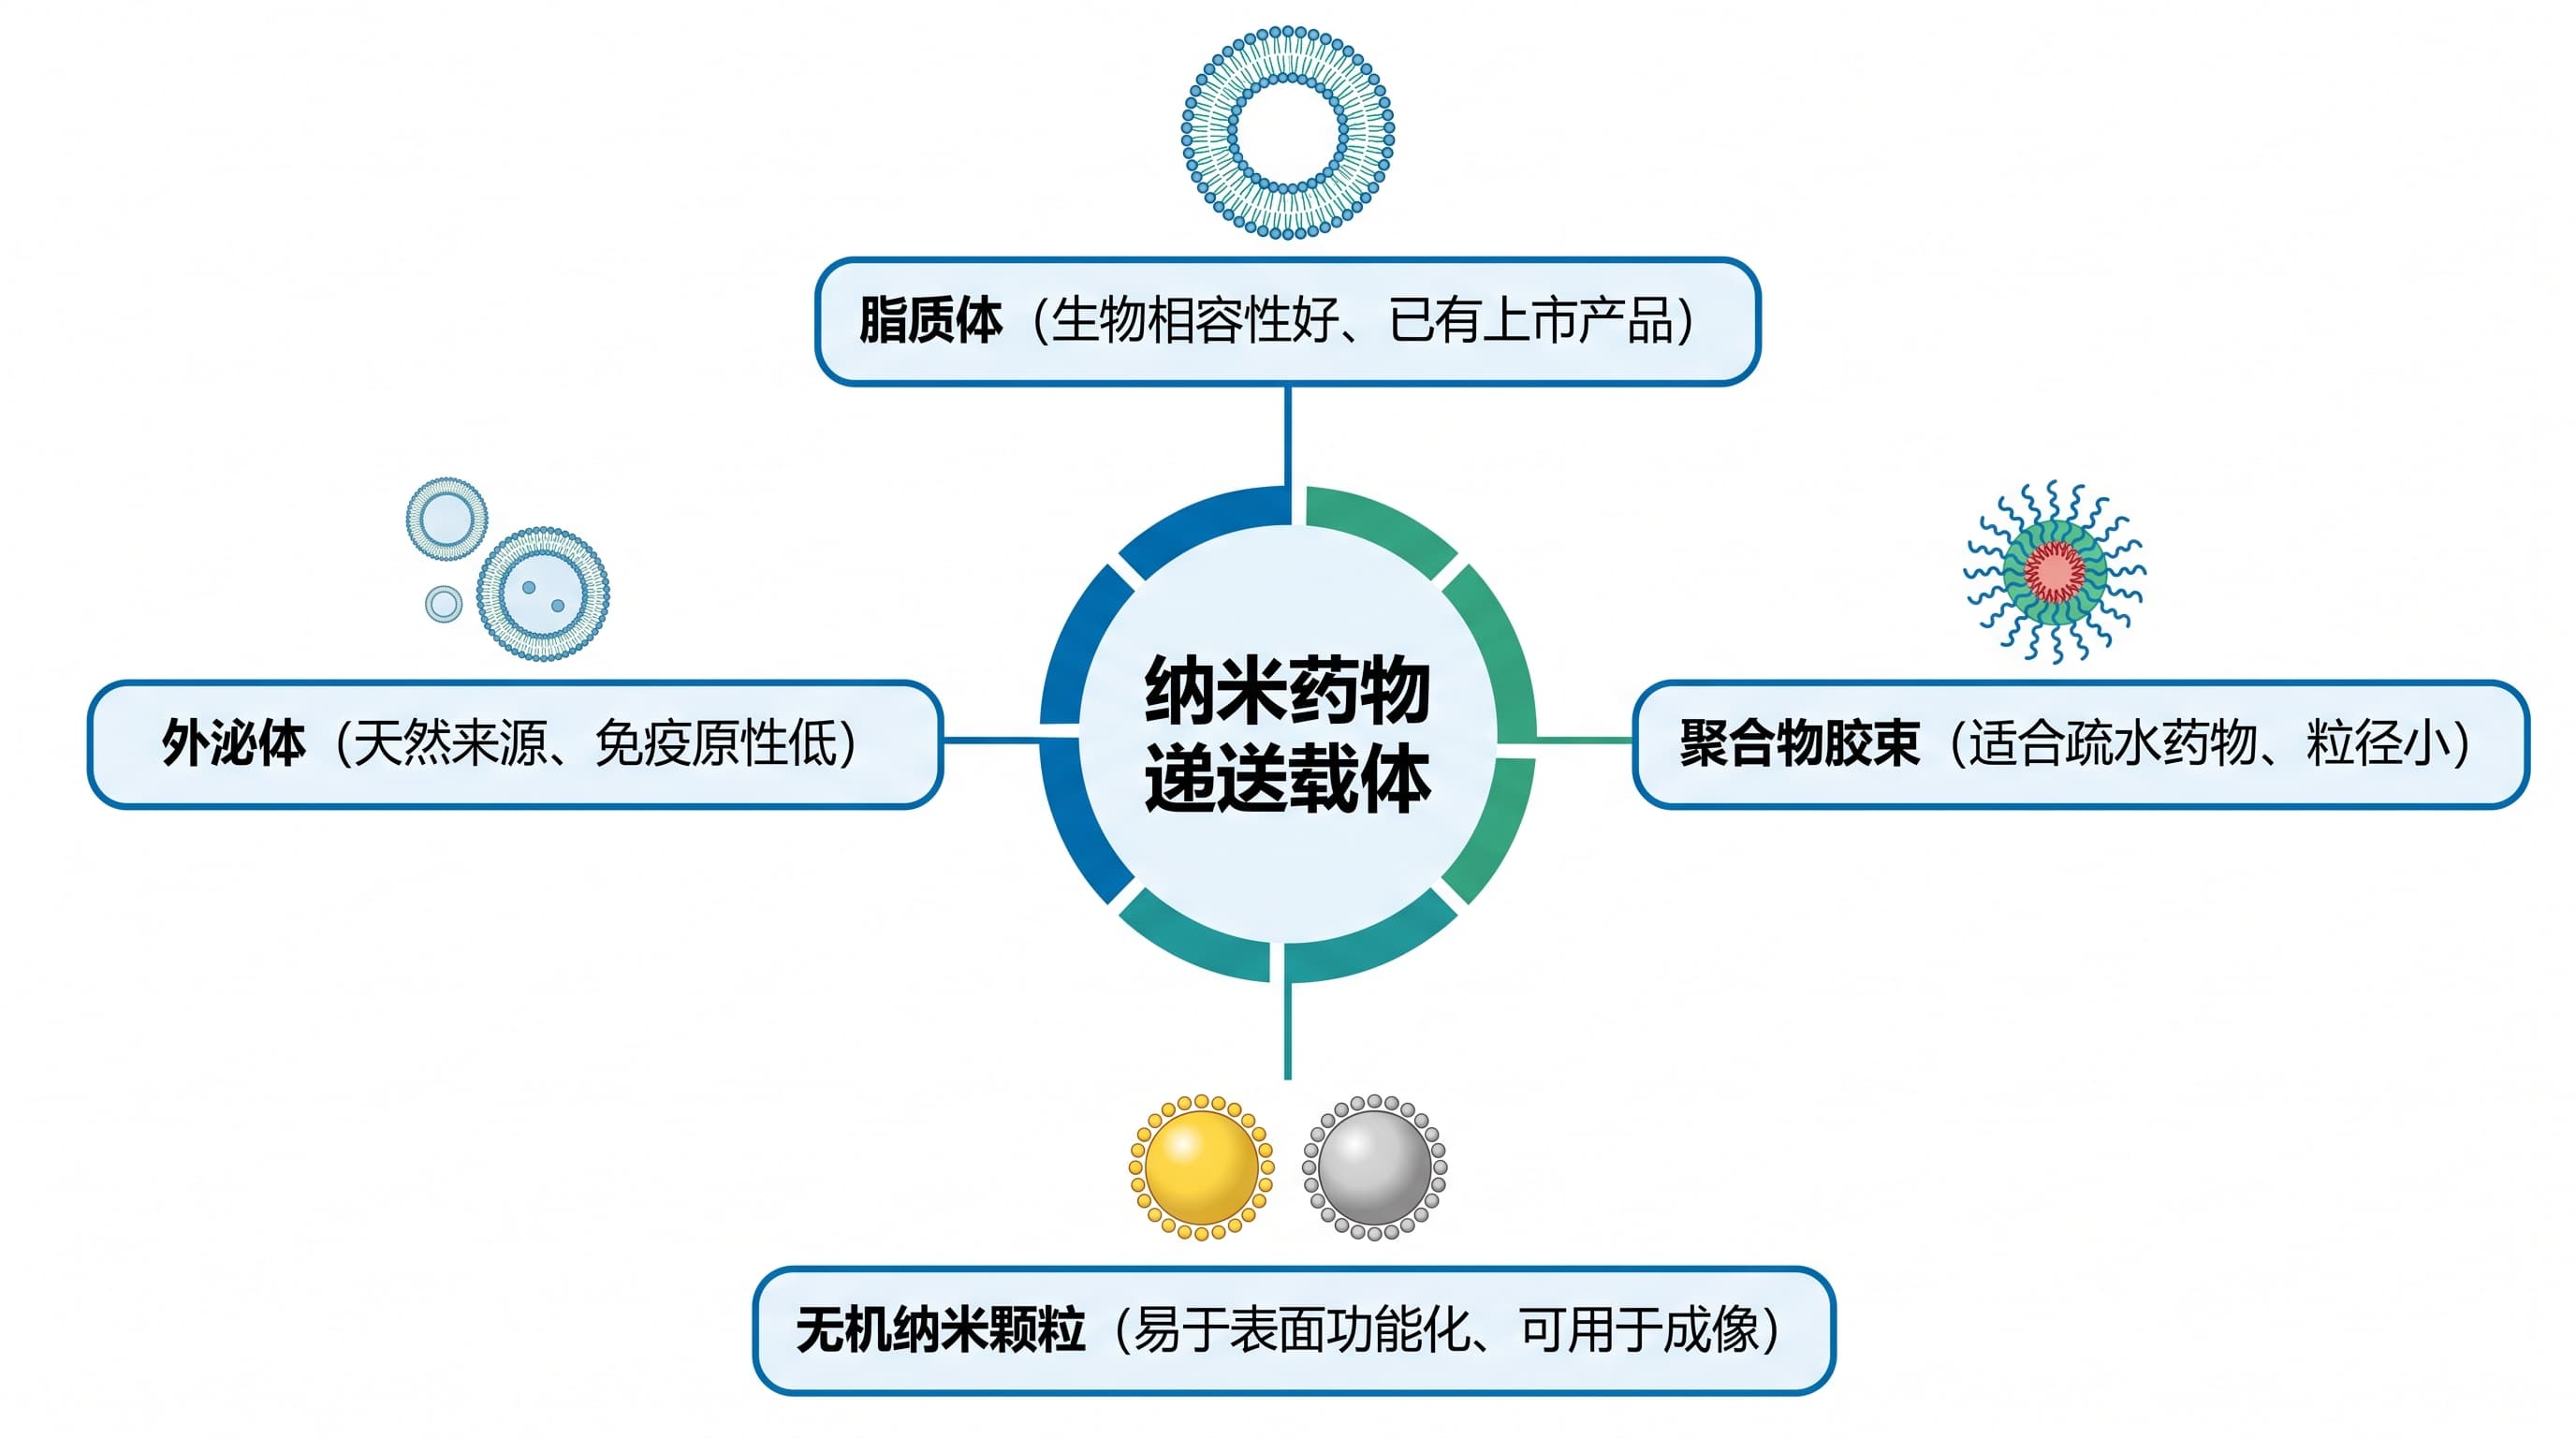
The example images and the prompts use different content; the images only illustrate structure.
Which figures a review usually has
Follow the author guidelines of your target journal for the number and format of figures.
| Figure | Where it goes | The reader's question it answers |
|---|---|---|
| Overview / classification | End of the introduction | What does this review cover, and how is it organised? |
| Timeline | Introduction or background | How did the field get here? |
| Mechanism summary | Topic sections | What process do the cited papers jointly support? |
| Comparison table | Topic sections | How do the methods or materials differ? |
| Challenges and outlook | Final section | What is unsolved, and what comes next? |
| Graphical abstract / TOC | Uploaded separately | What is this review about in one sentence? |
Overview / classification figure
Structure: one central topic, 4 to 6 first-level branches, 2 to 4 items under each, no more than about 25 nodes. Branch names and order should match your section headings, so the figure doubles as a table of contents.
Common mistakes:
- Mixing criteria, for example half the branches by material and half by application.
- A branch count that does not match the number of sections.
- A decorative icon on every node, which shrinks the text.
Classification overview for a review article, 1:1 square, radial layout.

Centre circle: [review topic]

Five first-level branches spread evenly around the centre, one colour each:
Branch 1 [category 1]: [item A], [item B], [item C]
Branch 2 [category 2]: [item A], [item B]
Branch 3 [category 3]: [item A], [item B], [item C]
Branch 4 [category 4]: [item A], [item B]
Branch 5 [category 5]: [item A], [item B], [item C]

Rounded boxes for branches, smaller light boxes of the same colour for items.
Boxes of the same level are the same size; no crossing lines. White background, no icons.
Use only the text I provide; do not add other branches.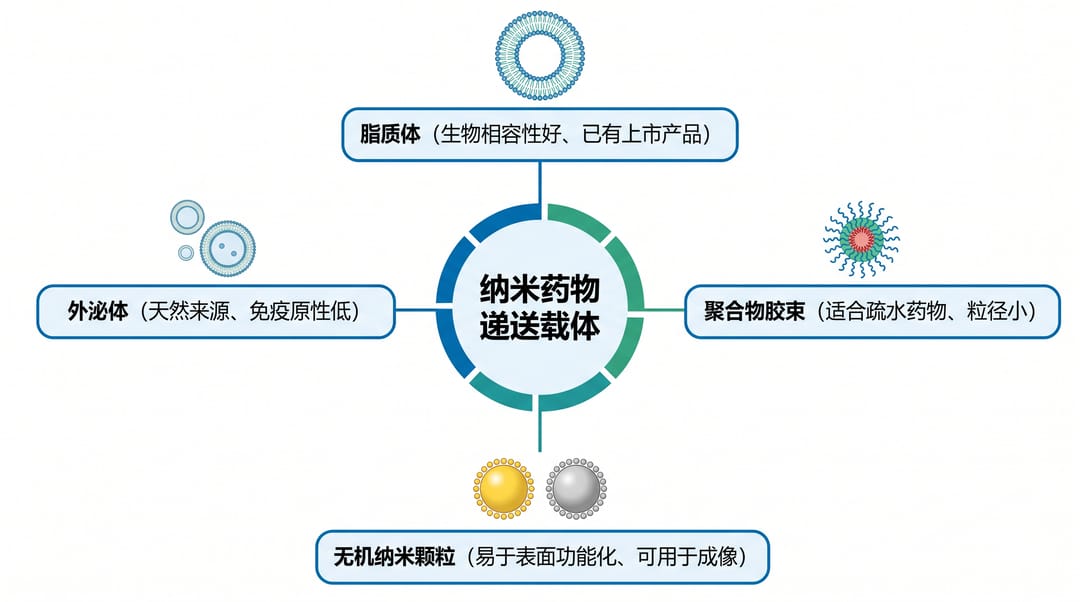
If the categories are hierarchical instead of parallel, draw a top-down tree with the conceptual framework maker.
Timeline
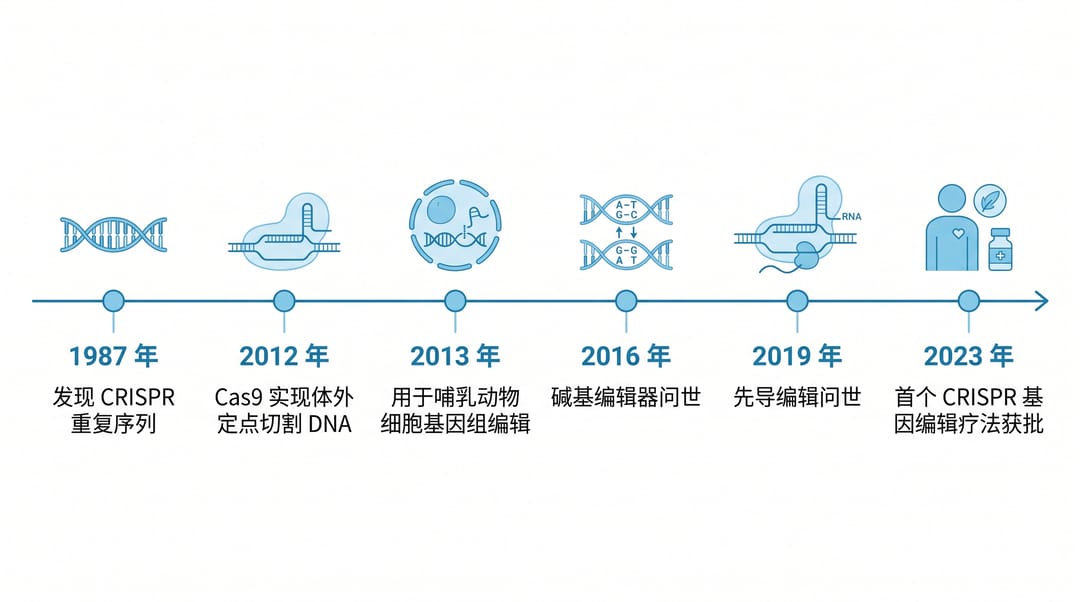
Structure: one horizontal axis with 6 to 10 nodes, each with a year and a short event, alternating above and below the line. Background bands can split the axis into two or three periods.
Common mistakes:
- Too many nodes, sparse in the early years and crowded in recent ones.
- Even spacing that ignores the real intervals, with no note in the caption.
- Years written from memory. Every year should trace to a reference.
In the prompt, list each node as [year]: [event], state that boxes alternate above and below a left-to-right axis, name the periods and the nodes they cover, and end with "Use only the text I provide; do not add other years."
Mechanism summary
Structure: left to right in three parts: initiating factors, 3 to 5 intermediate steps, outcomes. Use line style for evidence: solid for well-supported steps, dashed for debated ones, with a legend.
Common mistakes:
- Including every molecule or factor mentioned anywhere in the literature. Keep one main line per figure.
- The same arrow for activation and inhibition.
- Drawing a hypothesis as firmly as an established step.
Describe the three parts and the line styles in your prompt, and end it with "Use only the text I provide; do not add other steps." The mechanism figure generator suits mechanisms that need cells or pathways drawn.
Comparison table figure
Structure: 4 to 6 rows of methods or materials, 3 to 5 columns of criteria, short phrases or symbols in the cells. It suits qualitative comparison; content with many values and per-cell references belongs in a regular journal table.
Keep cells to phrases, state the basis for any "good" or "poor" rating in the caption, and compare every column under the same conditions.
Challenges and outlook figure
Structure: three columns: challenge, knowledge gap, future direction, with 3 or 4 boxes each. The boxes in a row correspond one to one and are linked by rightward arrows.
Common mistakes:
- Three columns written independently that do not line up across.
- Directions such as "more research is needed". Name a specific question or method.
- Items that differ from the subheadings of your outlook section.
Challenges-and-outlook figure for a review article, 16:9 landscape, three columns and three rows.

Column headers, left to right: Challenges, Knowledge gaps, Future directions

Row 1: [challenge 1] → [gap 1] → [direction 1]
Row 2: [challenge 2] → [gap 2] → [direction 2]
Row 3: [challenge 3] → [gap 3] → [direction 3]

One colour per column. Boxes in a row are aligned and linked by rightward arrows.
Boxes the same size, no arrows between rows. White background.
Use only the text I provide; do not add other rows.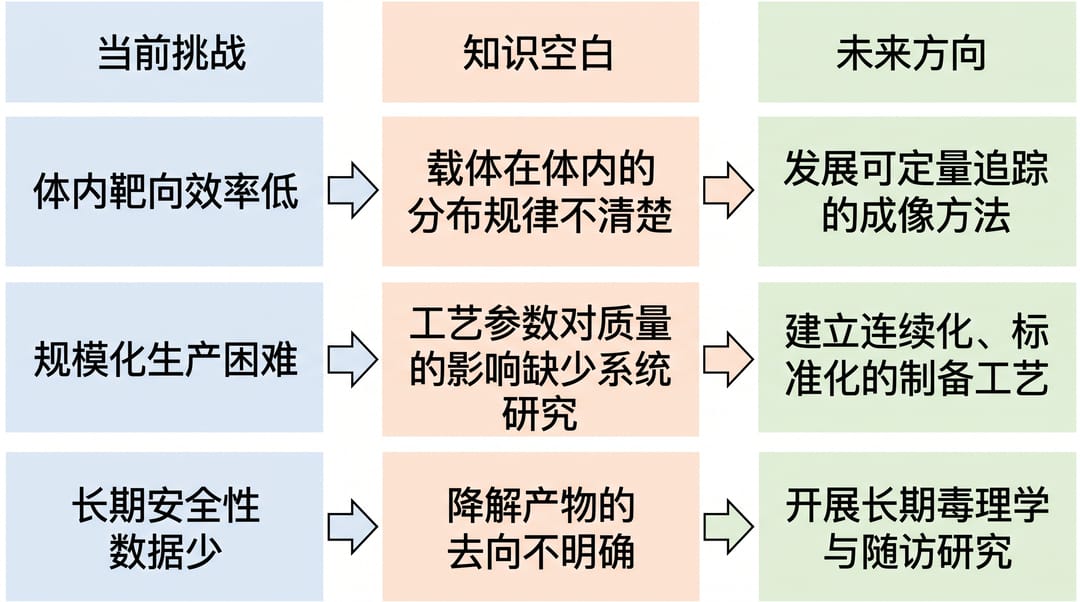
Graphical abstract / TOC graphic
Structure: a single panel in three blocks from left to right: scope, core categories or mechanism, outlook, with about 30 words in total. It is a reduced version of the overview figure, not the overview shrunk down. Take the size and aspect ratio from the journal's author guidelines.
Use the graphical abstract maker, or the TOC graphics generator for chemistry and materials journals.
Reusing published figures
- Reproducing or adapting a published figure normally needs permission from the copyright holder, or a licence on the original that allows reuse, plus a source line in the caption.
- Redrawing your own schematic from your own understanding avoids reusing someone else's artwork, but the scientific content still needs citations.
- AI-generated figures are treated differently from journal to journal, and the rules change. Check your target journal before submitting, starting from the journal AI figure policy page.
What to check after generation
AI output is a draft. Before submission, check:
- Every label against the cited literature, including abbreviations and spelling.
- Years and numbers. Timelines and figures with values are where errors appear most.
- Arrow direction and type. Read the figure aloud along the arrows.
- Extra or missing categories. Even with "do not add", an unrequested branch or row can appear.
In SciDraw AI you can make small corrections with a text instruction instead of regenerating. New accounts get 10 free credits at sign-up plus 5 per day, and one 2K diagram costs 5 credits.
FAQ
How many figures should a review have?
Follow the journal's guidelines. A common plan is one overview in the introduction, one figure per main section, and one outlook figure at the end.
Can the overview figure double as the graphical abstract?
Better not. An overview can hold twenty nodes; a graphical abstract is often shown as a thumbnail and carries three to five elements.
Can I let the AI fill in the years on a timeline?
No. Supply every year and event from your references and let the AI handle layout, then check each one.
Which export format is easiest to edit later?
PNG is enough for the manuscript. If you expect to change text or colours, export SVG (10 to 15 credits) or PPTX (10 credits).
Summary
Decide first what the figure shows (categories, time, a process or a comparison), whether its nodes match your sections, and whether every label traces to a reference. Then copy the matching prompt and replace the bracketed text.