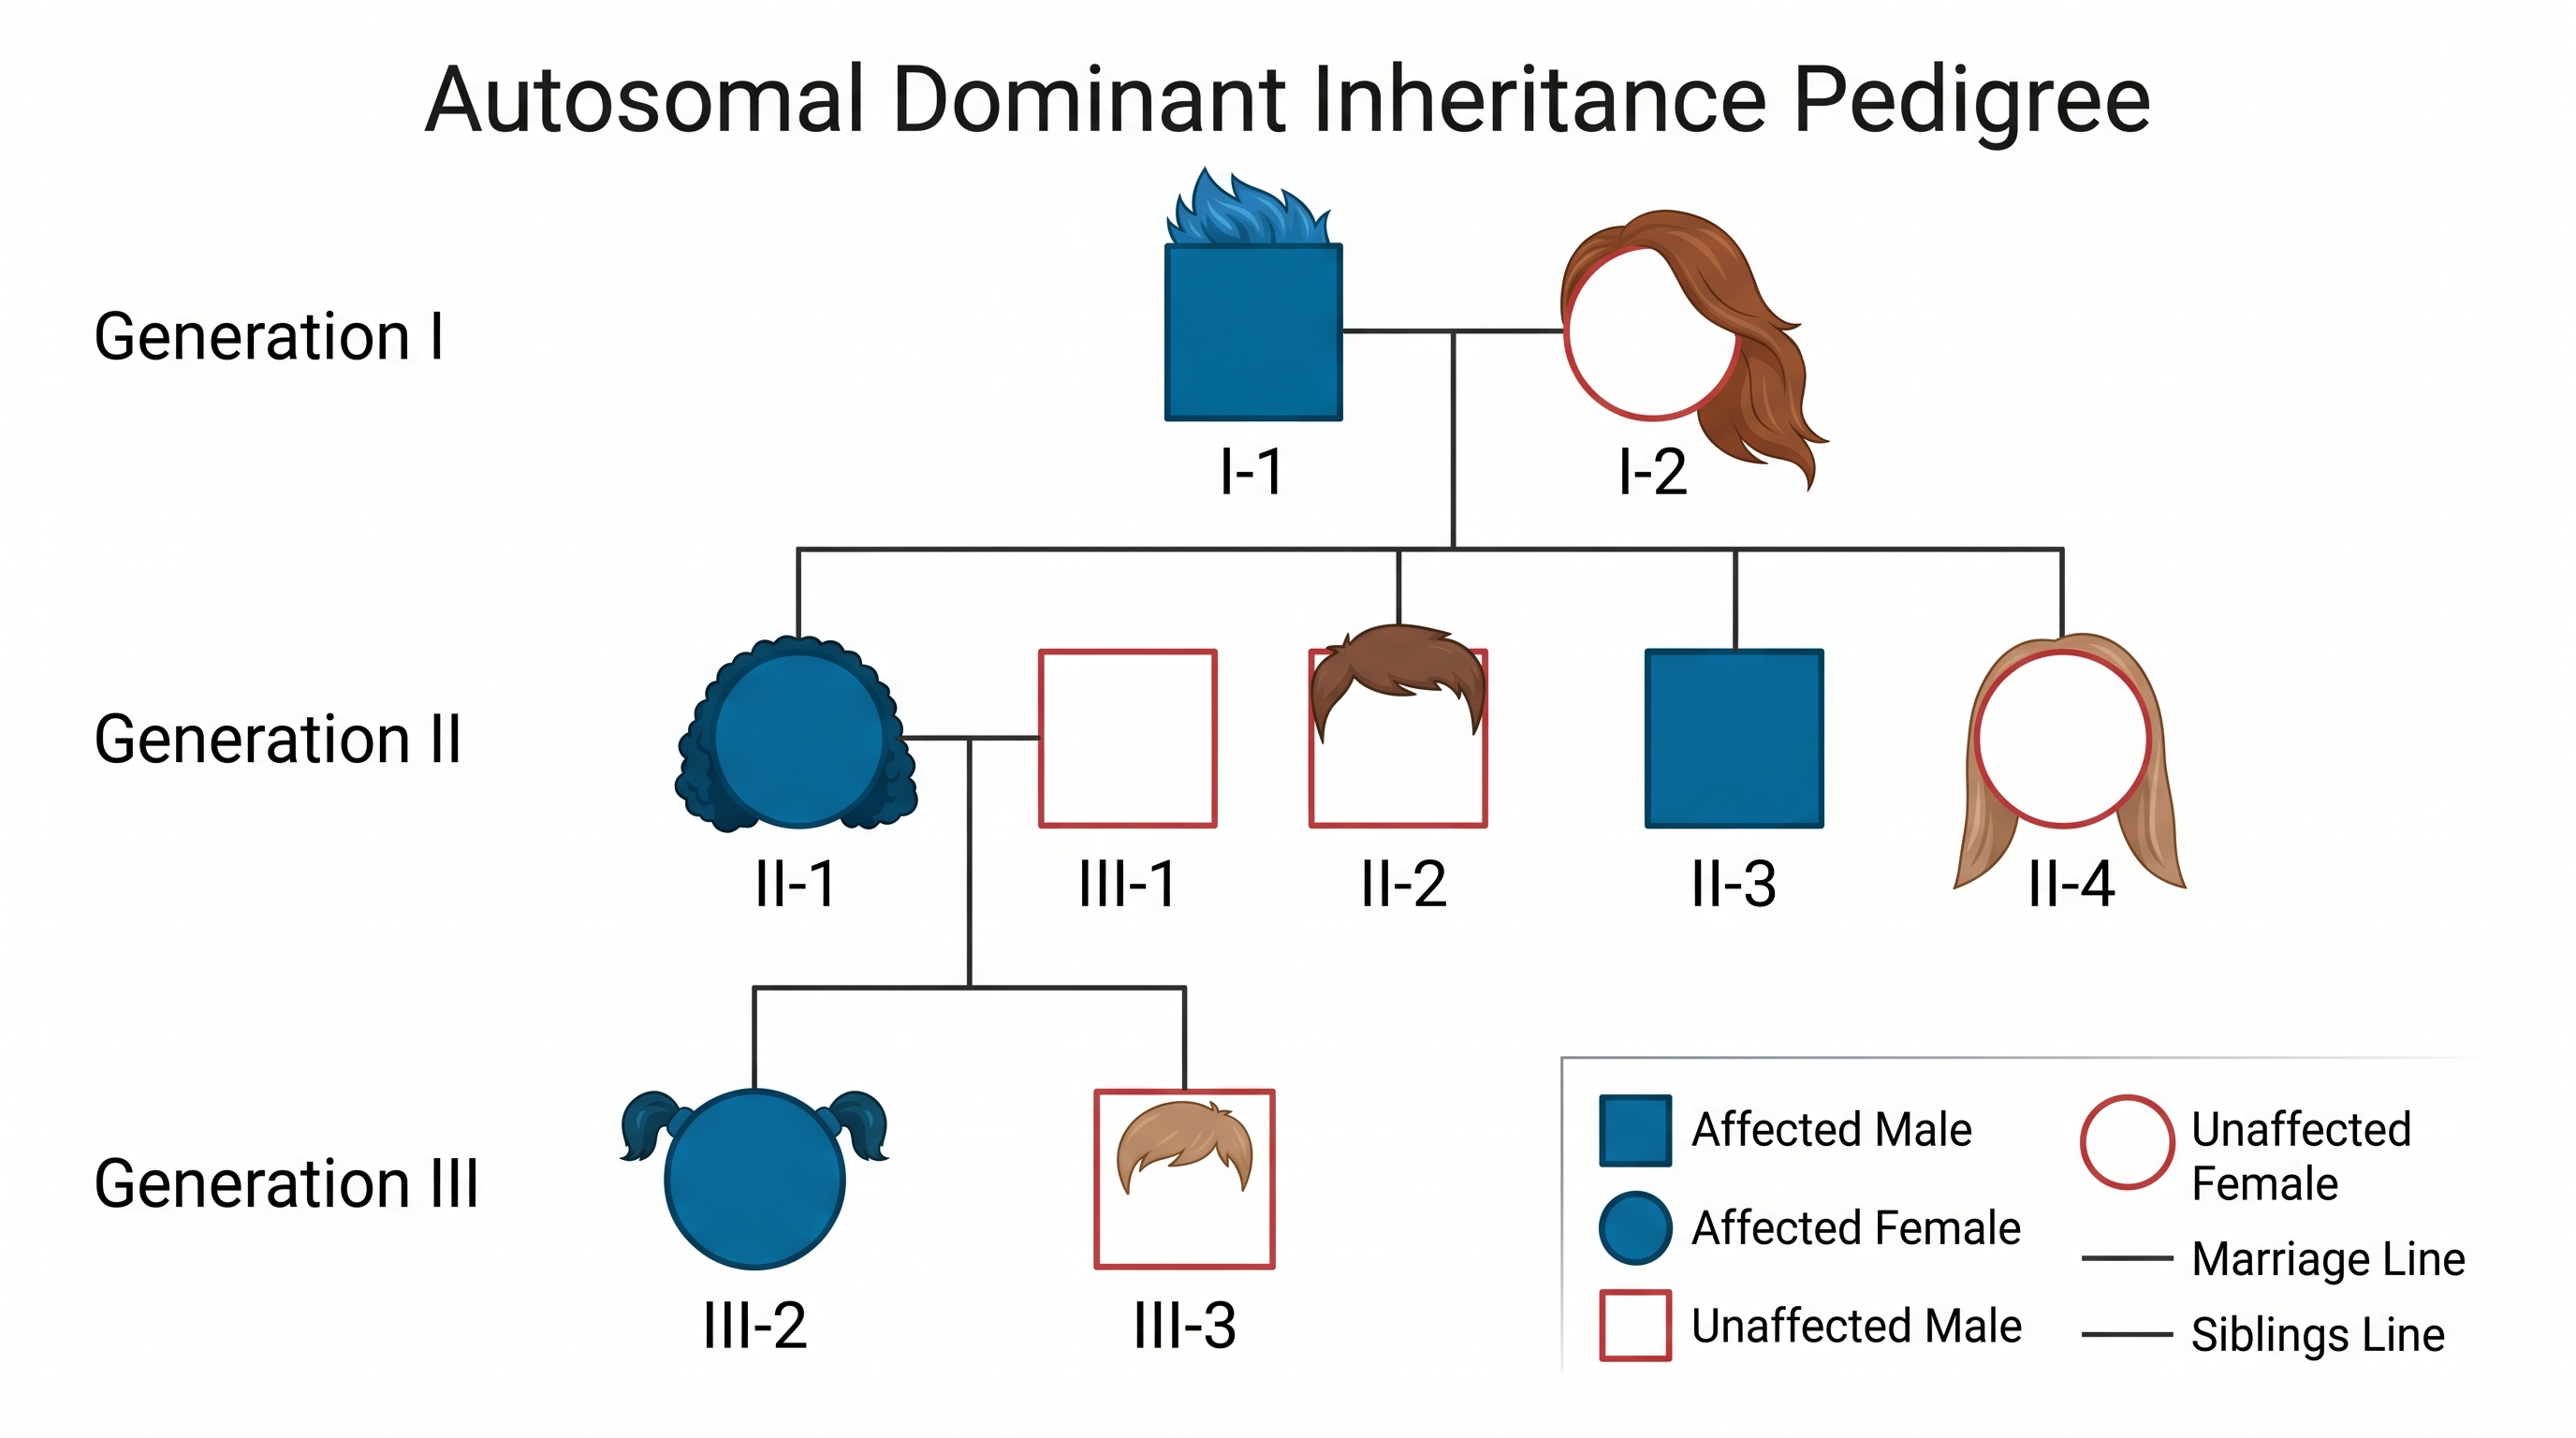
Free Pedigree Chart Maker
Generate a genetics pedigree diagram from plain text
Describe a family and the trait or condition being tracked, and AI draws a clean pedigree chart using standard genetics symbols — squares, circles, affected/unaffected shading, and mating lines — ready for genetics homework, lab reports, and presentations.
Pedigree chart examples
Click any example to load its prompt, or use it as a starting point for your own genetics pedigree diagram.
What is a pedigree chart?
A pedigree chart is a diagram that traces how a specific trait or genetic condition is passed down through several generations of a family. It uses standard symbols — squares for males, circles for females, and shaded shapes for affected individuals — so an inheritance pattern can be read at a glance. This pedigree chart maker turns your written description of a family into a clean, properly laid-out pedigree diagram. You describe each generation, who is affected, and how people are related, and the AI draws and labels the chart for you. It is a drawing tool that lays out and labels the pedigree from the information you provide, not an inheritance calculator.
Why use a pedigree chart maker
- Reading and drawing a pedigree chart is a core skill in genetics, from high-school and AP Biology through university and medical genetics.
- Drawing a multi-generation pedigree diagram by hand or in generic software is slow, and one small change means re-aligning every symbol.
- A correctly drawn pedigree chart makes inheritance patterns — autosomal dominant, recessive, X-linked, or maternal — visible at a glance for pedigree analysis.
- Genetic counselors and clinicians use family pedigree charts (and genograms) to track disease risk and plan testing across a family.
- Regenerating the diagram from an updated text description is far faster than repositioning nodes every time the family data changes.
How to make a pedigree chart
Start by listing each generation (I, II, III) and every individual with their sex, affected status, and family relationships. Note the inheritance pattern you want to illustrate — autosomal dominant, autosomal recessive, X-linked, or mitochondrial — plus any known carriers, consanguineous matings, and the number of children in each sibship. The AI then draws the pedigree chart, placing squares and circles, connecting matings and offspring with lines, and shading affected individuals. Check that the symbols follow standard conventions, then refine your description and regenerate until the pedigree diagram matches your data.
Pedigree chart symbols
- Square = male individual; circle = female individual.
- Horizontal line = a mating or partnership between two individuals.
- Vertical line = offspring connecting parents to their children (sibship).
- Shaded (filled) shape = an affected individual expressing the trait.
- Generations labeled with Roman numerals (I, II, III) down the left side.
- Special symbols: a diagonal slash = deceased, a half-filled or dotted shape = carrier, and an arrow = the proband.
Pedigree Chart Maker FAQ
What is a pedigree chart?
A pedigree chart is a diagram that traces a trait or genetic condition through several generations of a family. It uses standard symbols — squares for males, circles for females, and shaded shapes for affected individuals — to show family structure and how the trait is inherited. It is also called a pedigree diagram or genetics family tree.
How do I make a pedigree chart online?
Describe your family in plain language: list each generation, the sex and affected status of every individual, and how they are related. The pedigree chart generator then draws and labels a clean pedigree diagram for you — placing squares and circles, connecting matings and offspring with lines, and shading affected individuals. Refine the description and regenerate to adjust the chart.
What do the symbols on a pedigree chart mean?
Squares are males and circles are females; a horizontal line is a mating, and a vertical line drops to their offspring. A shaded shape marks an affected individual, a half-filled or dotted shape marks a carrier, a diagonal slash means deceased, and an arrow points to the proband. Generations are labeled I, II, III down the side.
Can it show autosomal or X-linked inheritance?
Yes. Describe the inheritance pattern in your prompt — autosomal dominant, autosomal recessive, X-linked recessive, X-linked dominant, or mitochondrial — and note any carriers or obligate carriers. The maker draws and labels the pedigree accordingly, using carrier notation so the pattern is clear for pedigree analysis. It lays out the chart you describe; confirm the genetics against your own data.
Is the pedigree chart maker free?
Yes, you can start for free. Each generation uses a small number of credits, and new accounts receive free starter credits, so you can make pedigree charts online without any subscription to get going.
Can I use it for genetics class or homework?
Yes. The pedigree diagrams follow the standard symbols and conventions used in textbooks, so they suit AP Biology, college genetics assignments, and lab reports. Always check the output against your own pedigree data and your instructor's requirements before submitting.
Writing a paper, thesis or grant?
SciDraw AI also makes publication-ready research figures: graphical abstracts, mechanism figures, workflows and conceptual frameworks.
Explore More Tools
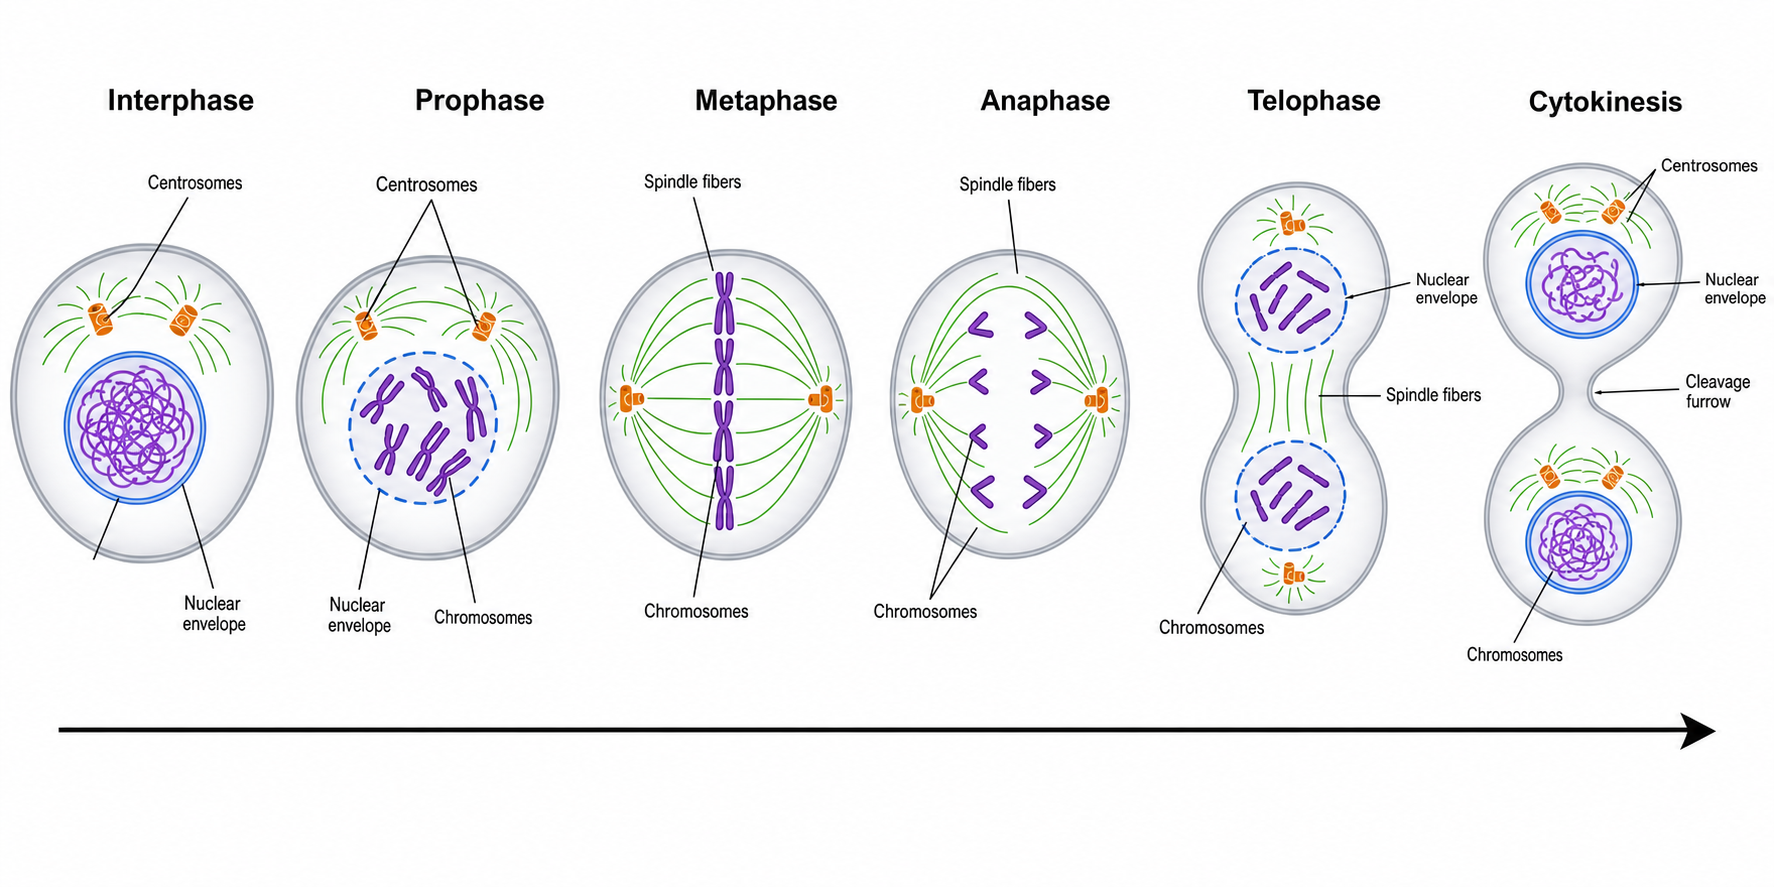
Mitosis Diagram Generator
Draw labeled phases of mitosis — prophase, metaphase, anaphase, telophase — in order.
Try it free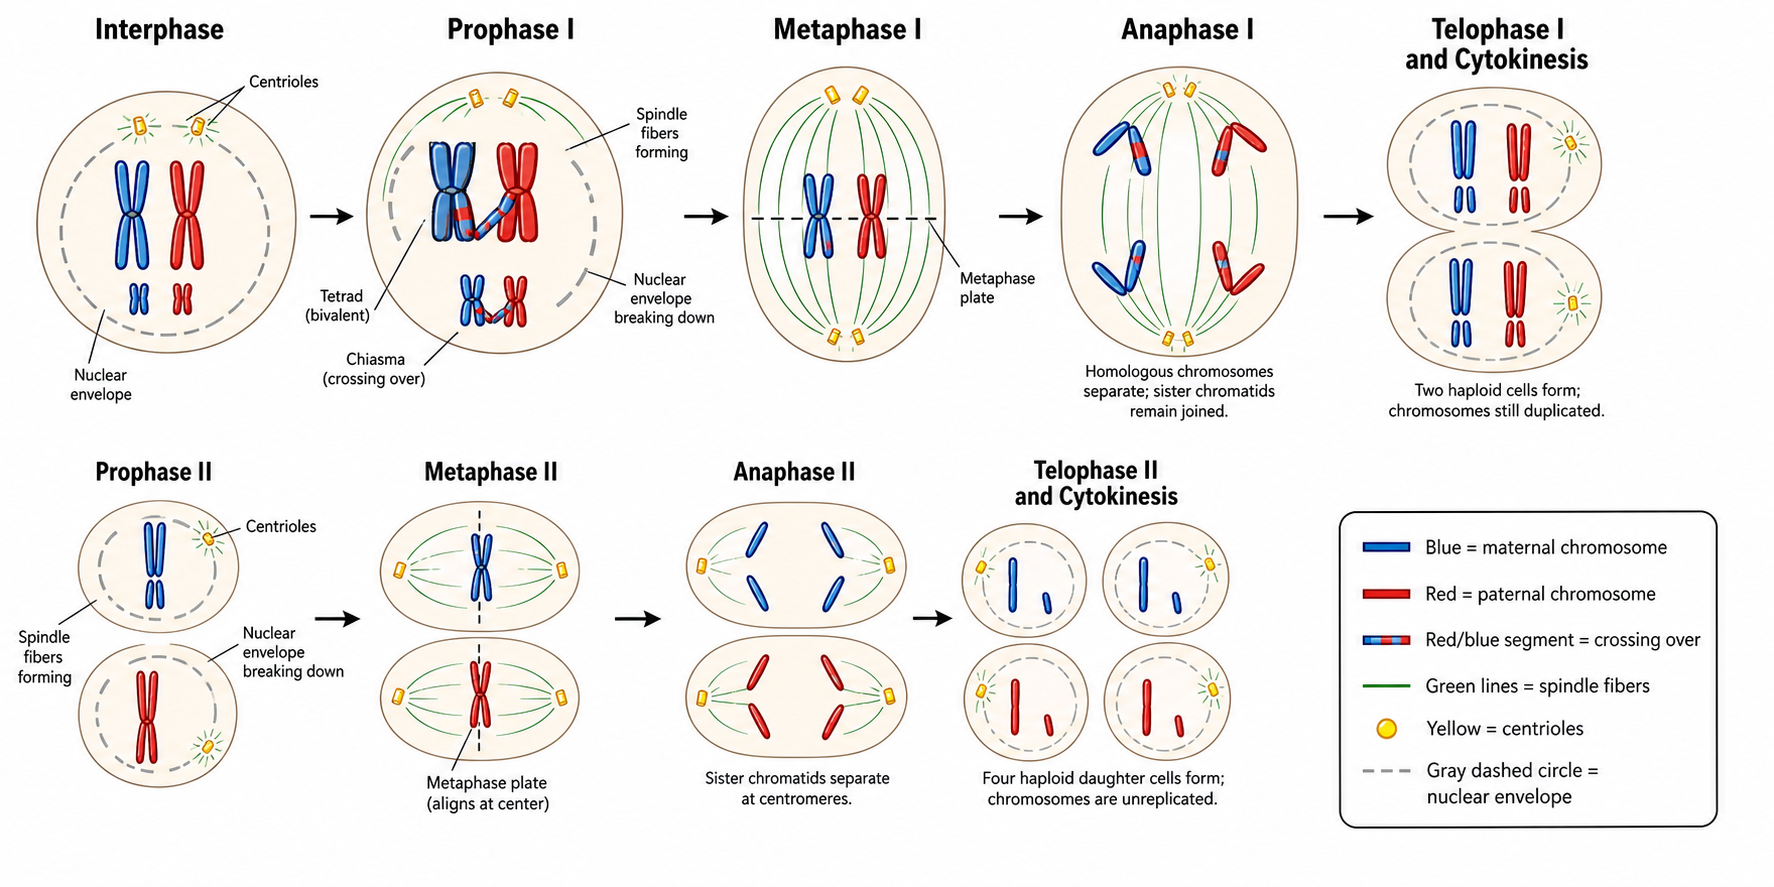
Meiosis Diagram Generator
Create labeled meiosis diagrams, the phases of meiosis I and II, and crossing over.
Try it free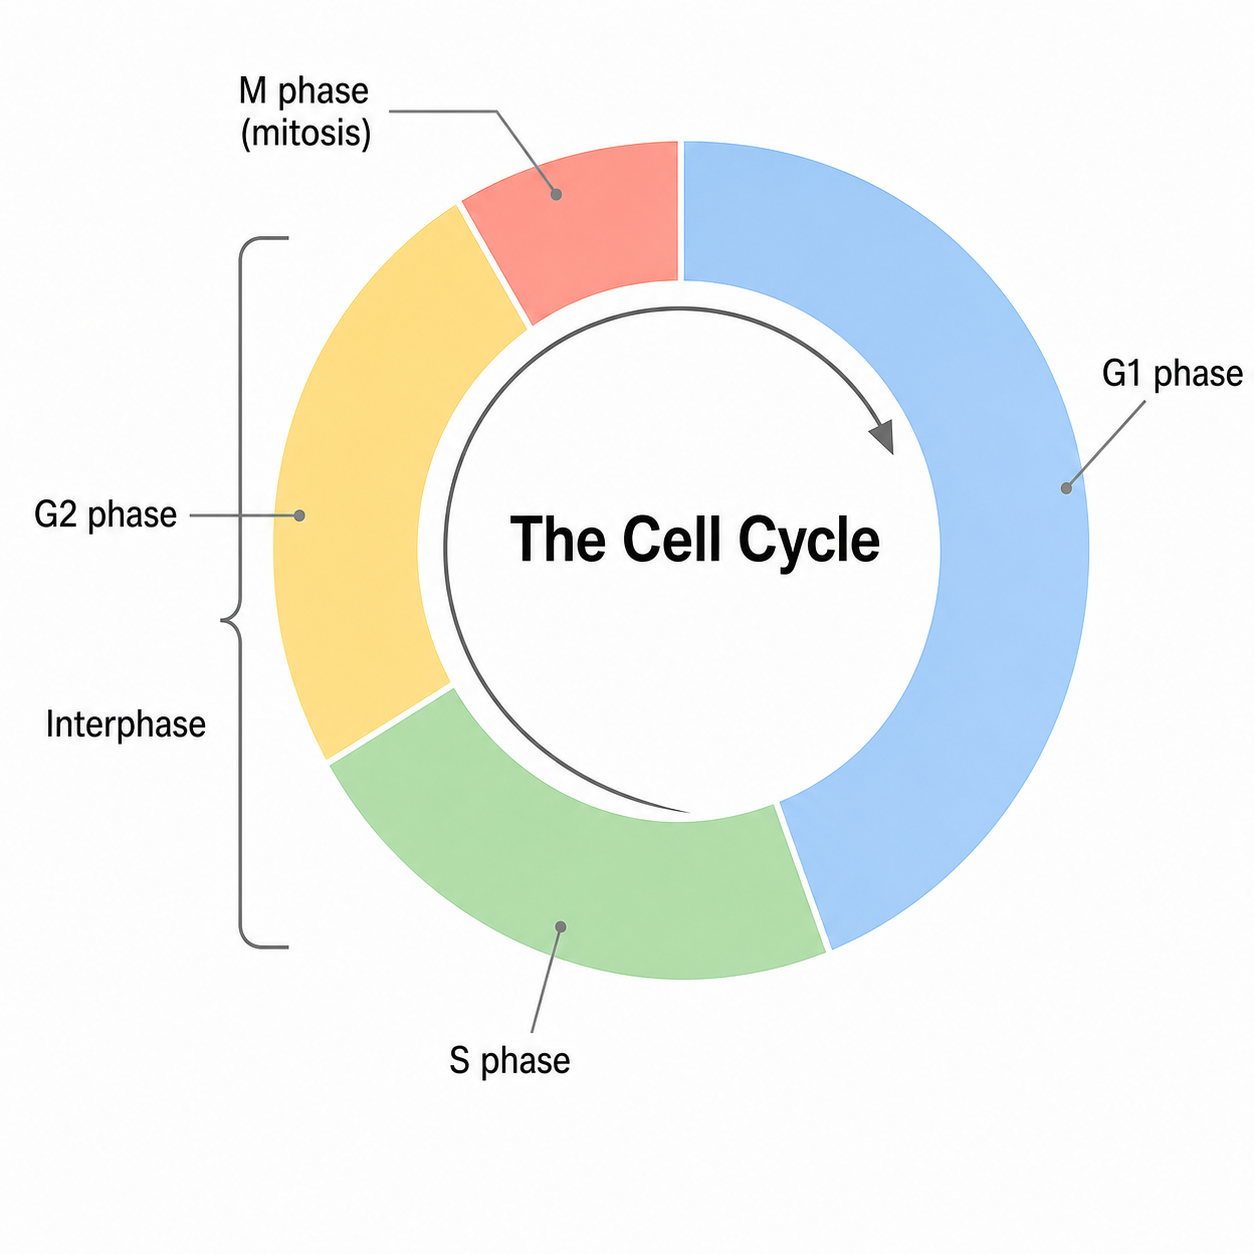
Cell Cycle Diagram Generator
Make labeled cell cycle diagrams with interphase, G1, S, G2, the M phase and checkpoints.
Try it freeNeed other genetics or biology diagrams?
Generate Punnett squares, cell cycle diagrams, DNA replication figures, and more with SciDraw AI.