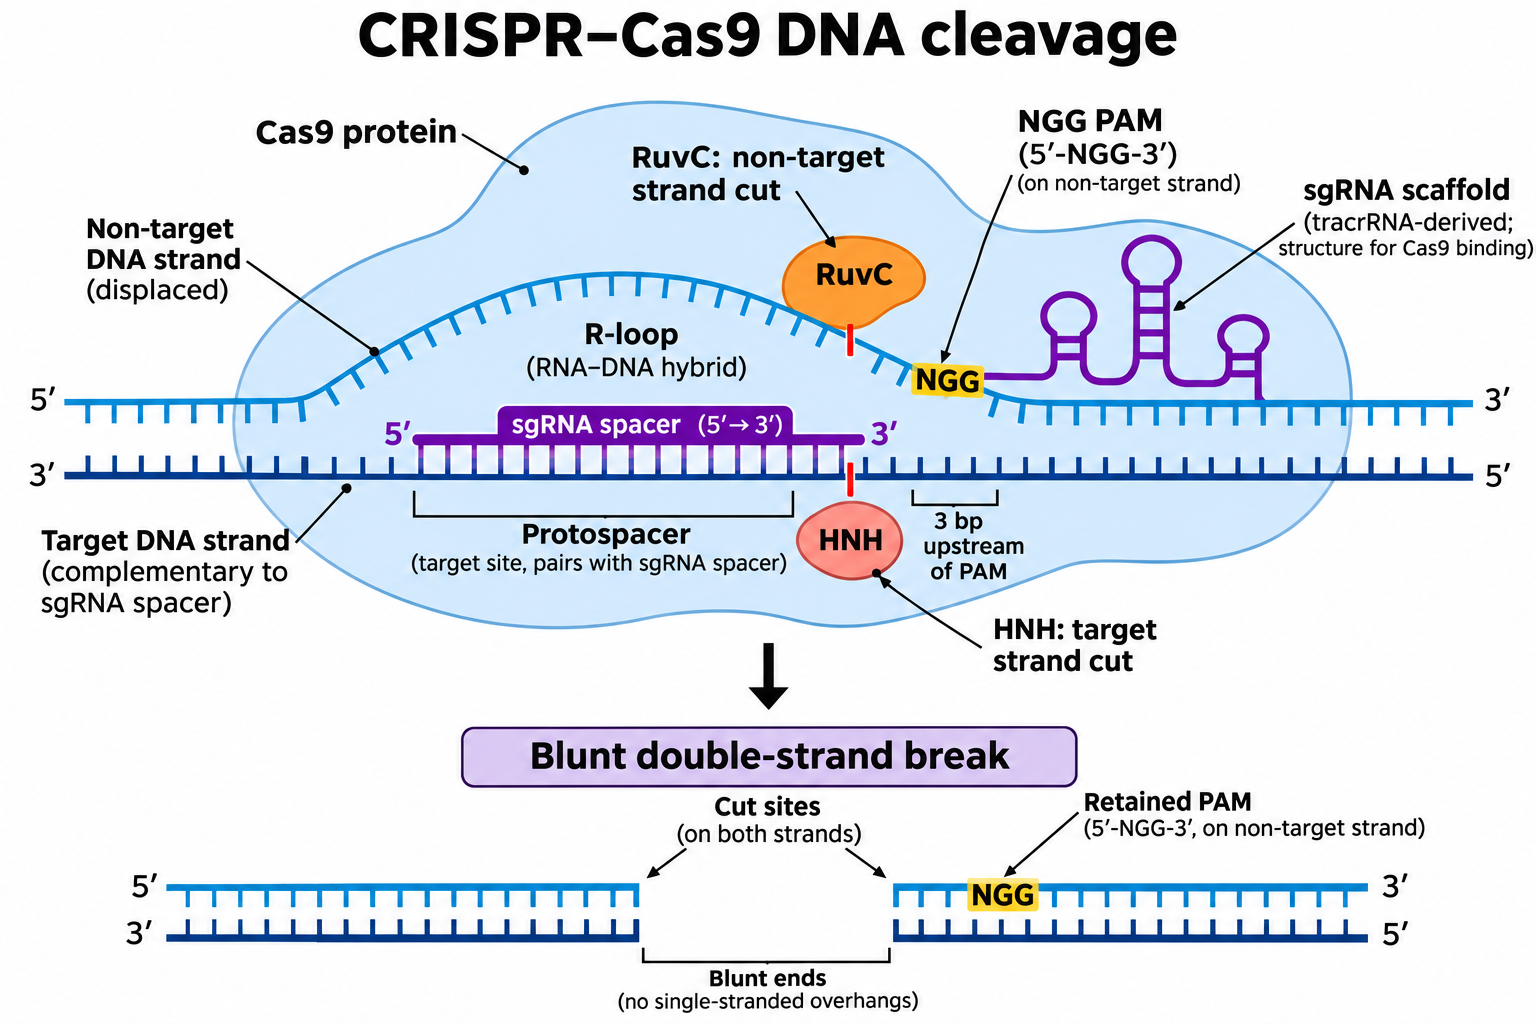
AI CRISPR and Gene Therapy Diagram Generator
Gene editing figures for papers, grants, theses and lectures
Describe the mechanism or workflow and get a labeled diagram: Cas9 and guide RNA at the PAM site, double-strand breaks, NHEJ and HDR repair, base and prime editing, or ex vivo and in vivo gene therapy with viral or LNP delivery.
CRISPR and Gene Therapy Diagram Examples
Start from a research-style prompt, then adapt it to your gene, cell type or delivery method.
Before you submit your figure
Three things to check when the figure is going into a paper, thesis or poster.
Keep it editable
Download a high-resolution PNG, or open the figure in the editor and convert it to SVG (10–15 credits) or PowerPoint PPTX (10 credits) so you can adjust labels and layout later.
Publication License Certificate
Each figure can carry a one-page PDF certificate naming you as the licensee for journals, theses, presentations and posters. It unlocks with any paid plan or credit pack.
How certificates workCheck your journal's AI policy
Publishers set their own rules: some do not accept AI-generated images in certain figure types, and many require you to disclose AI use. Read your target journal's author guidelines first.
Journal figure requirementsAI diagrams for CRISPR, gene editing and gene therapy
This generator turns a written brief into a labeled draft of a gene editing mechanism or a gene therapy workflow. Name the editor (Cas9, base editor, prime editor), the target, the repair outcome or delivery route, and the purpose, such as a methods figure, a graphical abstract, a grant aims diagram or a lecture slide.
Why clear gene editing diagrams matter
- Molecular steps like PAM recognition and DNA repair are hard to explain in text alone
- Grant applications need a quick visual of the editing strategy and therapeutic workflow
- Methods and review figures must show the editor, guide RNA and delivery route clearly
- Courses on molecular biology and genetic medicine need consistent, labeled schematics
- Comparing Cas9, base and prime editing is easier in a single multi-panel figure
How to describe a good CRISPR or gene therapy diagram
State the editor and its components, the DNA features to label (target sequence, PAM, cut or nick site), and the outcome you want to show. For therapy workflows, say whether editing is ex vivo or in vivo, name the delivery vehicle such as AAV, lentivirus or lipid nanoparticles, and list the steps in order. Then check every label, strand and step against your sources before you publish or present it.
Common elements in CRISPR and gene therapy diagrams
- Cas protein and guide RNA bound to target DNA
- PAM sequence, spacer region and cut or nick site marked on the strands
- Repair pathways such as NHEJ and HDR shown as separate outcomes
- Delivery vehicles like AAV, lentivirus or lipid nanoparticles
- Step-by-step arrows for ex vivo or in vivo therapy workflows
- A legend for proteins, RNA, DNA strands and edited bases
Frequently Asked Questions
What should a CRISPR diagram show?
A typical CRISPR-Cas9 diagram shows the Cas9 protein guided by a guide RNA to a matching DNA sequence next to a PAM, the double-strand break it makes, and how the cell repairs it through NHEJ or HDR. You can add panels for base editing, prime editing or delivery.
Can it make gene therapy diagrams too?
Yes. Describe an ex vivo workflow (cells collected, edited or transduced, expanded and reinfused) or an in vivo approach with viral vectors or lipid nanoparticles. You can also combine an editing mechanism and a therapy workflow in one multi-panel figure.
Can it show base editing and prime editing?
Yes. Name the components you want, such as a Cas9 nickase fused to a deaminase for base editing, or a reverse transcriptase with a pegRNA for prime editing, and the AI will draw and label them as you describe.
How accurate are the generated diagrams?
The AI draws and labels what you describe, but it does not verify the science. Check strand orientation, PAM position, cut sites and every label, or ask a subject expert to review, before you use the figure in a paper, grant, thesis or lecture.
How much does it cost?
Generation uses credits. A new account gets 10 credits on sign-up and 5 credits each day, and both expire after one day. A standard image costs 5 credits, so a free account can make about one diagram a day. Paid plans and credit packs add more credits.
Can I edit the diagram or export it as SVG or PowerPoint?
Yes. Download the result as a high-resolution PNG, or open it in the editor to keep refining it. From the editor you can convert it to an SVG vector file (10–15 credits) or a PowerPoint PPTX file (10 credits) for further editing.
Can I use the figure in a journal paper, thesis or grant?
Every figure can carry a Publication License Certificate, a one-page PDF naming you as the licensee for journals, theses, presentations and posters; it unlocks with any plan or credit pack. Journals and funders set their own AI-image rules, so check their guidelines.
Do I need design skills?
No. You describe the mechanism or workflow in plain language and the AI handles the composition. If something is off, adjust your description and regenerate, or fix labels and arrows in the editor.
Explore More Tools
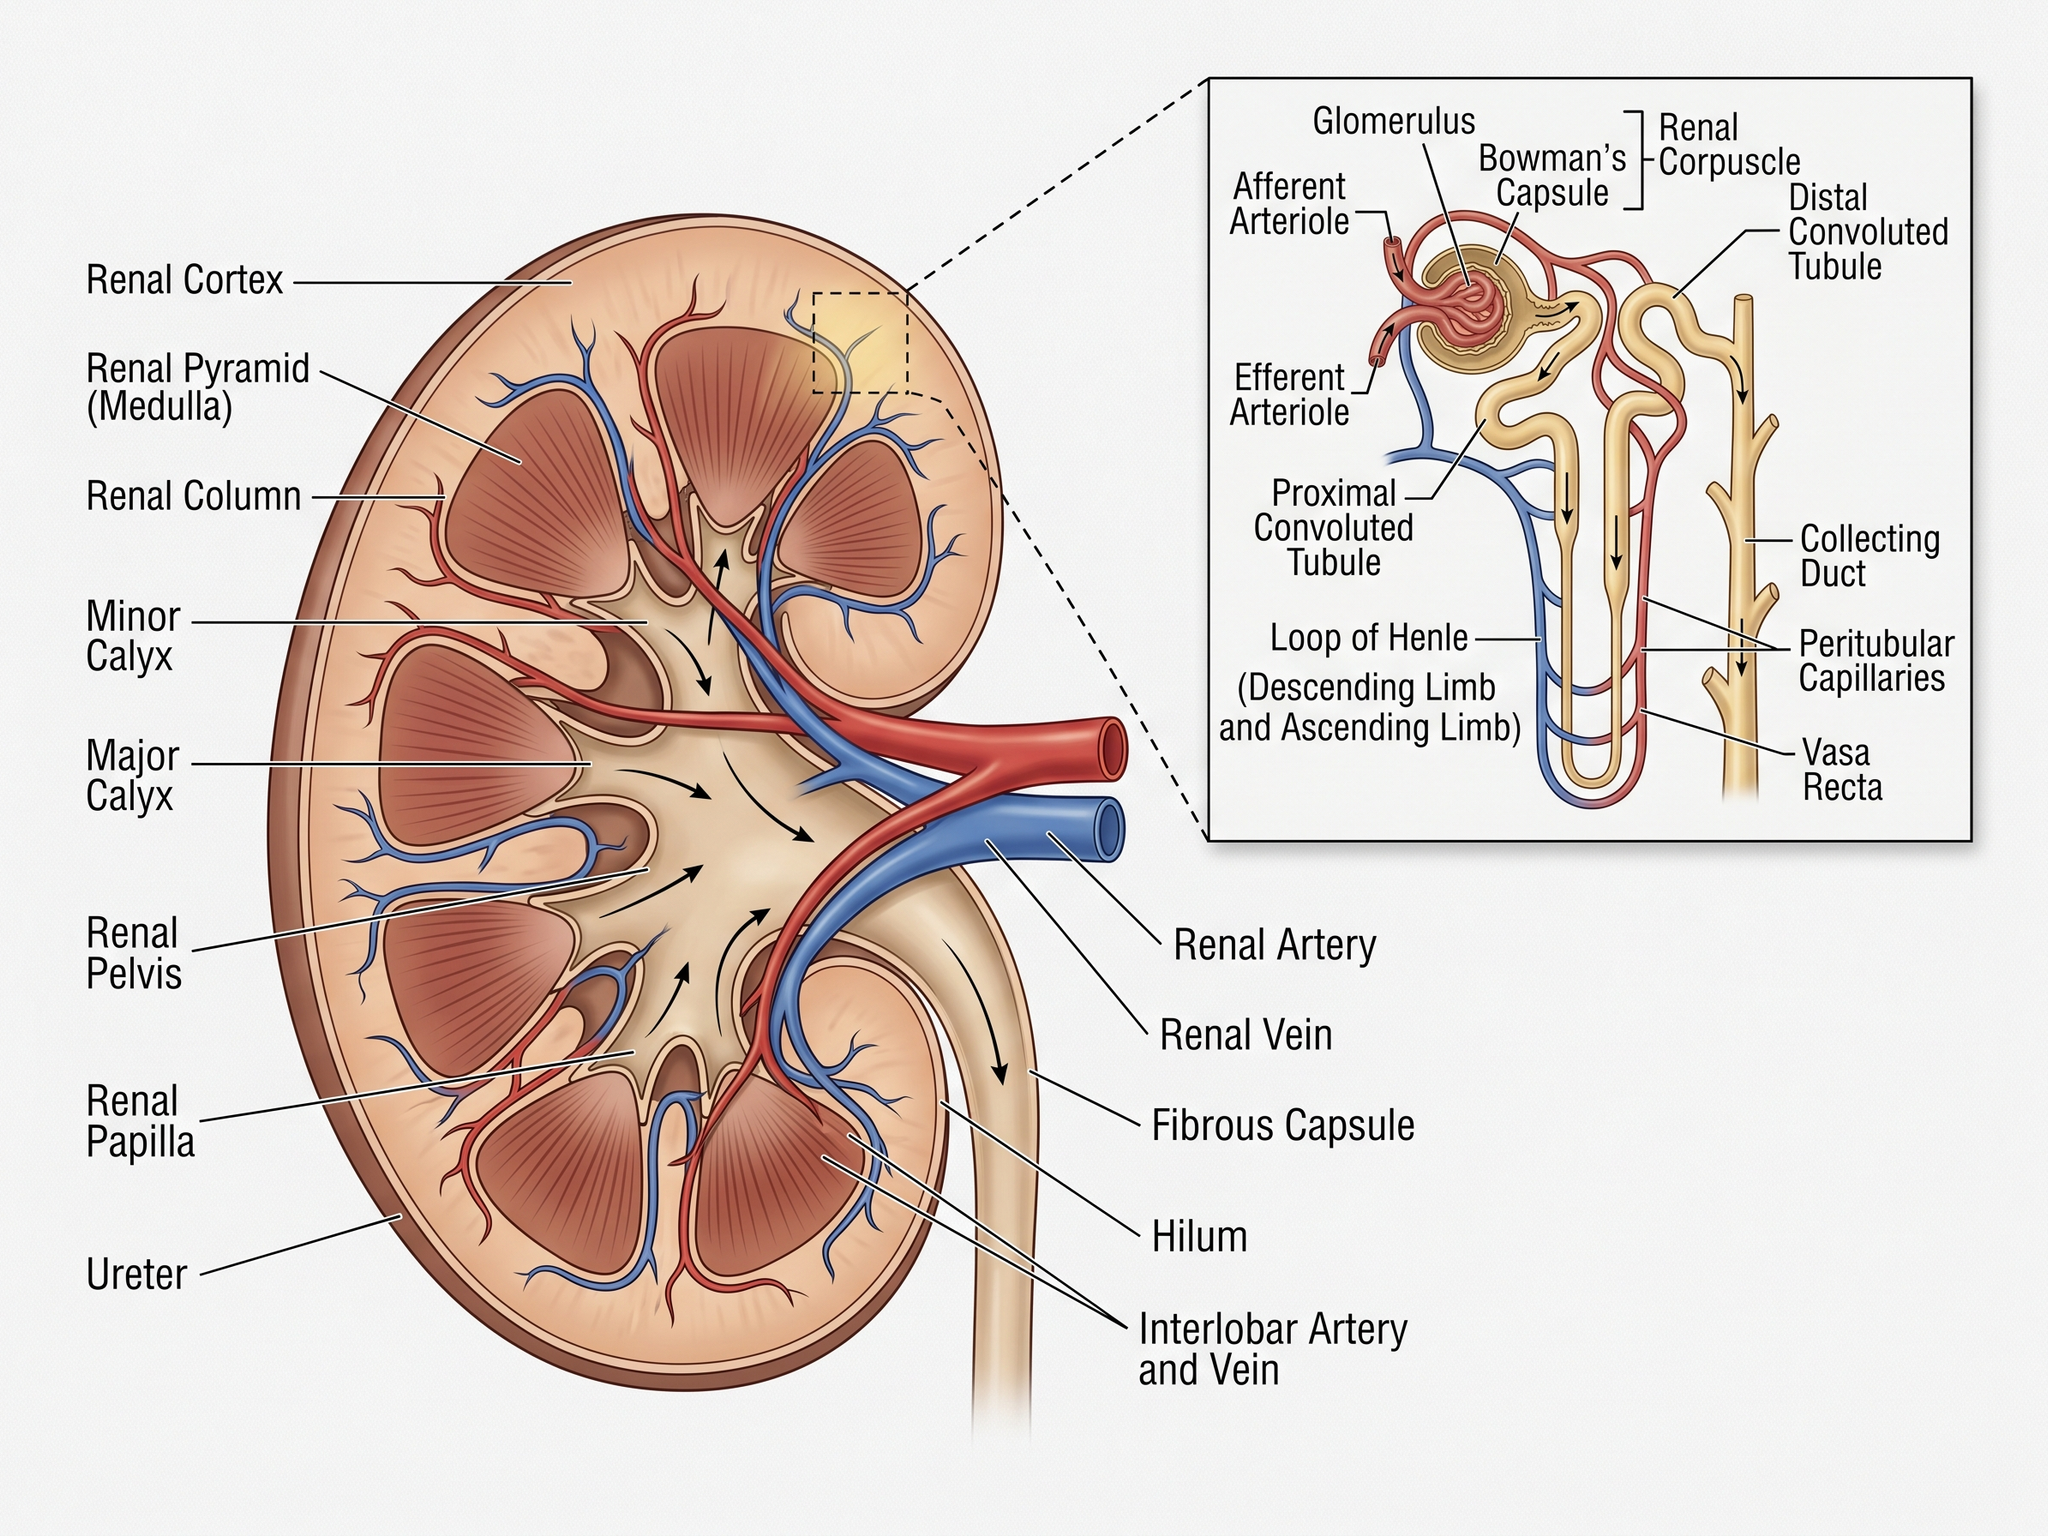
Medical Illustration Generator
Create medical diagrams, anatomy figures, and teaching visuals
Try it free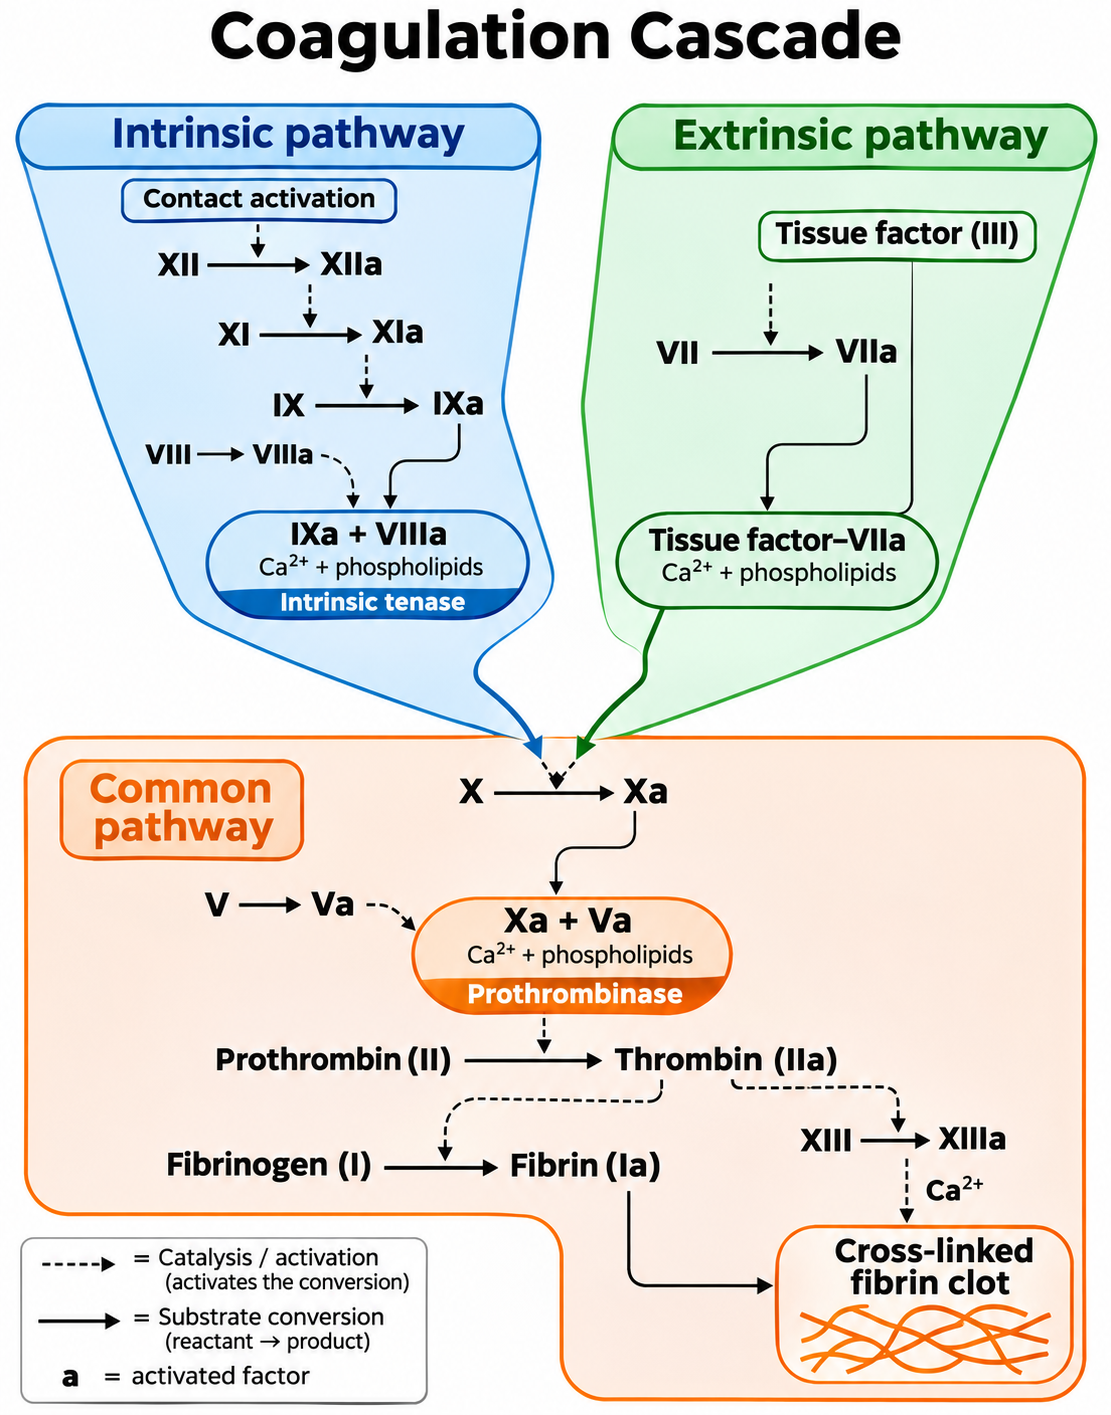
Coagulation Cascade Diagram Generator
Clear clotting pathway figures for papers, theses and teaching
Try it free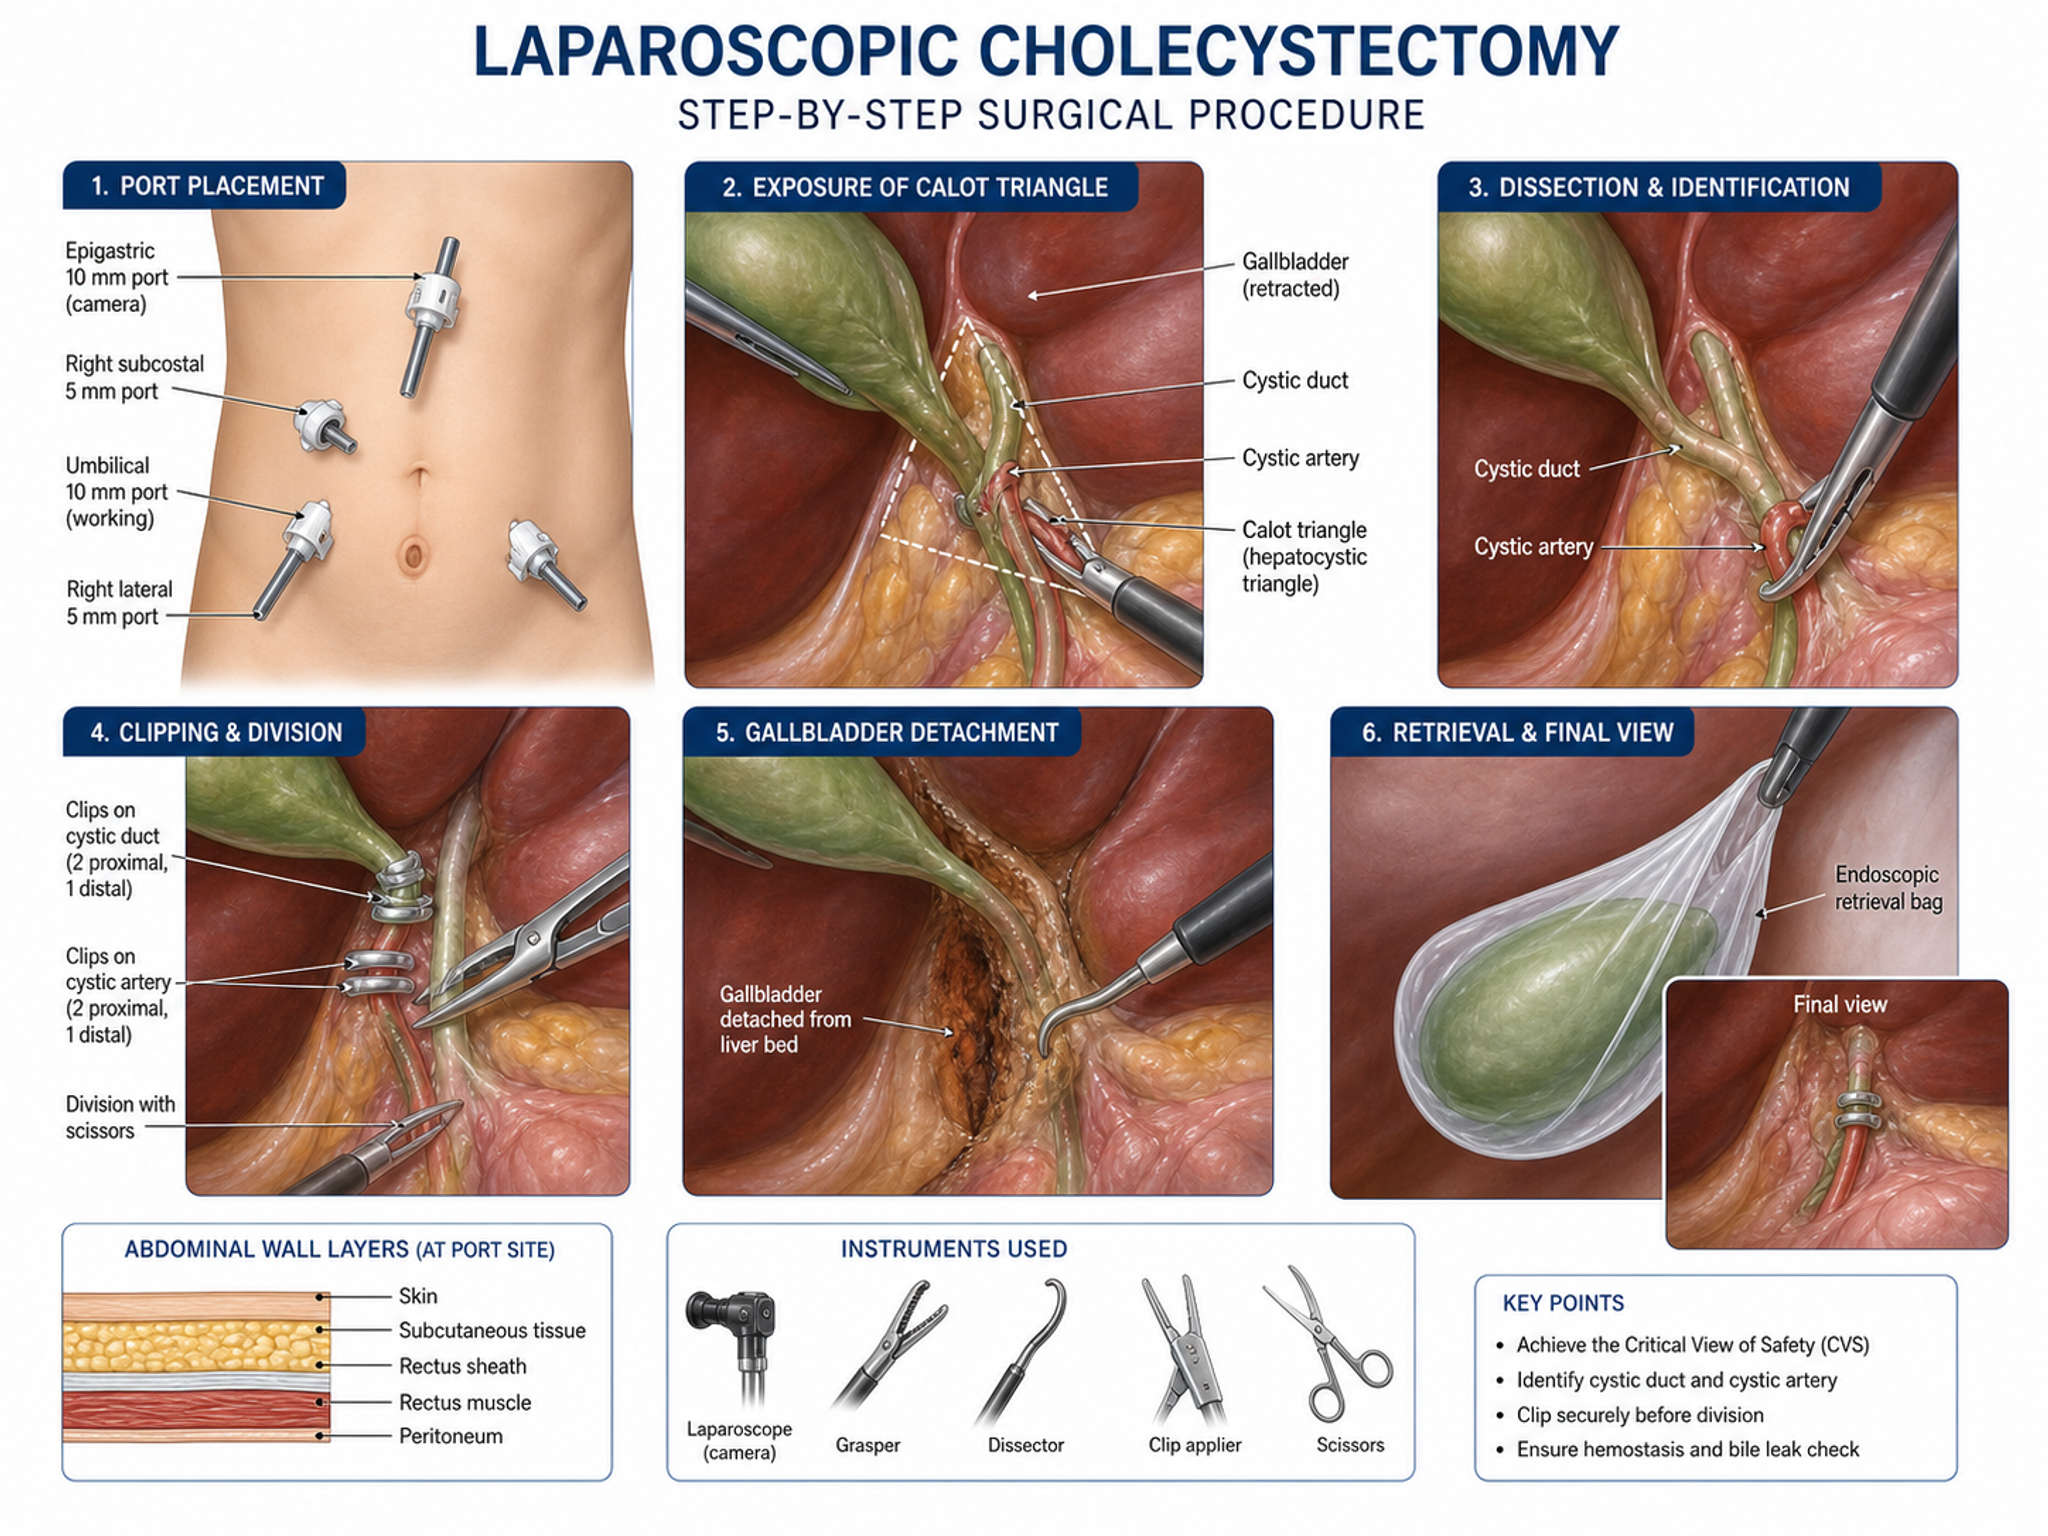
Clinical Illustration Generator
Create anatomical diagrams and medical procedure figures
Try it freeReady to Draw Your Gene Editing Figure?
Describe the mechanism or workflow, review the labels, and get a clean figure for your paper, grant or lecture.