AI Coagulation Cascade Diagram Generator
Clear clotting pathway figures for papers, theses and teaching
Describe the pathway you need and get a labeled coagulation cascade diagram: intrinsic, extrinsic and common pathways, clotting factors, thrombin, fibrin, anticoagulant targets or fibrinolysis, ready to review and refine.
Coagulation Cascade Diagram Examples
Start from a research-style prompt, then adapt it to your paper, lecture or exam review.
Before you submit your figure
Three things to check when the figure is going into a paper, thesis or poster.
Keep it editable
Download a high-resolution PNG, or open the figure in the editor and convert it to SVG (10–15 credits) or PowerPoint PPTX (10 credits) so you can adjust labels and layout later.
Publication License Certificate
Each figure can carry a one-page PDF certificate naming you as the licensee for journals, theses, presentations and posters. It unlocks with any paid plan or credit pack.
How certificates workCheck your journal's AI policy
Publishers set their own rules: some do not accept AI-generated images in certain figure types, and many require you to disclose AI use. Read your target journal's author guidelines first.
Journal figure requirementsAI diagrams of the coagulation cascade and hemostasis
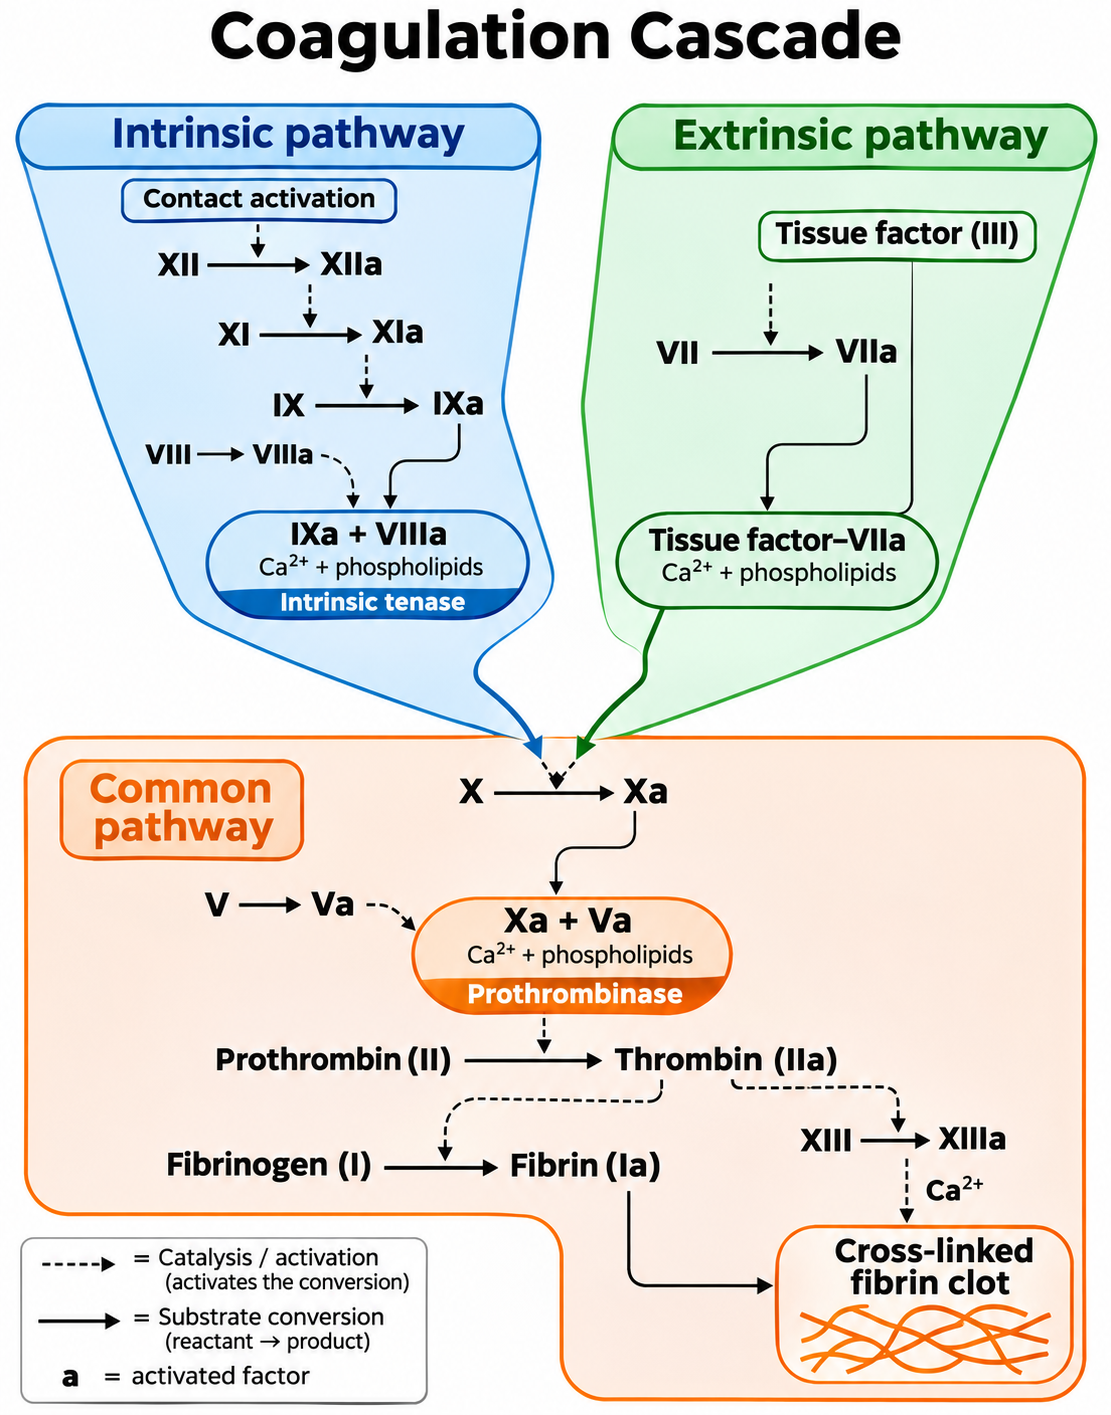
This generator turns a written brief into a labeled draft of the clotting cascade or a related hemostasis process. Name the model (classic or cell-based), the factors and steps to include, and the purpose, such as a review article figure, a thesis chapter, a grant schematic or a hematology lecture slide.
Why a clear coagulation cascade diagram matters
- The cascade has many factors and feedback loops that are hard to follow in text alone
- Review articles and theses on thrombosis or bleeding disorders need a clean pathway overview
- Pharmacology papers and lectures need to show exactly where each anticoagulant acts
- Students preparing for exams remember pathways better from a well-organized figure
- A consistent figure style keeps multi-panel hematology figures readable
How to describe a good coagulation cascade diagram
Say which model you want, list the factors and cofactors to label, and decide how activation, inhibition and feedback should be drawn, for example solid arrows for activation, flat-ended bars for inhibition and dashed arrows for thrombin feedback. Mention the layout, color coding and audience. Then check every factor, arrow and drug target against your sources before you publish or teach with it.
Common elements in coagulation cascade diagrams
- Intrinsic, extrinsic and common pathways in distinct colors
- Clotting factors labeled with roman numerals and an 'a' for the activated form
- Tissue factor, calcium and phospholipid cofactors where they act
- Prothrombin to thrombin and fibrinogen to fibrin as the final steps
- Feedback loops and natural inhibitors such as antithrombin and protein C
- Drug target markers or test labels when the figure is for pharmacology or lab medicine
Frequently Asked Questions
What is a coagulation cascade diagram?
It is a figure that shows how clotting factors activate one another to turn prothrombin into thrombin and fibrinogen into a fibrin clot. Most diagrams show the intrinsic, extrinsic and common pathways; newer ones use the cell-based model of initiation, amplification and propagation.
Can it draw the cell-based model instead of the classic cascade?
Yes. Ask for the cell-based model and name its phases and surfaces, such as tissue factor-bearing cells and activated platelets. You can also request both models side by side in a two-panel figure for a review article or lecture.
Can I show anticoagulant drugs or lab tests on the diagram?
Yes. List the drugs or tests and where they act, for example heparin with antithrombin, warfarin on vitamin K-dependent factors, or which pathway PT and aPTT measure. The AI places markers where you describe them, so check each one against your sources.
How accurate are the generated diagrams?
The AI draws and labels what you describe, but it does not verify the science. Review every factor, arrow, cofactor and drug target, or have a hematologist or subject expert check it, before you use it in a paper, thesis, lecture or patient material.
How much does it cost?
Generation uses credits. A new account gets 10 credits on sign-up and 5 credits each day, and both expire after one day. A standard image costs 5 credits, so a free account can make about one diagram a day. Paid plans and credit packs add more credits.
Can I edit the diagram or export it as SVG or PowerPoint?
Yes. Download the result as a high-resolution PNG, or open it in the editor to keep refining it. From the editor you can convert it to an SVG vector file (10–15 credits) or a PowerPoint PPTX file (10 credits) for further editing.
Can I use the figure in a journal paper, thesis or poster?
Every figure can carry a Publication License Certificate, a one-page PDF naming you as the licensee for journals, theses, presentations and posters; it unlocks with any plan or credit pack. Journals set their own AI-image rules, so check the author guidelines first.
Do I need design skills?
No. You describe the pathway, labels and layout in plain language and the AI handles the composition. If something is off, adjust your description and regenerate, or fix labels and arrows in the editor.
Explore More Tools
Ready to Draw Your Coagulation Cascade?
Describe the pathway, review the labels, and get a clean figure for your paper, thesis or lecture.