
ECG figures are one of the highest-demand medical visuals because learners need three things at once: waveform accuracy, label clarity, and side-by-side comparison. Generic image prompts usually fail on all three.
This guide gives you a practical ECG prompt system plus 30 templates you can use immediately in SciDraw AI.
Use case: medical education slides, exam review handouts, bedside teaching, and publication-ready concept figures.
Why ECG Prompts Usually Fail
Most prompts are too short, for example: "draw third degree heart block ECG". That often produces artistic traces, missing labels, or clinically inconsistent intervals.
Strong ECG prompts should include:
- clinical scenario (what rhythm or pathology)
- waveform rules (PR, QRS, ST, T wave behavior)
- panel structure (single strip vs side-by-side comparison)
- annotation requirements (lead names, arrows, interval labels)
- teaching context (student level and intended learning goal)
Prompt Formula for Accurate ECG Figures
Use this structure:
Create a medical teaching ECG diagram of [condition].
Layout: [single strip / 2-panel / 4-panel comparison], white background.
Show leads: [lead II / V1-V6 / 12-lead summary].
Waveform rules: [PR/QRS/ST/T specifics].
Add labels: [key findings, arrows, interval values].
Style: clean textbook-style vector, high contrast, publication-ready.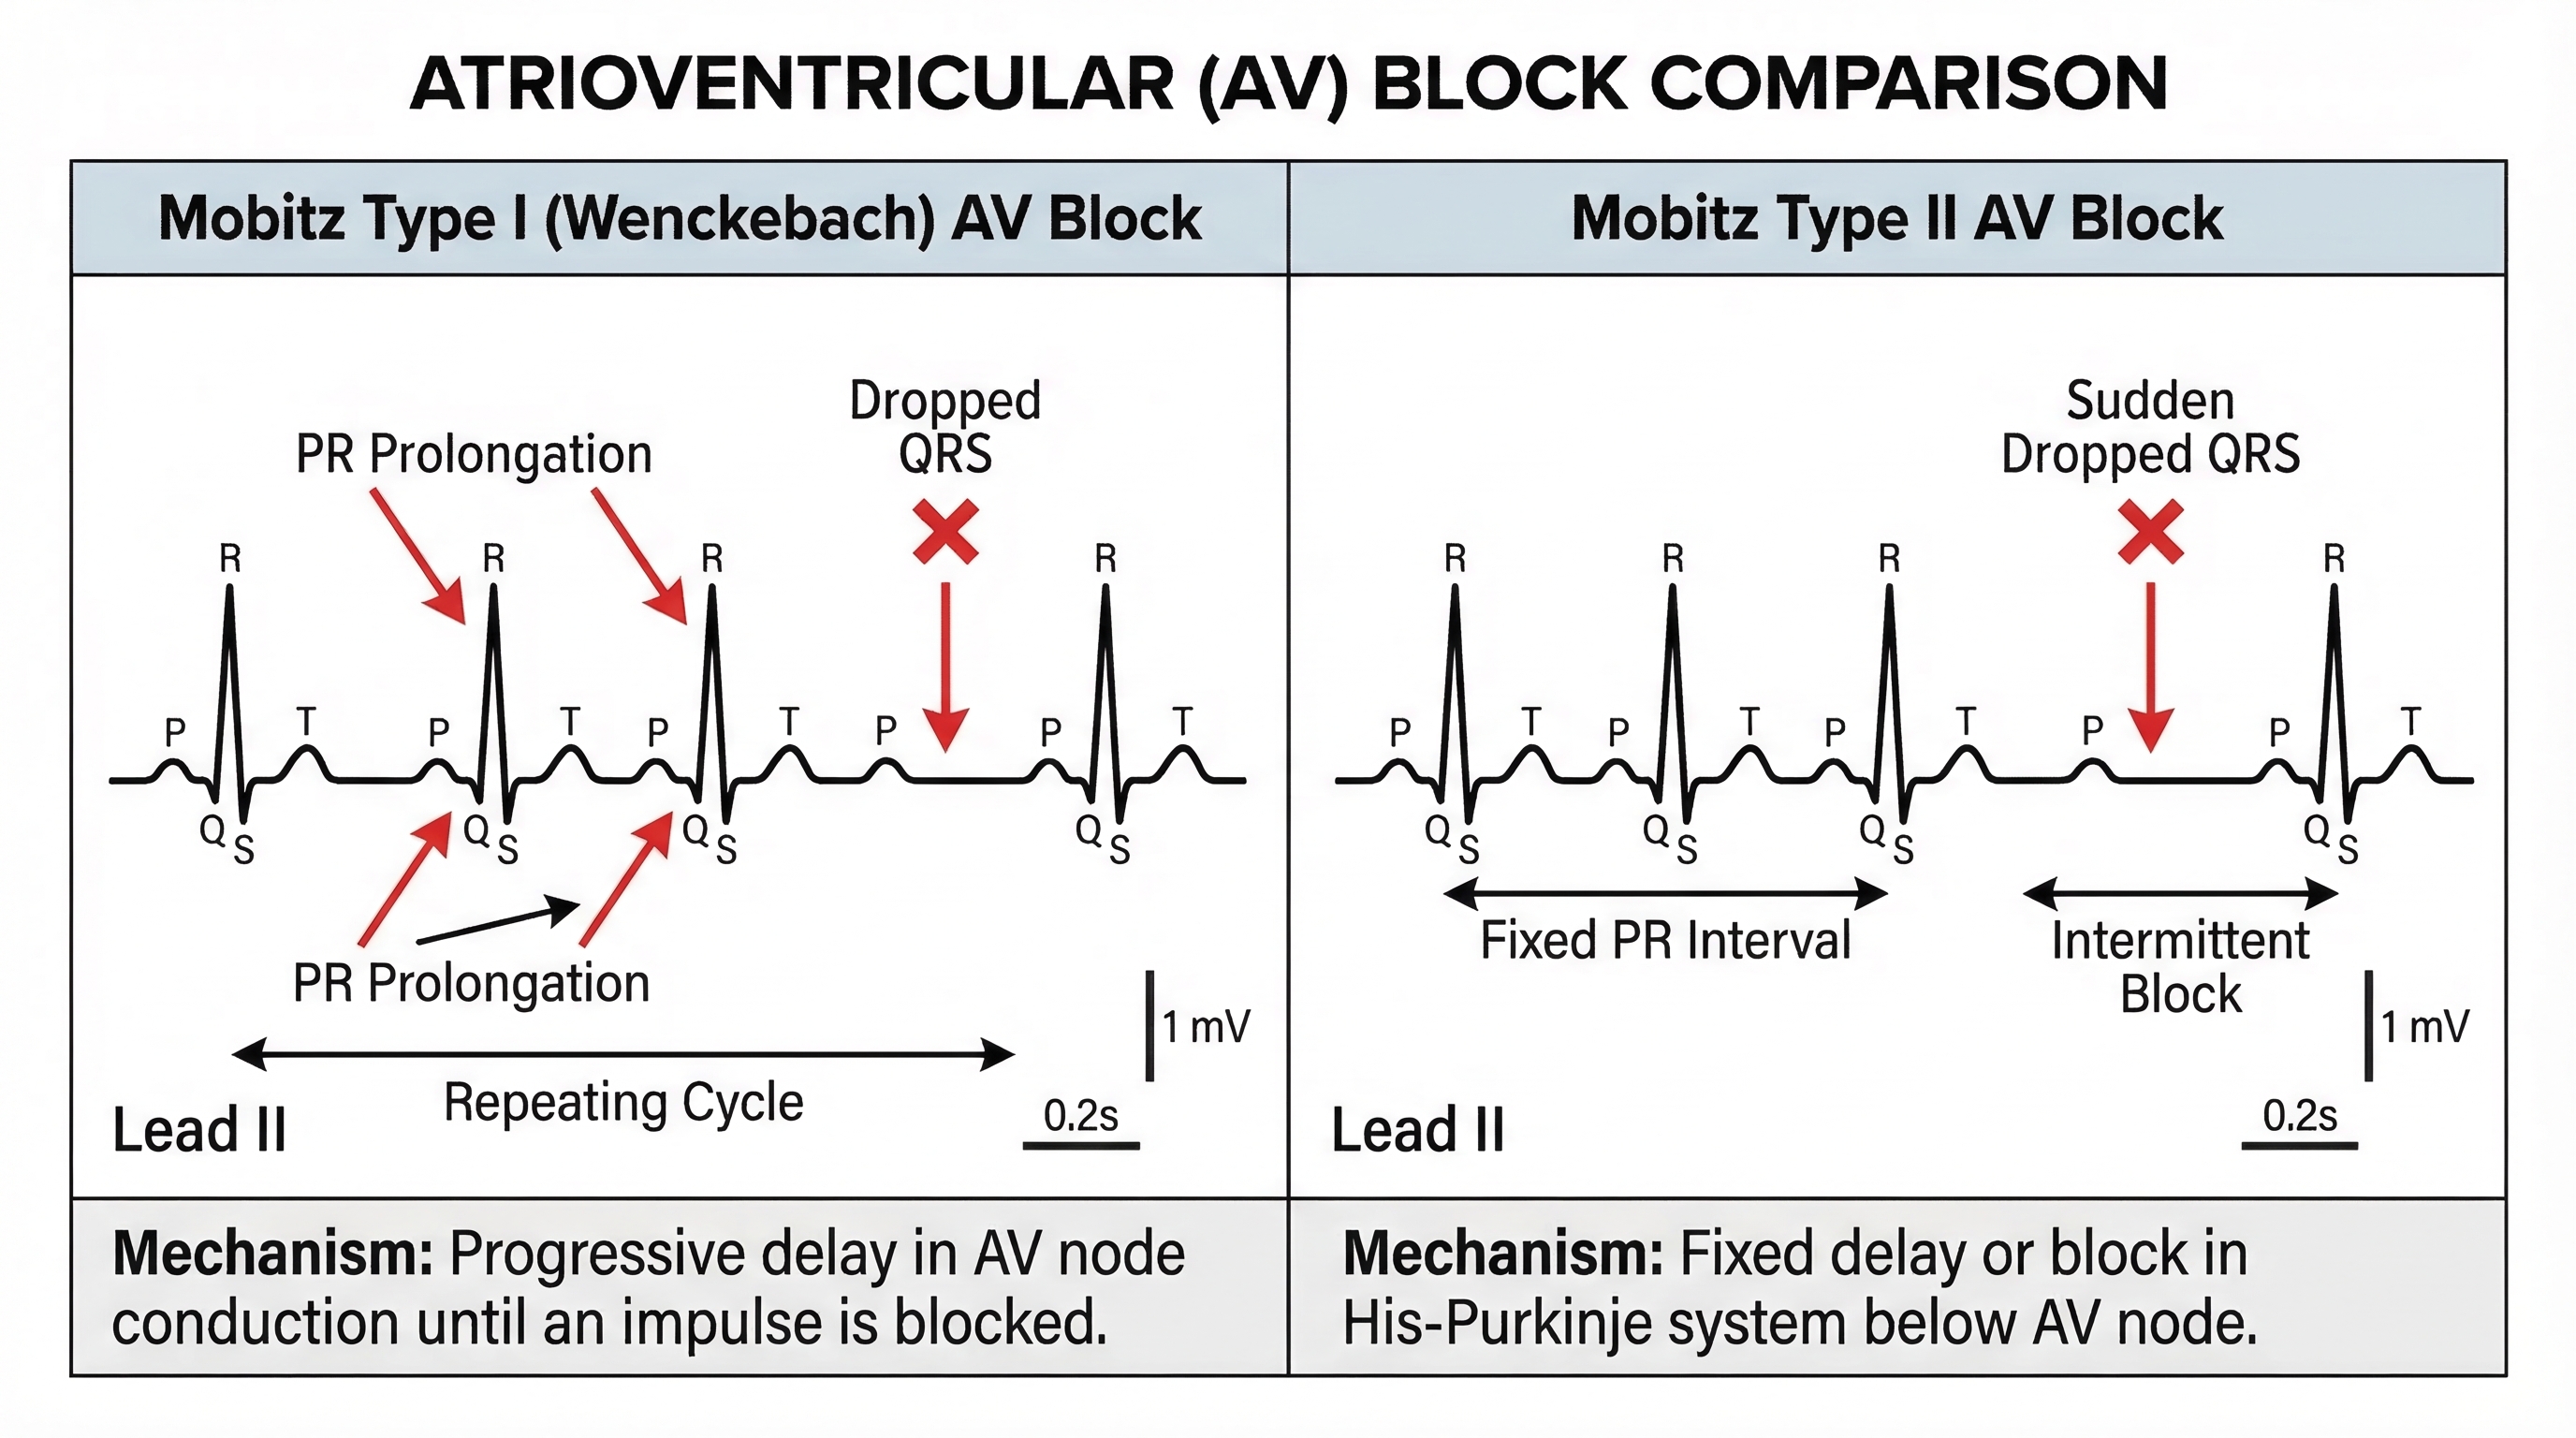
30 ECG Prompt Templates
1) Conduction Blocks
Third-degree AV block ECG teaching diagram, 2-panel layout.
Panel A: normal sinus rhythm reference. Panel B: complete AV dissociation with
independent P waves and QRS escape rhythm. Label PR inconsistency, slow
ventricular rate, and AV dissociation arrows. Clean textbook style.
Mobitz I vs Mobitz II comparison ECG, side-by-side.
Left: progressive PR prolongation before dropped QRS. Right: fixed PR with
intermittent non-conducted P wave. Add interval callouts and color-coded labels.First-degree AV block ECG, lead II strip with normal morphology but prolonged
PR interval >200 ms. Add measurement bars and label thresholds.2) Ischemia and Infarction
STEMI localization ECG chart, 4-panel grid.
Inferior, anterior, lateral, and posterior patterns with affected leads and
reciprocal changes labeled. Include artery correlation notes.
NSTEMI vs STEMI ECG teaching figure, 2-panel comparison.
Left: NSTEMI ST depression/T inversion pattern. Right: STEMI ST elevation with
contiguous leads. Add decision labels for emergency pathway.Hyperacute T wave progression to ST elevation timeline in acute MI, 3-stage
horizontal diagram with clear temporal arrows.3) Arrhythmia Recognition
Atrial fibrillation ECG teaching figure, irregularly irregular rhythm,
no discrete P waves, variable R-R intervals. Add rhythm strip markers.
Atrial flutter ECG with sawtooth flutter waves and 2:1 conduction example.
Include lead II emphasis and comparison inset with sinus rhythm.SVT vs ventricular tachycardia quick differentiation chart with QRS width,
rate range, and AV relationship labels.4) Wave Morphology and Electrolytes
T-wave morphology atlas ECG panel: peaked T wave, inverted T wave,
biphasic T wave, and hyperacute T wave with labels and clinical hints.
Hyperkalemia progression ECG sequence: peaked T, PR prolongation,
QRS widening, sine-wave morphology. Four-stage panel with arrows.Osborn wave (J wave) educational ECG figure in hypothermia context,
with notch labeling at J point and differential notes.5) Teaching and Assessment Layouts
ECG interpretation checklist infographic for medical students.
Sections: rate, rhythm, axis, intervals, morphology, ischemia signs.
Include icon-based flow and quick examples.
12-lead ECG systematic reading workflow, top-to-bottom algorithm chart with
branch decisions and common pitfalls.ECG exam review summary page with mini-strips and key diagnostic clues,
optimized for one-page print handout.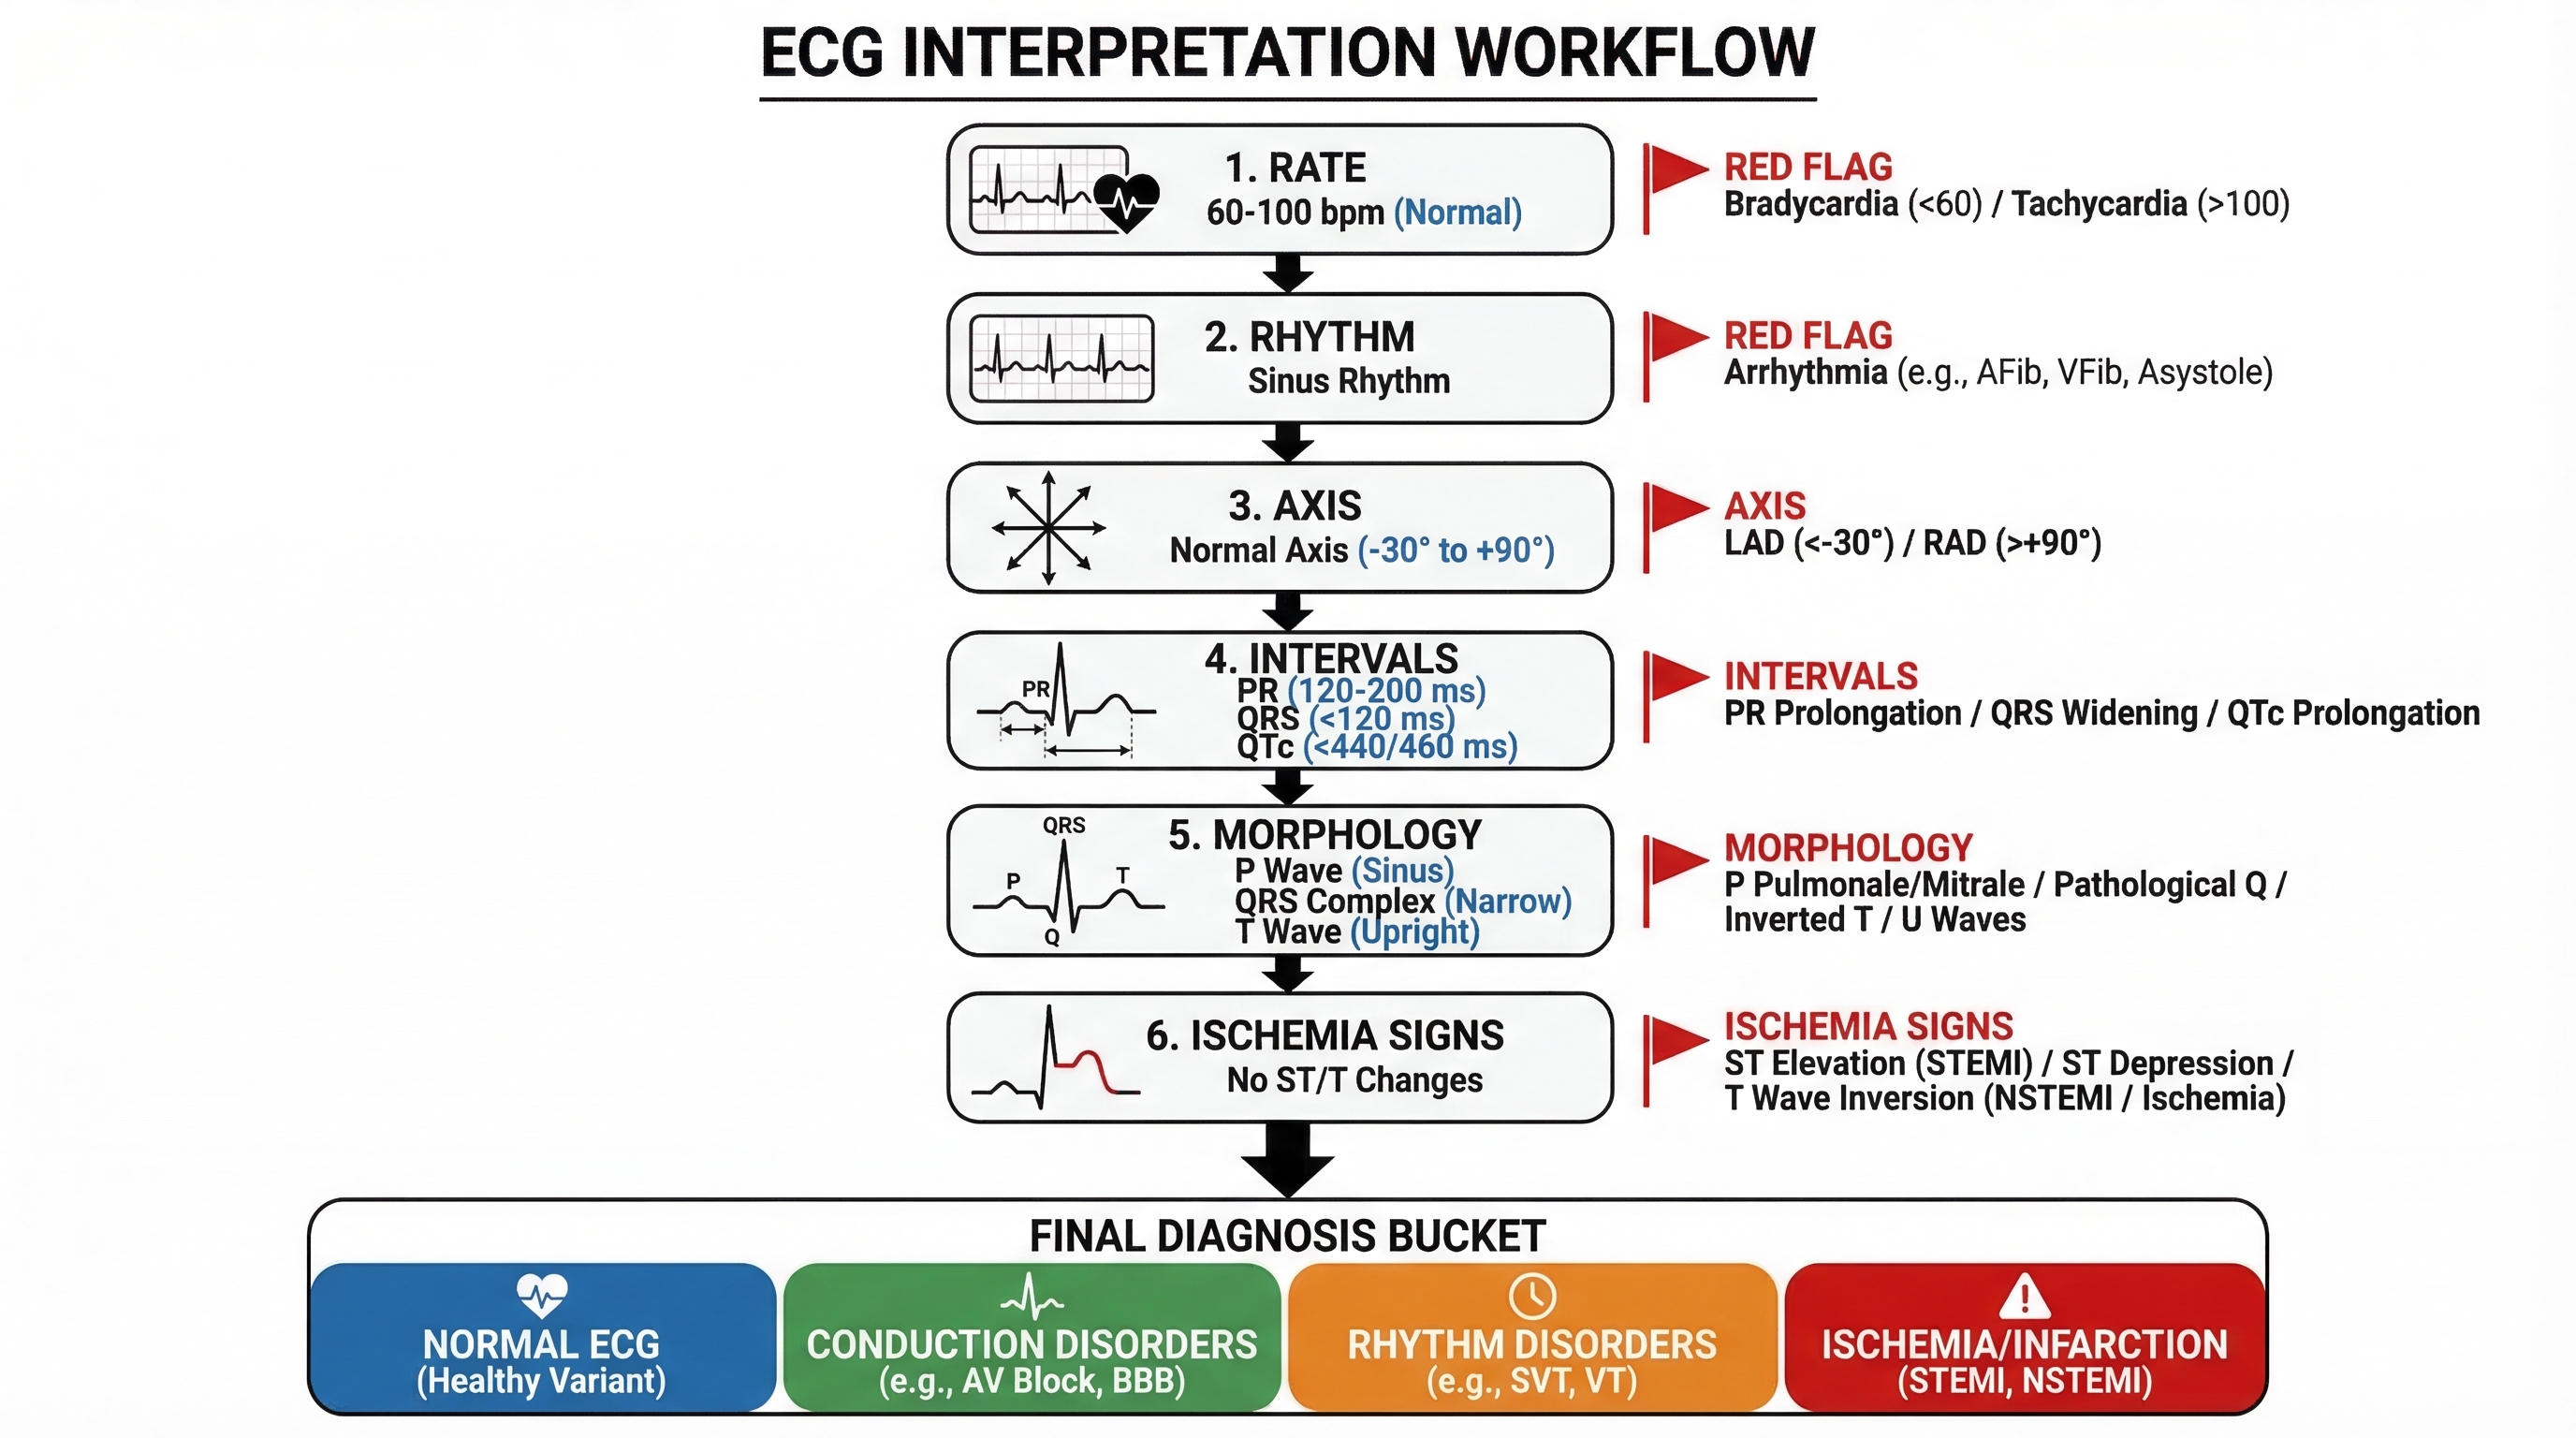
You can adapt each template by replacing only the condition and waveform rules.
Quality Checklist Before Export
- Is the waveform clinically plausible?
- Are lead names and labels readable at slide scale?
- Does the comparison layout answer one teaching question clearly?
- Are interval values and diagnostic clues explicitly annotated?
- Is the color scheme clean enough for projection and print?
Final Tip
If your output looks "beautiful but vague", add stricter waveform constraints and explicit label requirements. In ECG visuals, precision beats decoration.
Ready to generate your own ECG teaching figures?
Try SciDraw AI ECG prompts now
Related Guides
- Medical Illustration Generator — create medical diagrams and teaching visuals
- Clinical Illustration Generator — create clinical education figures
- Clinical Examination Diagram Prompts — step-by-step teaching figures
- CT, MRI, and CXR Illustration Prompts — clinical imaging templates
- Biomedical Illustration Prompts — 50 AI prompts for biomedical visuals
- 8 AI Prompt Rules for Scientific Figures — prompt techniques for medical diagrams


")
")